Project 1 - Parsing NASA thermodynamic data
AIM :
To write a program in MATLAB to parse the NASA thermodynamics data file and calculate the thermodynamic properties of various gas species.
OBJECTIVE :
1. To write a function that extracts the 14 co-efficient and calculate the specific heat,enthalpy and entropy for all the species in the data file.
2. To calculate the molecular weight of each species and display in the command window.
3. To plot Cp,Enthalpy and Entropy for the local temprature ranges for each species.
4. To save the plot as images with names and dump them in separate folders for each species .
5. The main program will just take the 'THERMO.dat' file input and generate Cp,H and S plots.
THEORY :
FILE PARSING :
Parsing a file means reading the data stream of some sort and buildings an in memory model of sematics content of the data.itb is the method of splitting the file or other input into the a piece of data that can be easily stored or manipulated .
SPECIFIC HEAT :
Specific heat, the quantity of heat required to raise the temperature of one gram of a substance by one Celsius degree. The units of specific heat are usually calories or joules per gram per Celsius degree.

ENTROPY :
Entropy is the loss of energy available to do work. Another form of the second law of thermodynamics states that the total entropy of a system either increases or remains constant, it never decreases. Entropy is zero in a reversible process,it increases in an irreversible process.

ENTHALPY :
Enthalpy the sum of the internal energy and the product of the pressure and volume of a thermodynamic system. according to the law of energy conservation, the change in internal energy is equal to the heat transferred to, less the work done by, the system.

where ,
Cp = specific heat
S = entrophy
H = enthalpy
R = universal gas constant
T = temprature
MAIN CODE :
clear all
close all
clc

% reading the data file

f1 =fopen('THERMO.DAT','r');
for i =1:5
    fgetl(f1);
end

% reading the species

for i = 1:53
tline1 = fgetl(f1);
split_line =strsplit(tline1,' ')
species = split_line{1};
find_dot =strfind(tline1,'.');
local_low_temp = str2double(tline1(find_dot(1)-3:find_dot(1)));
local_high_temp = str2double(tline1(find_dot(2)-4:find_dot(2)));   % converting string
local_mid_temp = str2double(tline1(find_dot(3)-4:find_dot(3)));      to number

tline = fgetl(f1);          % getting the next line
a = strfind(tline,'E');      % finding the E
a1 = tline(1:a(1)+3);
a1 = str2double(a1);
a2 = tline(a(1)+4:a(2)+3);
a2 = str2double(a2);
a3 = str2double(tline(a(2)+4:a(3)+3));
a4 = str2double(tline(a(3)+4:a(4)+3));
a5 = str2double(tline(a(4)+4:a(5)+3));

tline=fgetl(f1);
b  = strfind(tline,'E');
a6 = str2double(tline(1:b(1)+3));
a7 = str2double(tline(b(1)+4:b(2)+3));
a8 = str2double(tline(b(2)+4:b(3)+3));
a9 = str2double(tline(b(3)+4:b(4)+3));
a10 = str2double(tline(b(4)+4:b(5)+3));

tline = fgetl(f1);
c = strfind(tline,'E');
a11 = str2double(tline(1:c(1)+3));
a12 =str2double(tline(c(1)+4:c(2)+3));
a13 = str2double(tline(c(2)+4:c(3)+3));
a14 = str2double(tline(c(3)+4:c(4)+3));


% first 7 are high temprature co-efficients from a1 to a7
% second 7 are  low temprature co-efficients from a8 to a14

% creating the range of low and high values of local temprature


R=287;
T=linspace(local_low_temp,local_high_temp,100);
if T> local_mid_temp

% specific heat


Cp=R.*(a1+a2*T+a3*T.^2+a4*T.^3+a5*T.^4);
else
Cp=R.*(a8+a9*T+a10*T.^2+a11*T.^3+a12*T.^4);
end

% enthalpy


if T> local_mid_temp
  H = R*T.*(a1+((a2*T)/2) + ((a3*(T).^2)/3) + ((a4*(T).^3)/4) + ((a5*(T).^4)/5) + ((a6./(T))));
else
  H = R*T.*(a8+((a9*T)/2) + ((a10*(T).^2)/3) + ((a11*(T).^3)/4) + ((a12*(T).^4)/5) + ((a13./(T))));
end

% entropy


if T>local_mid_temp
    S = R.*((a1*log(T) + (a2*(T)) + (a3*(T).^2) + ((a4*(T).^3)/3) + (a5*(T).^4)/4)+a7);
else
     S = R.*((a8*log(T) + (a9*(T)) + (a10*(T).^2) + ((a11*(T).^3)/3) + (a12*(T).^4)/4) + a13);
end

t=sprintf('%s',species);
mkdir(t)
cd(t)

% plotting specific vs temprature


figure(1)
plot(Cp,T,'color','r','LineWidth',2)
xlabel('Specifc_heat')
ylabel('Temperature')
title(species)
saveas(1,'Specific_heat.jpeg')

% plotting enthalpy vs temprature


figure(2)
plot(H,T,'color','g','LineWidth',2)
xlabel('Enthalpy')
ylabel('Temperature')
title(species)
saveas(2,'Enthalpy.jpeg')

% plotting entrophy vs temprature


figure(3)
plot(S,T,'color','b','LineWidth',2)
xlabel('Entropy')
ylabel('Temperature')
title(species)
saveas(3,'Entropy.jpeg')

cd ..
f = molecular_weight(species);
end
FUNCTION CODE CALLS FOR MOLECULAR WEIGHT :
function W = molecular_weight(species)
atomic_name = ['H','C','O','N','A'];
atomic_weight = [1.007 12.011 15.999 14.007 13.948 ];
W=0;
for i = 1:length(species)
for    j = 1:length(atomic_name)
    if strcmp(species(i),atomic_name(j))
        W = W+atomic_weight(j);
        position = j;
    end

end
  k = str2num(species(i));
    if k>1
        W = W+atomic_weight(position)*(k-1);
    end
end
sprintf('%s species %s %f',species,'molecular_mass',W)
end
EXPLANATION THE CODE :
1. The program begins with clear all,close all and clc commands to free uup the command window and the workspace.
2. I have used the fopen , command to open the 'NASA thermodynamics file', and read the file.
3. I have used fgetl command to read the first line in the file.
4. Second line consists of 3 temprature values ,likes first line use fgetl command to read the 2nd line and store it in variable global temprature .
5. strsplit command use the blank space as a delimeter , strsplit uuse the command to split the data using the given delimeter .Therefore, temprature range consists of all three temprature values in a vector.
6. Now , i can obtain the local temprature of (low, mid and high) then i used the str2num command to converts the string into the numbers.
5. The name of the gas species we will be found out using the command findstr and we are going to laocate the string.
6. Now we extract the co-efficient for the gas species in which the co - efficient location are like in the 2nd row ,next 5 in the 3rd row and the rest in the 4th row.
7. Now we find out the local temprature by using the findstr and str2num commands and store it in the variable a1 to a14, then we will locate the position of E .
8. The values from a1 to a7 are the high temprature co-efficients and a8 to a14 are the low temprature co-efficients.
9. I use the linspace command for temprature range from low temprature to low temprature assinged.
10. Then i can uused the for loop command is used to calculate the values of specific heat , ethalphy, and entrophy.
11. Then i use if and else command is also uused to find out required valuues if the temprature below the mid temprature or above the mid temprature.
12. plotting the all the plot of gas species and create the folders of all gas species co effiicient.
OUTPUT :
O2 PLOT :
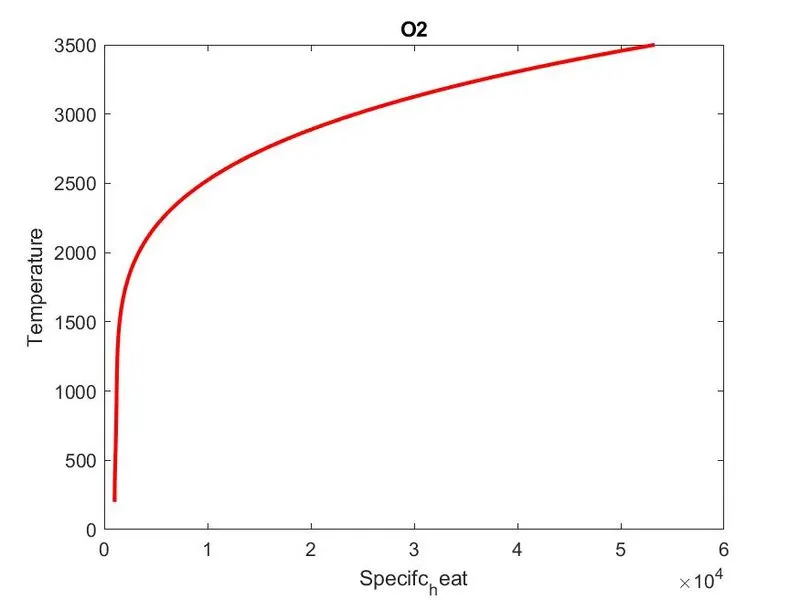
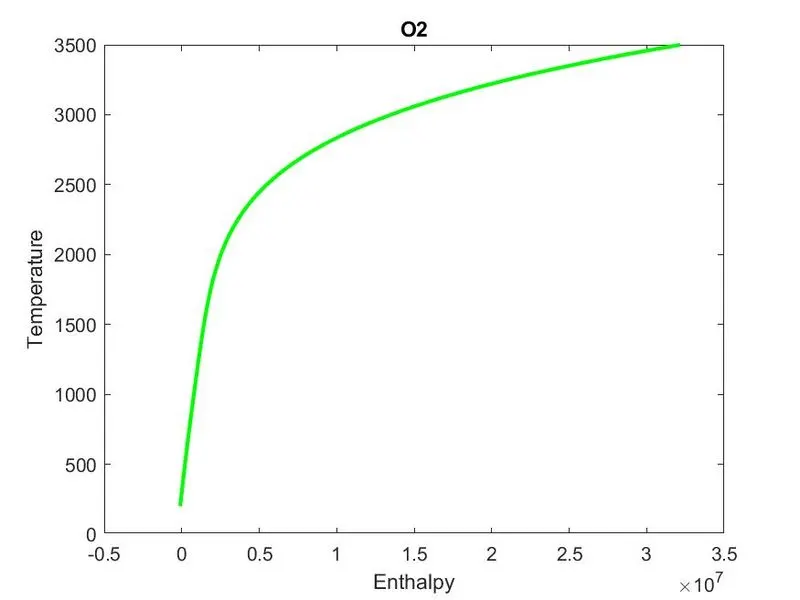
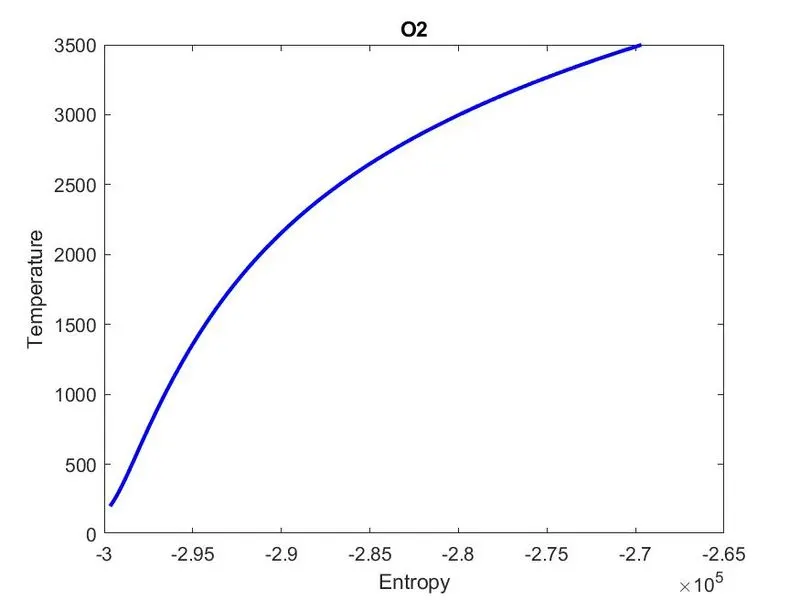
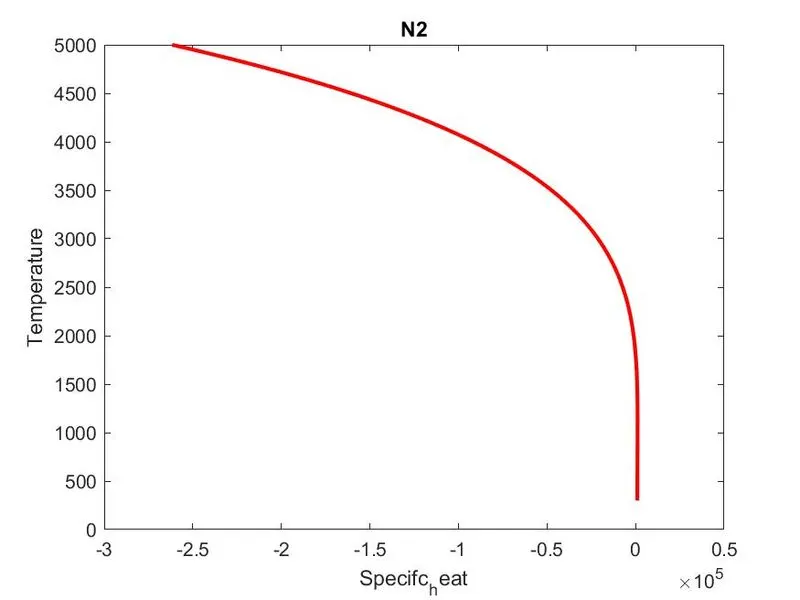
N2 PLOT :
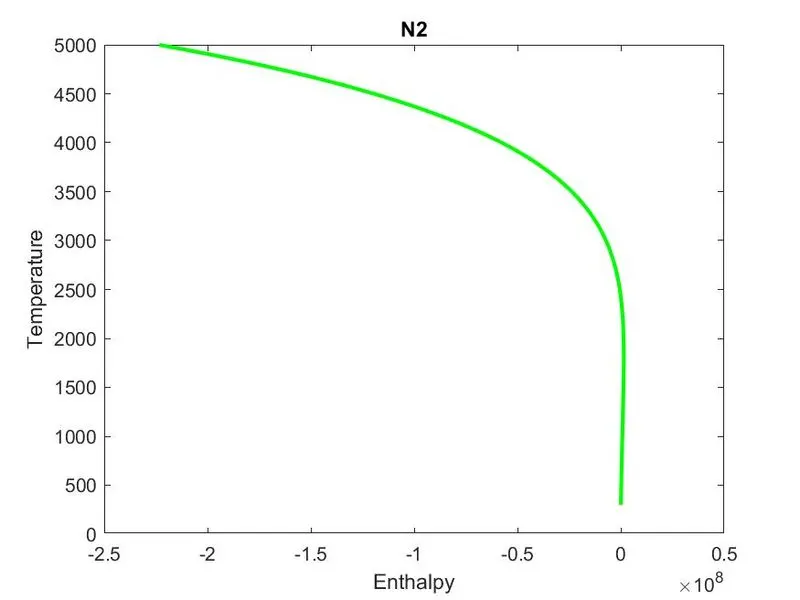
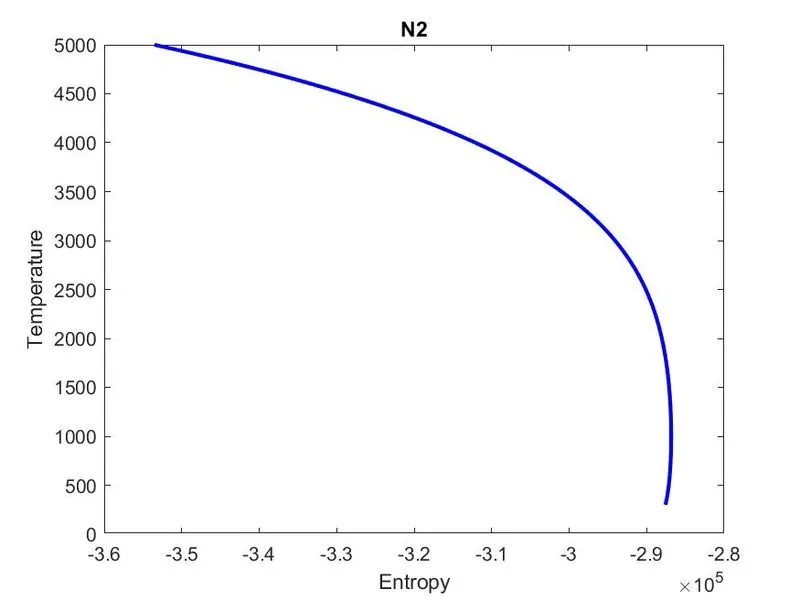
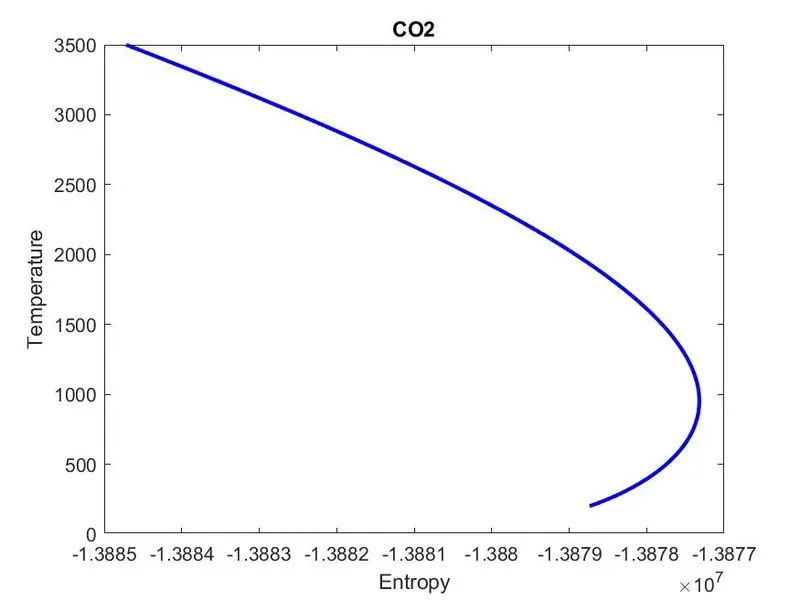
CO2 PLOT :
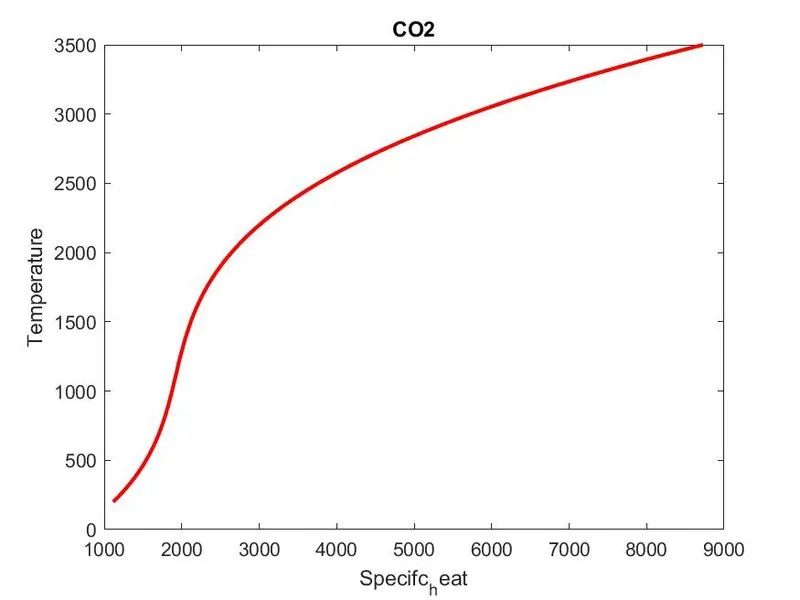
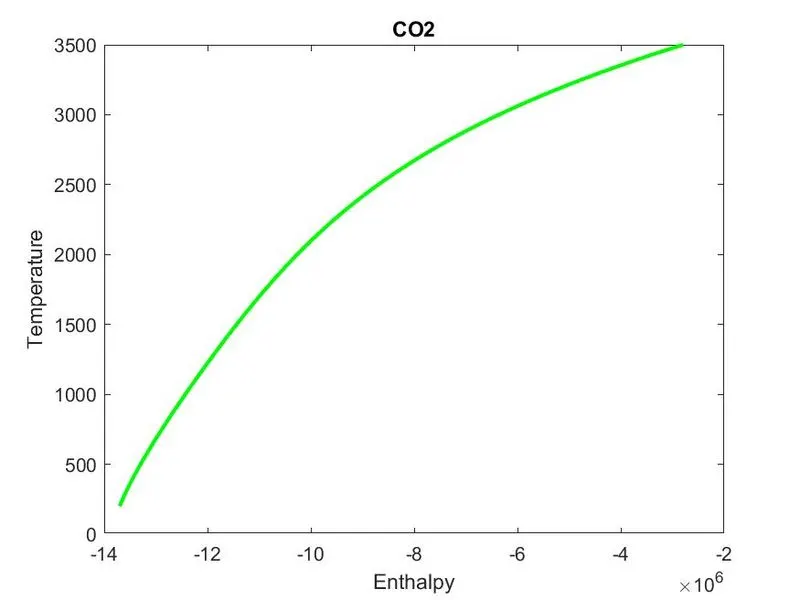
FOLDERS CONTAINS ALL THE SPECIES NAMES:

MOLECULAR WEIGHT FOR ALL SPECIES DISPLAY IN THE COMMAND WINDOW :
ans =
'O species molecular_mass 15.999000'
ans =
'O2 species molecular_mass 31.998000'
ans =
'H species molecular_mass 1.007000'
ans =
'H2 species molecular_mass 2.014000'
ans =
'OH species molecular_mass 17.006000'
ans =
'H2O species molecular_mass 18.013000'
ans =
'HO2 species molecular_mass 33.005000'
ans =
'H2O2 species molecular_mass 34.012000'
ans =
'C species molecular_mass 12.011000'
ans =
'CH species molecular_mass 13.018000'
ans =
'CH2 species molecular_mass 14.025000'
ans =
'CH2(S) species molecular_mass 14.025000'
ans =
'CH3 species molecular_mass 15.032000'
ans =
'CH4 species molecular_mass 16.039000'
ans =
'CO species molecular_mass 28.010000'
ans =
'CO2 species molecular_mass 44.009000'
ans =
'HCO species molecular_mass 29.017000'
ans =
'CH2O species molecular_mass 30.024000'
ans =
'CH2OH species molecular_mass 31.031000'
ans =
'CH3O species molecular_mass 31.031000'
ans =
'CH3OH species molecular_mass 32.038000'
ans =
'C2H species molecular_mass 25.029000'
ans =
'C2H2 species molecular_mass 26.036000'
ans =
'C2H3 species molecular_mass 27.043000'
ans =
'C2H4 species molecular_mass 28.050000'
ans =
'C2H5 species molecular_mass 29.057000'
ans =
'C2H6 species molecular_mass 30.064000'
ans =
'CH2CO species molecular_mass 42.035000'
ans =
'HCCO species molecular_mass 41.028000'
ans =
'HCCOH species molecular_mass 42.035000'
ans =
'H2CN species molecular_mass 28.032000'
ans =
'HCN species molecular_mass 27.025000'
ans =
'HNO species molecular_mass 31.013000'
ans =
'N species molecular_mass 14.007000'
ans =
'NNH species molecular_mass 29.021000'
ans =
'N2O species molecular_mass 44.013000'
ans =
'NH species molecular_mass 15.014000'
ans =
'NH2 species molecular_mass 16.021000'
ans =
'NH3 species molecular_mass 17.028000'
ans =
'NO species molecular_mass 30.006000'
ans =
'NO2 species molecular_mass 46.005000'
ans =
'HCNO species molecular_mass 43.024000'
ans =
'HOCN species molecular_mass 43.024000'
ans =
'HNCO species molecular_mass 43.024000'
ans =
'NCO species molecular_mass 42.017000'
ans =
'CN species molecular_mass 26.018000'
ans =
'HCNN species molecular_mass 41.032000'
ans =
'N2 species molecular_mass 28.014000'
ans =
'AR species molecular_mass 13.948000'
ans =
'C3H8 species molecular_mass 44.089000'
ans =
'C3H7 species molecular_mass 43.082000'
ans =
'CH3CHO species molecular_mass 44.049000'
ans =
'CH2CHO species molecular_mass 43.042000'
CONCLUSION :
Therefore, we have successfully parsed the given NAS thermodynamics data file and plotted the graphs of specific heat, ethalphy, entrophy for the respective inputted species name.