Project 1 - Parsing NASA thermodynamic data
AIM: To read and calculate specific heat, enthalpy and entropy for all the species from the given NASA thermodynamic data file.
OBJECTIVE:
- To write a function that extracts the 14 co-efficients and calculates the enthalpy, entropy and specific heat
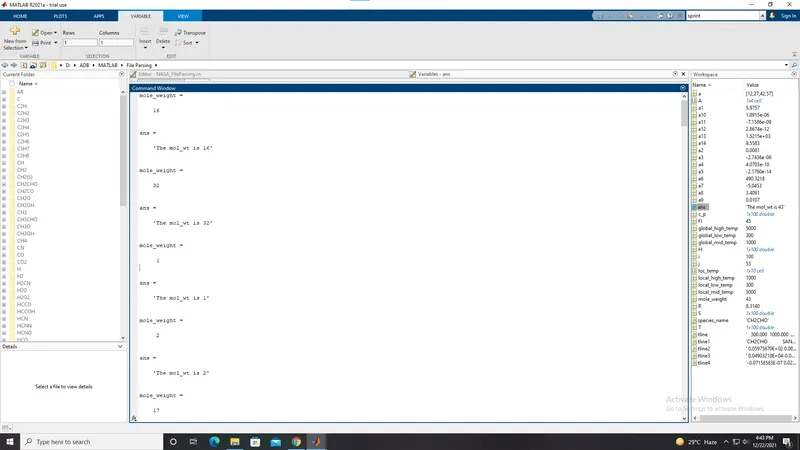
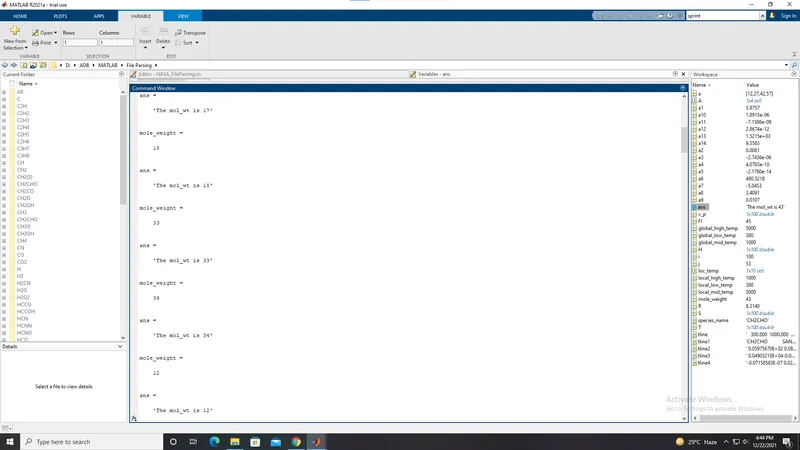
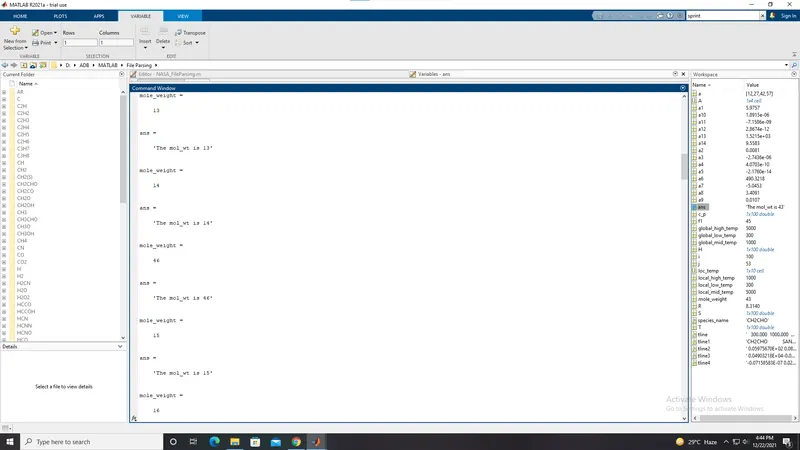
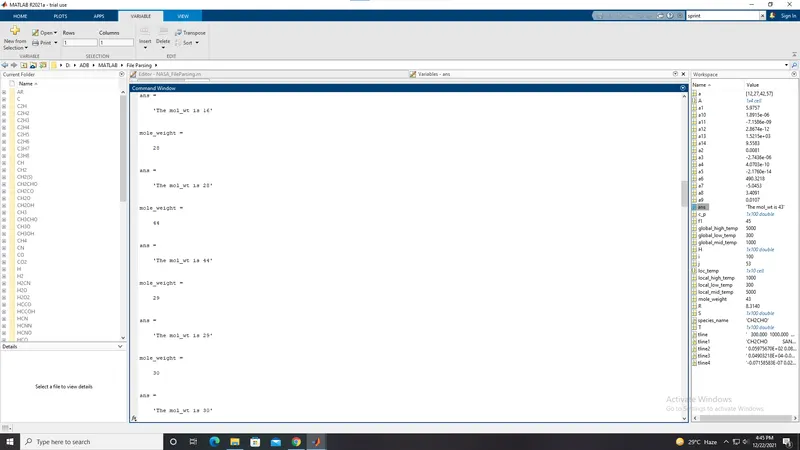
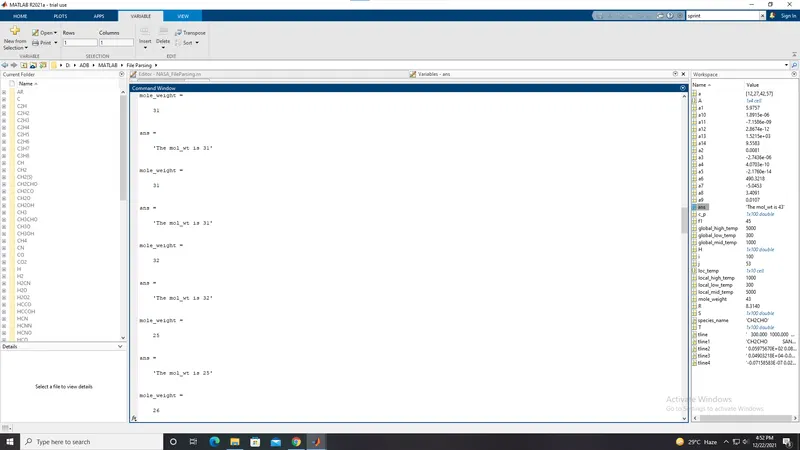
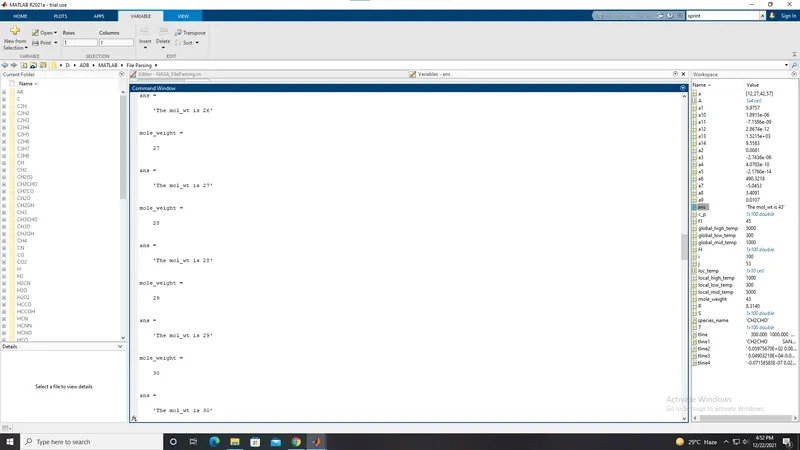
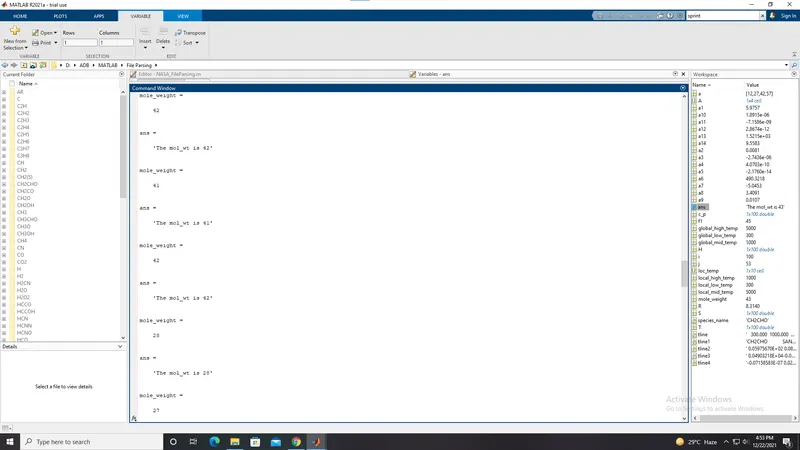
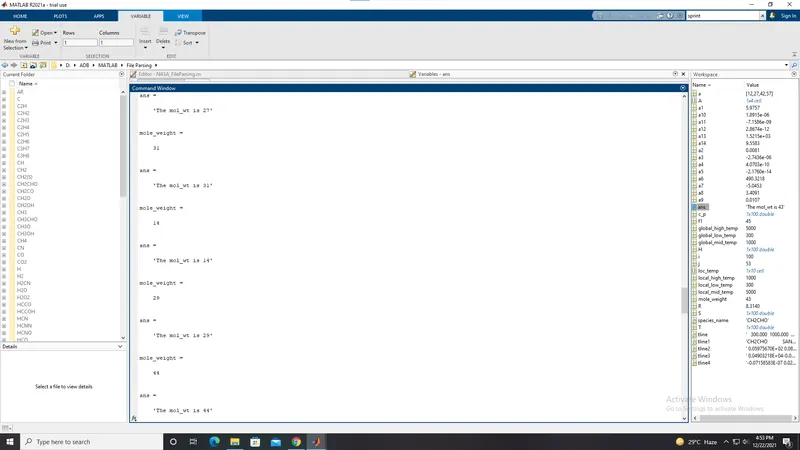
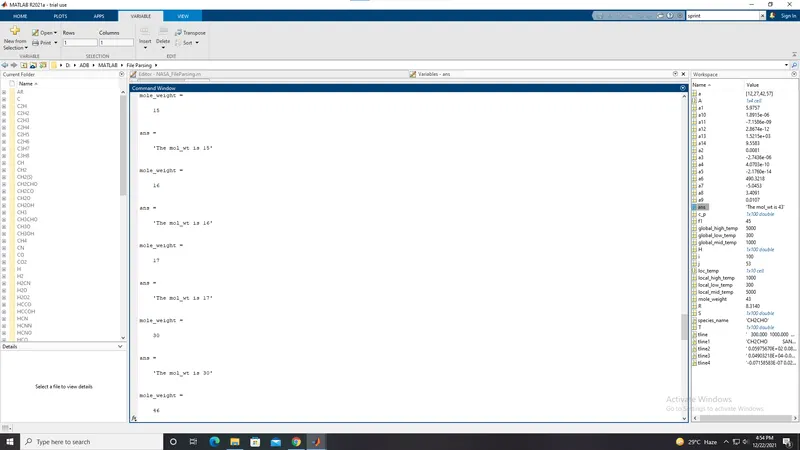
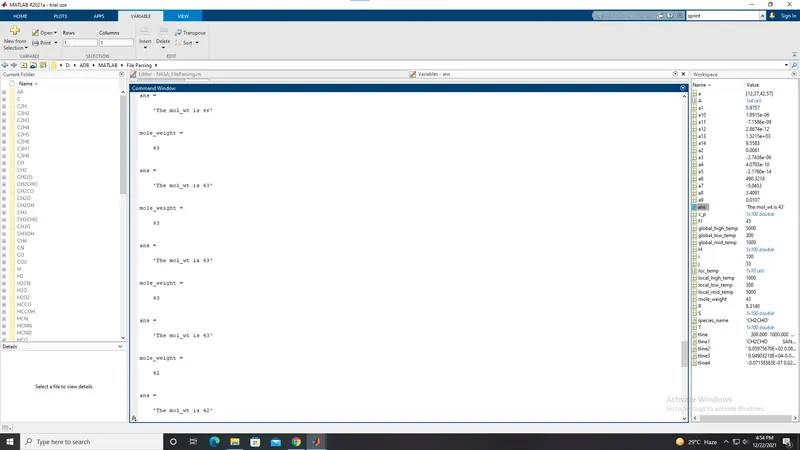
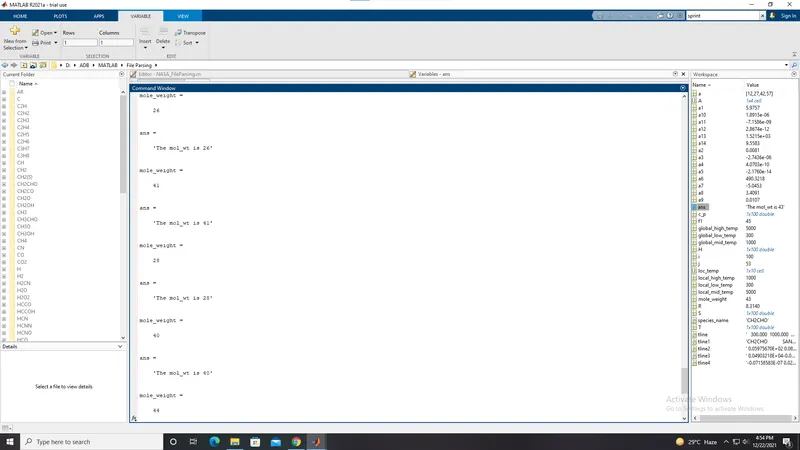
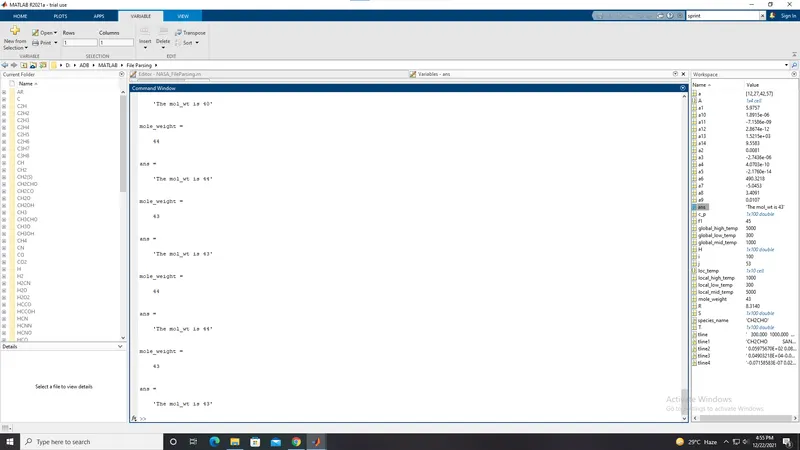
- To calculate the molecular weight of each species and display it in the command window
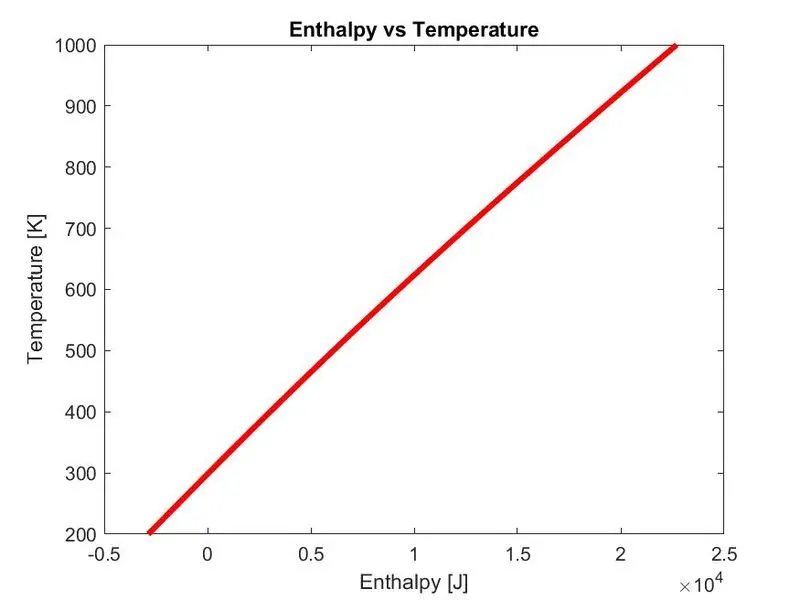
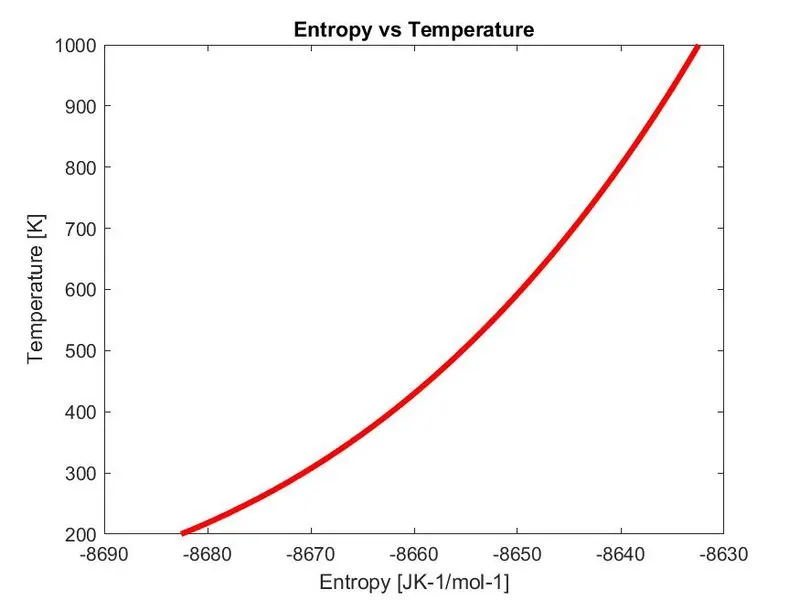
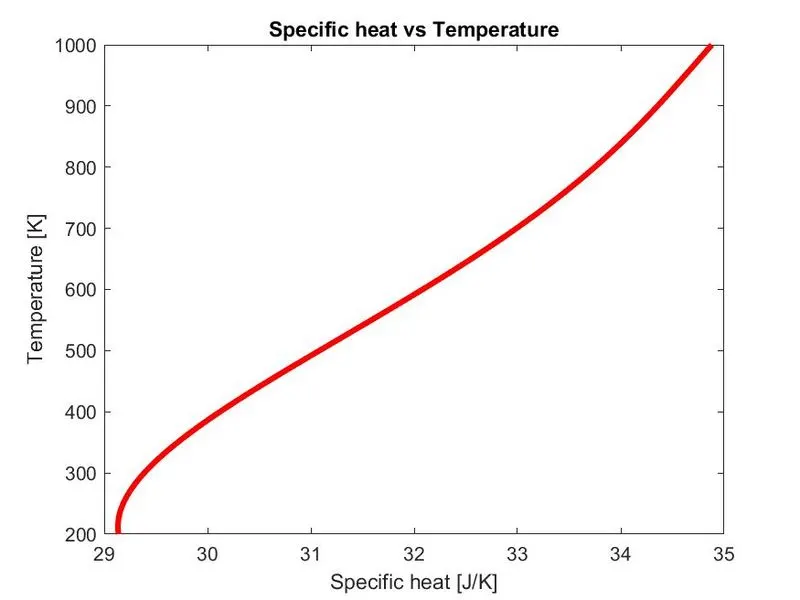
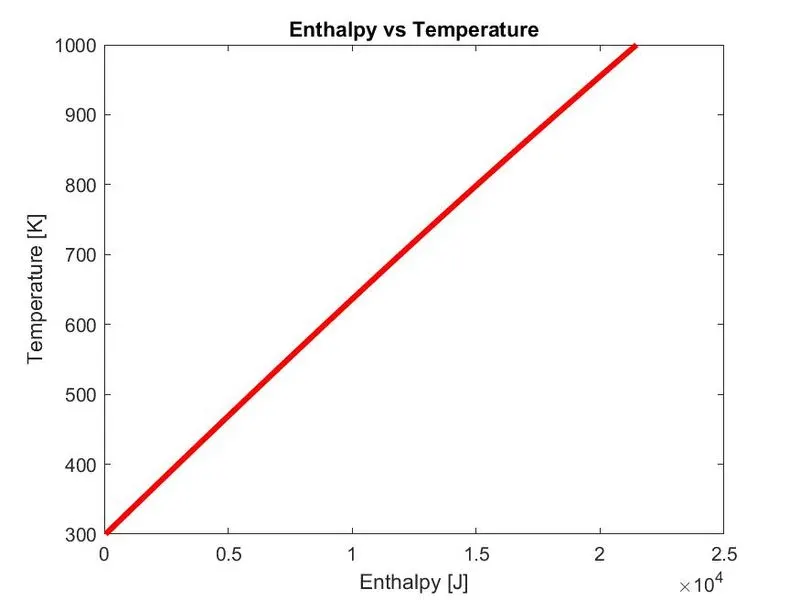
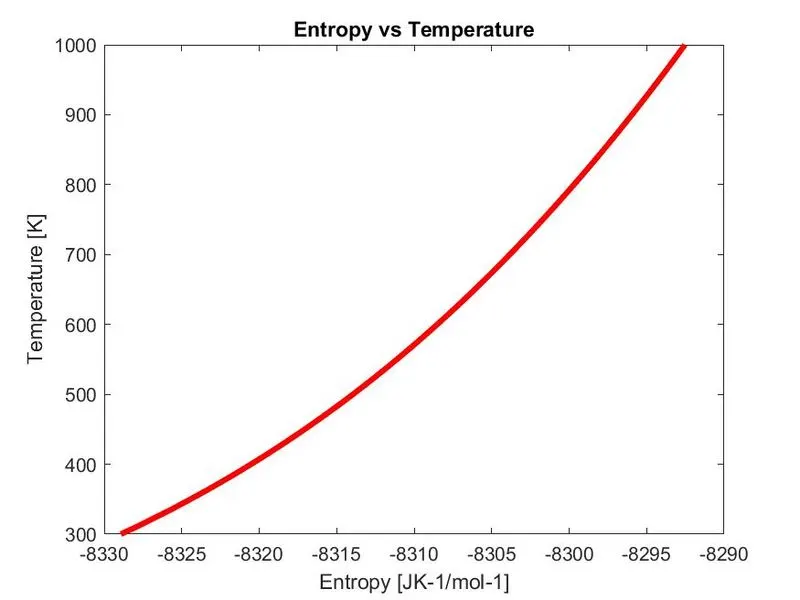
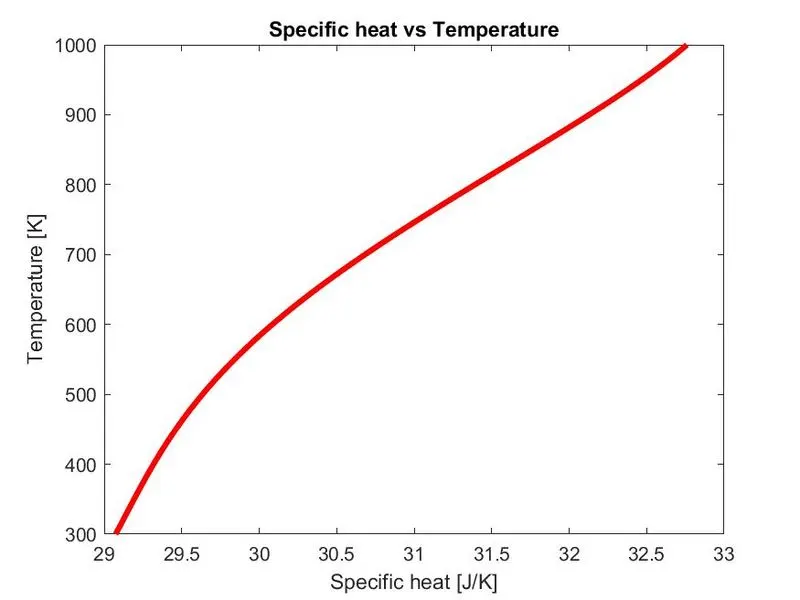
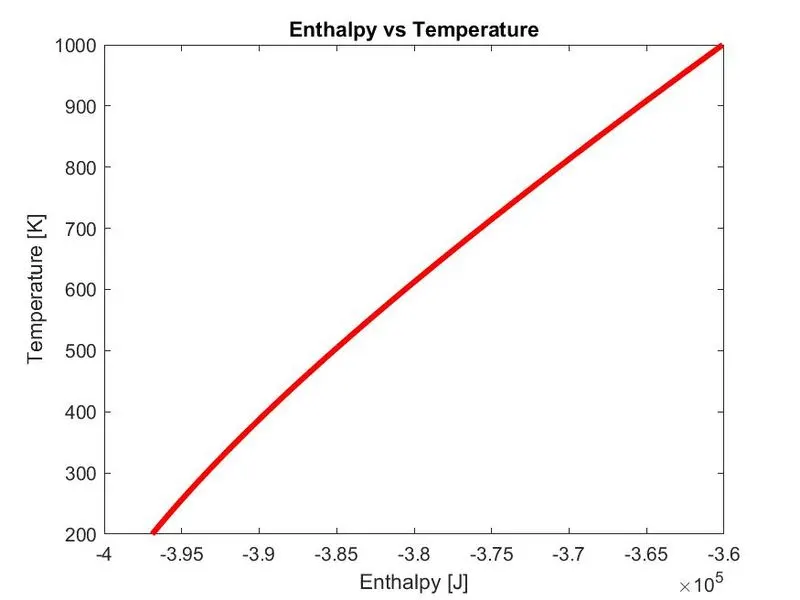
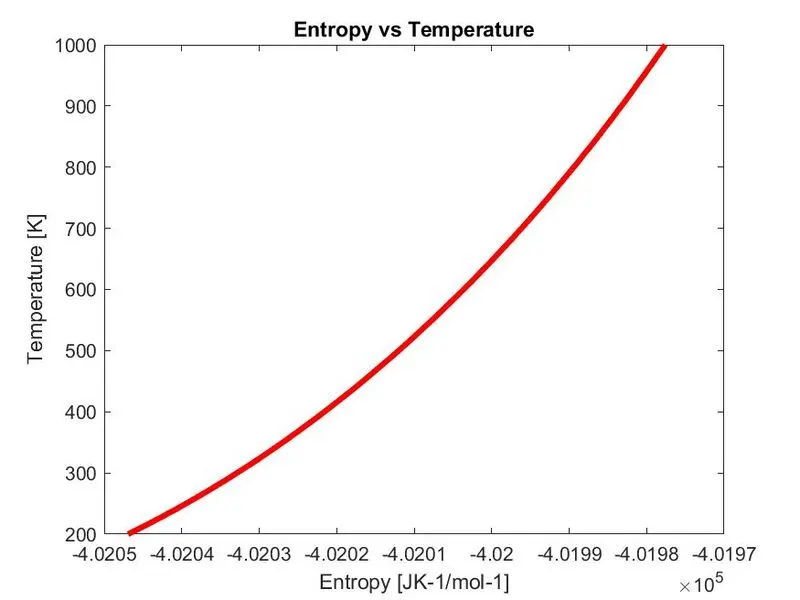
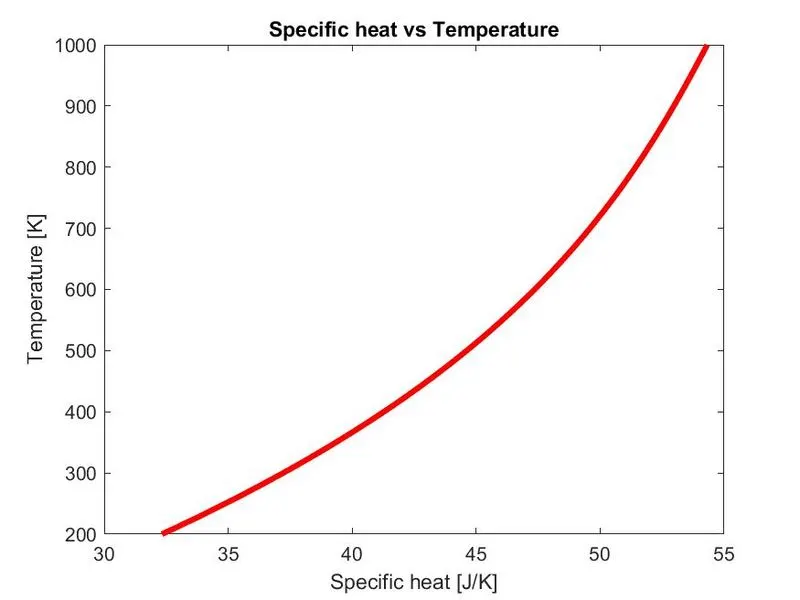
- To plot the cp, Enthalpy and Entropy for the local temperature range for each species
- Plots for o2, N2 and Co2 species should be attached separately
File Parsing:
File Parsing basically refers to how information can be read from a text file or data file or anytype of file and how that info can be used in a computer program.
File writing:
File writing is a process of writing data to a particular file.
File reading:
File reading is the opposite of file writing. It is used to read a file that already exists.
Formulae:
`cp = (a1+a2T+a3T^2+a4T^3+a5T^4)R`
`H = (a1+a2T/2+a3T^2/3+a4T^3/4+a5T^4/5+a6/T)RT`
`S = (a1lnT+a2T+a3T^2/2+a4T^3/3+a5T^4/4+a7)R`
Here R is the universal gas constant, T is the temeprature
Program Code:
clear all
close all
clc

%Header
%Finding global temperatures
f1 = fopen('THERMO DATA.dat','r');
fgetl(f1);
tline = fgetl(f1);
A = strsplit(tline, ' ');
global_low_temp= str2num(A{2});
global_mid_temp= str2num(A{3});
global_high_temp= str2num(A{4});

%Reading all data
fgetl(f1);
fgetl(f1);
fgetl(f1);

for j=1:53;
tline1=fgetl(f1);
tline2=fgetl(f1);
tline3=fgetl(f1);
tline4=fgetl(f1);
%Finding local temperature of mono atomic oxygen data
loc_temp=strsplit(tline1,' ');
species_name=loc_temp{1};
local_low_temp=str2num(loc_temp{end-3});
local_mid_temp=str2num(loc_temp{end-2});
local_high_temp=str2num(loc_temp{end-1});


%finding strings Line 2

a = findstr(tline2, 'E');

a1 = tline2(1:a(1)+3);
a1 = str2num(a1);

a2 = tline2(a(1)+4:a(2)+3);
a2 = str2num(a2);

a3 = tline2(a(2)+4:a(3)+3);
a3 = str2num(a3);

a4 = tline2(a(3)+4:a(4)+3);
a4 = str2num(a4);

a5 = tline2(a(4)+4:a(5)+3);
a5 = str2num(a5);

%Line 3
a = findstr(tline3, 'E');

a6 = tline3(1:a(1)+3);
a6 = str2num(a6);

a7 = tline3(a(1)+4:a(2)+3);
a7 = str2num(a7);

a8 = tline3(a(2)+4:a(3)+3);
a8 = str2num(a8);

a9 = tline3(a(3)+4:a(4)+3);
a9 = str2num(a9);

a10 = tline3(a(4)+4:a(5)+3);
a10 = str2num(a10);

%Line4
a = findstr(tline4, 'E');

a11 = tline4(1:a(1)+3);
a11 = str2num(a11);

a12 = tline4(a(1)+4:a(2)+3);
a12 = str2num(a12);


a13 = tline4(a(2)+4:a(3)+3);
a13 = str2num(a13);


a14 = tline4(a(3)+4:a(4)+3);
a14 = str2num(a14);
R=8.314;
T=linspace(local_low_temp,local_high_temp,100);
%Calculating polynomial
%specific heat (c_p)/Universal gas constant (R)
%c_p = (a1+a2*T+a3*T^2+a4*T^3+a5*T^4)*R
%Enthalpy H/RT
%H = (a1+a2*T/2+a3*T^2/3+a4*T^3/4+a5*T^4/5+a6/T)*R*T
%Entropy S/R
%S = a1*ln*T+a2*T+a3*T^2/2+a4*T^3/3+a5*T^4/4+a7*R

for i=1:length(T);
    if T(i)>local_mid_temp;
        c_p(i) = (a1+a2*T(i)+a3*T(i)^2+a4*T(i)^3+a5*T(i)^4)*R;
        H(i) = (a1+a2*T(i)/2+a3*T(i)^2/3+a4*T(i)^3/4+a5*T(i)^4/5+a6/T(i))*R*T(i);
        S(i) = (a1*log(T(i))+a2*T(i)+a3*T(i)^2/2+a4*T(i)^3/3+a5*T(i)^4/4+a7)*R;


    else
        c_p(i) = (a8+a9*T(i)+a10*T(i)^2+a11*T(i)^3+a12*T(i)^4)*R;
        H(i) = (a8+a9*T(i)/2+a10*T(i)^2/3+a11*T(i)^3/4+a12*T(i)^4/5+a13/T(i))*R*T(i);
        S(i) = (a8*log(T(i))+a9*T(i)+a10*T(i)^2/2+a11*T(i)^3/3+a12*T(i)^4/4+a13)*R;
    end
end
mole_weight = mol_weight(species_name)

%Plotting
%Make directory
mkdir(species_name);
cd(species_name);

figure(1)
plot(c_p, T, 'linewidth', 3, 'color', 'r')
title('Specific heat vs Temperature')
xlabel('Specific heat [J/K]')
ylabel('Temperature [K]')
saveas(1, 'Specific heat.jpeg')

figure(2)
plot(H, T, 'linewidth', 3, 'color', 'r')
title('Enthalpy vs Temperature')
xlabel('Enthalpy [J]')
ylabel('Temperature [K]')
saveas(2, 'Enthalpy.jpeg')

figure(3)
plot(S, T, 'linewidth', 3, 'color', 'r')
title('Entropy vs Temperature')
xlabel('Entropy [JK-1/mol-1]')
ylabel('Temperature [K]')
saveas(3, 'Entropy.jpeg')
cd ..
sprintf('The mol_wt is %d', mole_weight)

end
Function Program:
function mm = mol_weight(species_name);
atoms = ['H', 'C', 'N', 'O', 'A', 'S'];
atomic_weight=[1, 12, 14, 16, 40, 32];
mm = 0;
for i = 1:length(species_name);
    for j = 1:length(atoms);
        if strcmpi(species_name(i), atoms(j));
            mm = mm+atomic_weight(j);
            pos = j;
        end
        n = str2num(species_name(i));
    end
    if n>1;
        mm = mm+atomic_weight(pos)*(n-1);
    end
end
Step wise explanation:
Line 1 - 3: Clear all, close all and clc comand is used.
Line 5 - 13: Header info is read from the data and global temperatures are found using (fgetl) command and (str2num) command is used to convert string to numbers.
Line 15 - 24: fgetl command is used to skip the comments in the data to read all the species.
Line 25 - 30: Local temperature is found and the stings are converted to numbers.
Line 35 - 108: Coefficients is extracted from the data and coefficients strings are converted to numbers. universal gas constant(R) is defined and formulae is used to calculate the equation.
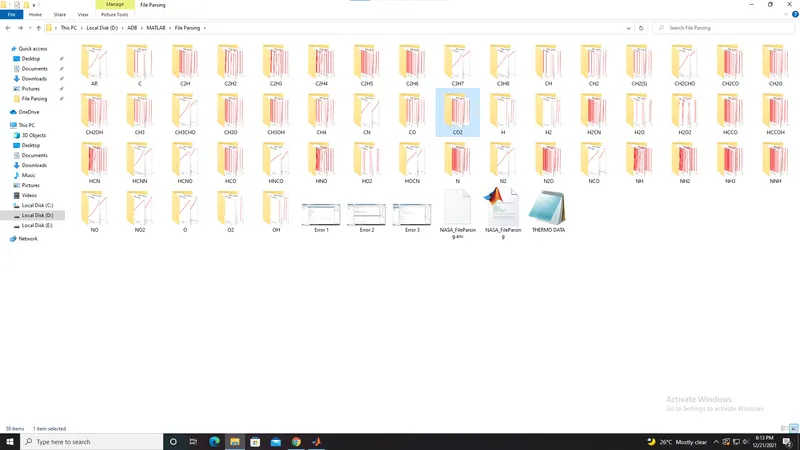
Line 113 - 114: Make directory (mkdir) and change current folder(cd) is used to create a seperate a folder for the program and outputs to make them show automatically when compiled.
Line 116 - 136: Plots are plotted for (cp vs T, H vs T, S vs T) and saveas function is used to save the figures seperately as jpeg or png.
Line 137: sprintf is used to print the molecular weight in the command window which was called via a function program.
Errors faced:
Error 1:
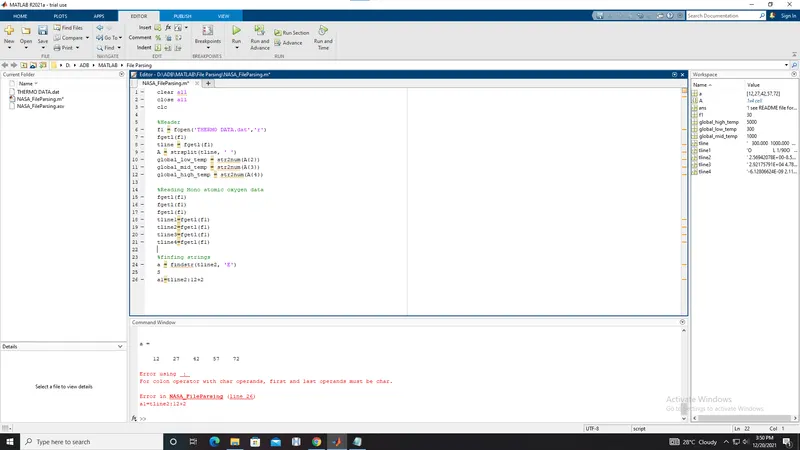
Parentheses was not used and it was rectified.
Error 2:
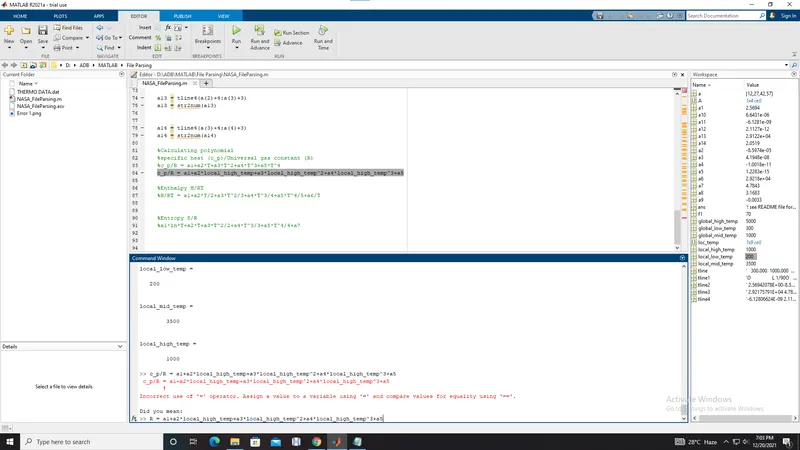
MATLAB said incorrect use of equal to operator which is because MATLAB dosent support divison or any other math function before eual to so it is rectfied by moving the denominator into multiplication.
Error 3:
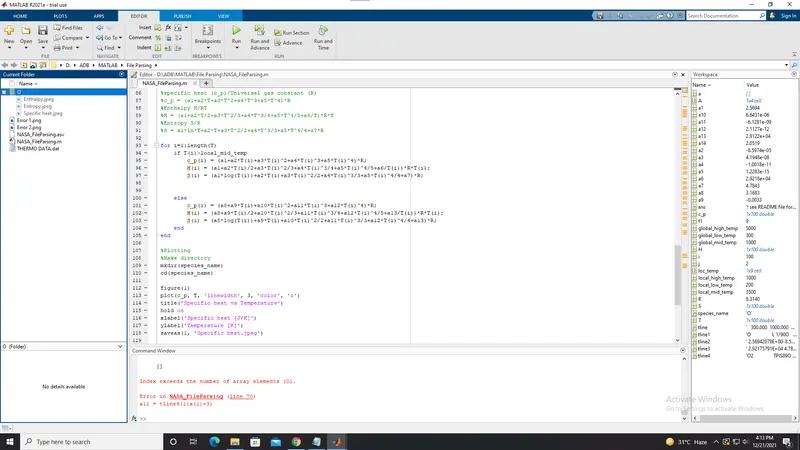
a11 was not prestent inside for loop then it was rectfied.
Error 4:
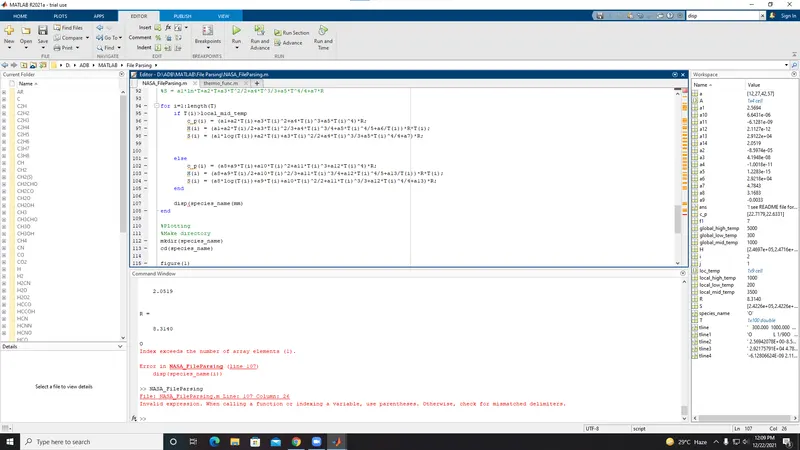
disp function was used to display molecular weight but the syntax was wrong then it was rectified and the also MATLAB didn't support the disp function for this program so sprintf was used.
Error 5:
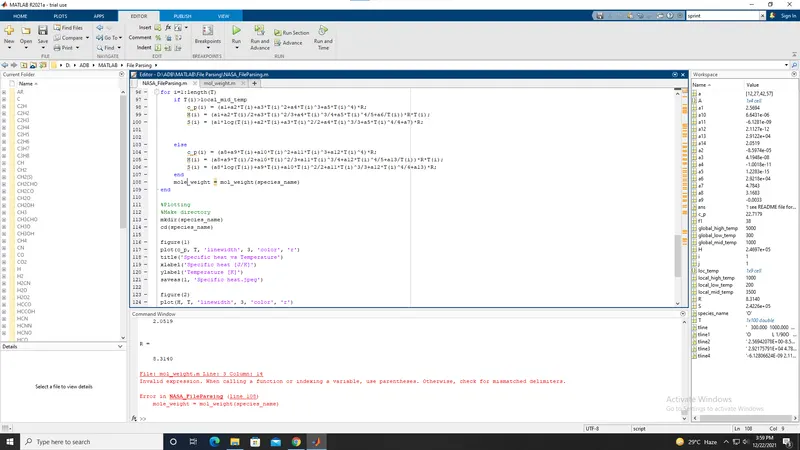
When calling a function there was a mistake in the function name then it was rectified.
Outputs of molecular weight:
Folder window:
Plots for species:
O2
N2
Co2
CONCLSION:
Using MATLAB the required data is read and extracted from the given NASA thermodynamic data file and programed to plot enthalpy, entropy and specific heat for all the species. Molecular weight is calculated for all the species.