Project 1 - Parsing NASA thermodynamic data
Aim
To write a program to phrase the NASA Thermodynamic data and to calculate the Entropy, Enthalpy & Specific Heat w.r.t. Local min & Max Temperature to plot a graph against it
Objectives
1) To write a function to take down the 7 coefficient for max temperatures & 7 co-effecients for min temperatures.
2) To take Local max, min & average temperature and to calculate the Entropy, Enthalpy & Specific Heat w.r.t. it.
3) To formulate a loop for every species to calculate the same.
4) To calculate a Molecular mass of the each & every species & display it in command window.
Explainations
1) Enthalpy
Enthalpy is a property of a thermodynamic system, is the sum of the system's internal energy and the product of its pressure and volume. The enthalpy of an ideal gas is independent of its pressure or volume, and depends only on its temperature, which correlates to its thermal energy.
2) Entropy
Entropy is a state of disorder, randomness, or uncertainty of a system. The term 'molecular disorder' explains it well
3) Specific Heat
Specific Heat is the amount of heat that must be added to one unit of mass of the substance in order to cause an increase of one unit in temperature.
Formula for all the three are as follows,

Where,
a1,a2,a3,a4,a5,a6,a7 are the coefficients mentioned in 'Thermo.dat' file. In which first 7 are High temp coefficients & last 7 are Low temp coefficients
T is the local Temperature
R is the Universal gas Constant and value is 8.314 kg⋅m2⋅s−2⋅K−1⋅mol−1
Coding
In coding we will examine the code segment by segment.
Segment 1
In this segment the Thermo.dat file was opened with read permission. Then the individual parameters like Global Maximum Temperature, Minimum temperature & Medium Temperature was taken out by string split (strsplt) command. Then the unnecessary lines were skipped
clear all
close all
clc

file=fopen('THERMO.dat','r');
heading=fgetl(file);
global_temperature_range=fgetl(file);

%Splitting the String
global_temperature_range=strsplit(global_temperature_range,' ');

%Global Temperature
global_temperature_range_low=str2double(global_temperature_range{2});
global_temperature_range_medium=str2double(global_temperature_range{3});
global_temperature_range_max=str2double(global_temperature_range{4});

%skipping the 3 lines
for k=1:3
    dummy=fgetl(file);
end
Segment 2
Extracting the Value of Local Temperatures, 14 coefficients & Name of the specimen, Here we had used str2double to convert the String Value to Numerical value.
strsplit command is used to split the strings of the line with the parameter next to it.
fgetl command here is used to move on to the next line.
findstr command is used to find the particular string value in the line
dummy=fgetl(file);
specimen_1_full=strsplit(dummy,' ');  %Splitting the String
specimen_1=specimen_1_full{1};      %indexing the first cell of the matrix

dummy=fgetl(file); %skipping the line
name_chk=strsplit(dummy,' ');

% specimen_1=name_chk{1}
Specimen_1_low_temp=str2double(specimen_1_full{end-3});
Specimen_1_mid_temp=str2double(specimen_1_full{end-1});
Specimen_1_max_temp=str2double(specimen_1_full{end-2});

%line 1
line_1=findstr(dummy,'E');
a1=str2double(dummy(1:line_1(1)+3));
a2=str2double(dummy(line_1(1)+4:line_1(2)+3));
a3=str2double(dummy(line_1(2)+4:line_1(3)+3));
a4=str2double(dummy(line_1(3)+4:line_1(4)+3));
a5=str2double(dummy(line_1(4)+4:line_1(5)+3));

%Line 2
dummy=fgetl(file);
line_2=findstr(dummy,'E');
a6=str2double(dummy(1:line_1(1)+3));
a7=str2double(dummy(line_1(1)+4:line_1(2)+3));
a8=str2double(dummy(line_1(2)+4:line_1(3)+3));
a9=str2double(dummy(line_1(3)+4:line_1(4)+3));
a10=str2double(dummy(line_1(4)+4:line_1(5)+3));

%Line 3
dummy=fgetl(file);
line_3=findstr(dummy,'E');
a11=str2double(dummy(1:line_1(1)+3));
a12=str2double(dummy(line_1(1)+4:line_1(2)+3));
a13=str2double(dummy(line_1(2)+4:line_1(3)+3));
a14=str2double(dummy(line_1(3)+4:line_1(4)+3));
Segment 3
Segment 3 of the coding here is to calculate the Molar Mass of the all 53 specimen. Where the for loop runs for the Number of specimens & the nested for loop will runs for the length of atomic weight.
'if' statement was called out to compare the Specimen name vs Elements & then the molecular mass was calculated.
elements=['H','C','O','N','A'];
atomic_weight=[1.0079 12.0107 15.999 14.0067 39.948];
mol_mass=0;
for l=1:length(specimen_1)
    for m=1:length(atomic_weight)
        if strcmp(specimen_1(l),elements(m))
            mol_mass=mol_mass+atomic_weight(m);
            position=m;
        end
    end

n=str2double(specimen_1(l));
if n>1
    mol_mass=mol_mass+atomic_weight(position)*(n-1);

end
end
sprintf('Molecular Weight of %s:%f u',specimen_1,mol_mass)
Segment 4
In segment 4 the temperature between Local Max & Local Min was stored and called out in all the three formulas, But the Coeffecients were selected by setting the value of heat as the limit in 'if-else' condition.
t=linspace(Specimen_1_low_temp,Specimen_1_max_temp,500);
r=8.3145;
if (t>=Specimen_1_mid_temp)

    cp=r*(a1+(a2*t)+(a3*t.^2)+(a4*t.^3)+(a5*t.^4));
    h=r*t*(a1+(a2*t)/2+(a3*t.^2)/3+(a4*t.^3)/4+(a5*t.^4)/5+(a6./t));
    s=r*((a1*log(t))+(a2*t)+(a3*t.^2)/2+(a4*t.^3)/3+(a5*t.^4)/4+a7);
else

    cp=r*(a8+(a9*t)+(a10*t.^2)+(a11*t.^3)+(a12*t.^4));
    h=r.*t.*(a8+(a9*t)/2+(a10*t.^2)/3+(a11*t.^3)/4+(a12*t.^4)/5+(a13./t));
    s=r*((a8*log(t))+(a9*t)+(a10*t.^2)/2+(a11*t.^3)/3+(a12*t.^4)/4+a14);
Segment 5
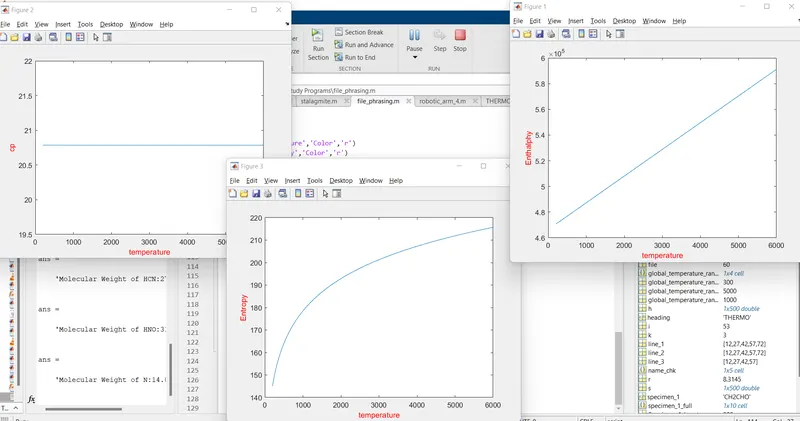
The segment 5 is the Plotting & directory creation section, where there were 3 figures created between Temperature vs Enthalpy, Temperature vs Entrophy & Temperature vs Specific Heat.
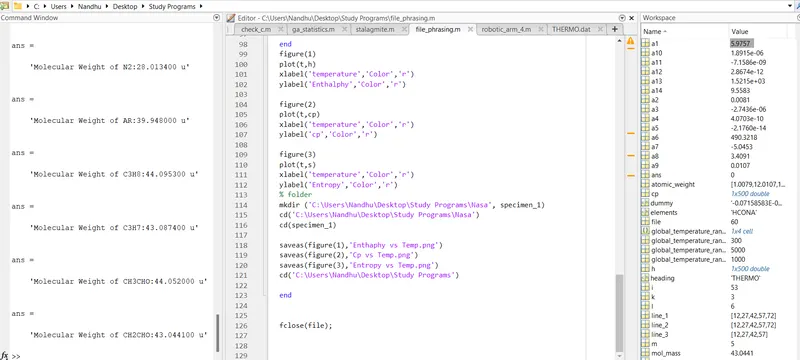
'mkdir' command is used to create a directory & 'cd' is used to change directory. 'save as' command is used to save the plot in the respective directory created
figure(1)
plot(t,h)
xlabel('temperature','Color','r')
ylabel('Enthalphy','Color','r')

figure(2)
plot(t,cp)
xlabel('temperature','Color','r')
ylabel('cp','Color','r')

figure(3)
plot(t,s)
xlabel('temperature','Color','r')
ylabel('Entropy','Color','r')
% folder
mkdir ('C:\Users\Nandhu\Desktop\Study Programs\Nasa', specimen_1)
cd('C:\Users\Nandhu\Desktop\Study Programs\Nasa')
cd(specimen_1)

saveas(figure(1),'Enthaphy vs Temp.png')
saveas(figure(2),'Cp vs Temp.png')
saveas(figure(3),'Entropy vs Temp.png')
cd('C:\Users\Nandhu\Desktop\Study Programs')
OVERALL CODE
clear all
close all
clc

file=fopen('THERMO.dat','r');
heading=fgetl(file);
global_temperature_range=fgetl(file);

%Splitting the String
global_temperature_range=strsplit(global_temperature_range,' ');

%Global Temperature
global_temperature_range_low=str2double(global_temperature_range{2});
global_temperature_range_medium=str2double(global_temperature_range{3});
global_temperature_range_max=str2double(global_temperature_range{4});

%skipping the 3 lines
for k=1:3
    dummy=fgetl(file);
end

for i=1:53
%reading
dummy=fgetl(file);
specimen_1_full=strsplit(dummy,' ');  %Splitting the String
specimen_1=specimen_1_full{1};      %indexing the first cell of the matrix

dummy=fgetl(file); %skipping the line
name_chk=strsplit(dummy,' ');

% specimen_1=name_chk{1}
Specimen_1_low_temp=str2double(specimen_1_full{end-3});
Specimen_1_mid_temp=str2double(specimen_1_full{end-1});
Specimen_1_max_temp=str2double(specimen_1_full{end-2});

%line 1
line_1=findstr(dummy,'E');
a1=str2double(dummy(1:line_1(1)+3));
a2=str2double(dummy(line_1(1)+4:line_1(2)+3));
a3=str2double(dummy(line_1(2)+4:line_1(3)+3));
a4=str2double(dummy(line_1(3)+4:line_1(4)+3));
a5=str2double(dummy(line_1(4)+4:line_1(5)+3));

%Line 2
dummy=fgetl(file);
line_2=findstr(dummy,'E');
a6=str2double(dummy(1:line_1(1)+3));
a7=str2double(dummy(line_1(1)+4:line_1(2)+3));
a8=str2double(dummy(line_1(2)+4:line_1(3)+3));
a9=str2double(dummy(line_1(3)+4:line_1(4)+3));
a10=str2double(dummy(line_1(4)+4:line_1(5)+3));

%Line 3
dummy=fgetl(file);
line_3=findstr(dummy,'E');
a11=str2double(dummy(1:line_1(1)+3));
a12=str2double(dummy(line_1(1)+4:line_1(2)+3));
a13=str2double(dummy(line_1(2)+4:line_1(3)+3));
a14=str2double(dummy(line_1(3)+4:line_1(4)+3));


elements=['H','C','O','N','A'];
atomic_weight=[1.0079 12.0107 15.999 14.0067 39.948];
mol_mass=0;
for l=1:length(specimen_1)
    for m=1:length(atomic_weight)
        if strcmp(specimen_1(l),elements(m))
            mol_mass=mol_mass+atomic_weight(m);
            position=m;
        end
    end

n=str2double(specimen_1(l));
    if n>1
        mol_mass=mol_mass+atomic_weight(position)*(n-1);

    end
end
sprintf('Molecular Weight of %s:%f u',specimen_1,mol_mass)


t=linspace(Specimen_1_low_temp,Specimen_1_max_temp,500);
r=8.3145;
if (t>=Specimen_1_mid_temp)

    cp=r*(a1+(a2*t)+(a3*t.^2)+(a4*t.^3)+(a5*t.^4));
    h=r*t*(a1+(a2*t)/2+(a3*t.^2)/3+(a4*t.^3)/4+(a5*t.^4)/5+(a6./t));
    s=r*((a1*log(t))+(a2*t)+(a3*t.^2)/2+(a4*t.^3)/3+(a5*t.^4)/4+a7);
else

    cp=r*(a8+(a9*t)+(a10*t.^2)+(a11*t.^3)+(a12*t.^4));
    h=r.*t.*(a8+(a9*t)/2+(a10*t.^2)/3+(a11*t.^3)/4+(a12*t.^4)/5+(a13./t));
    s=r*((a8*log(t))+(a9*t)+(a10*t.^2)/2+(a11*t.^3)/3+(a12*t.^4)/4+a14);


end
figure(1)
plot(t,h)
xlabel('temperature','Color','r')
ylabel('Enthalphy','Color','r')

figure(2)
plot(t,cp)
xlabel('temperature','Color','r')
ylabel('cp','Color','r')

figure(3)
plot(t,s)
xlabel('temperature','Color','r')
ylabel('Entropy','Color','r')
% folder
mkdir ('C:\Users\Nandhu\Desktop\Study Programs\Nasa', specimen_1)
cd('C:\Users\Nandhu\Desktop\Study Programs\Nasa')
cd(specimen_1)

saveas(figure(1),'Enthaphy vs Temp.png')
saveas(figure(2),'Cp vs Temp.png')
saveas(figure(3),'Entropy vs Temp.png')
cd('C:\Users\Nandhu\Desktop\Study Programs')

end

fclose(file);
OUTPUT
While running the code
After the code running succesfully
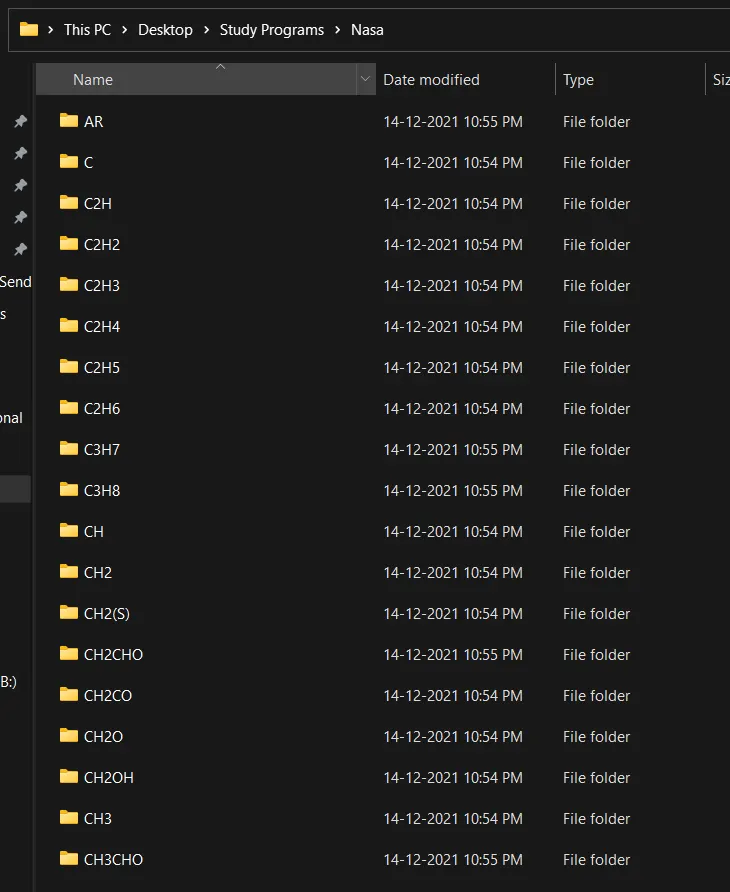
Screenshot of the location folders were saved
Concusion
Hence the output was stored in the seperated directory created & graphs plotted were saved.