Project 1 - Parsing NASA thermodynamic data
Aim : Parsing NASA thermodynamic data using MATLAB
Objective :
- Write a function to extracts the 14 coefficients from the data and to calculate Enthalpy, Entropy and Specific heats for all the species in the data file.
- Calculate the molecular weight of each species.
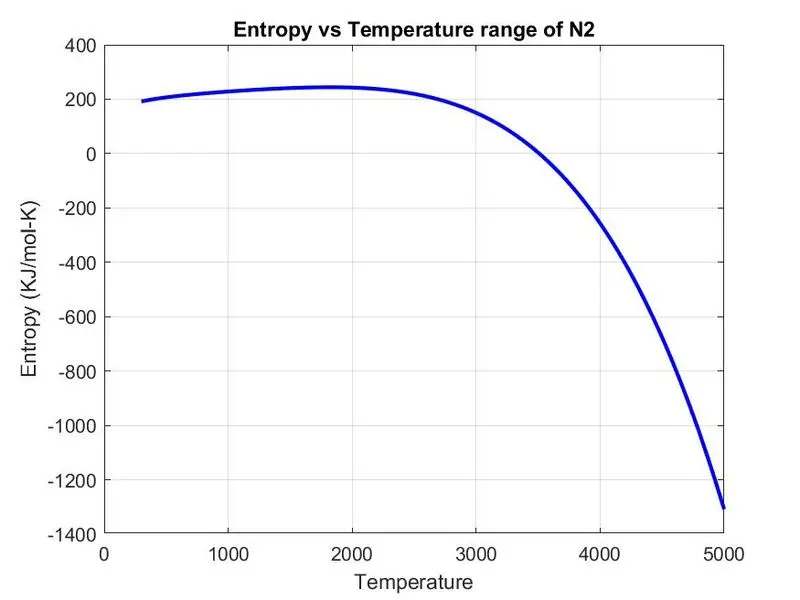
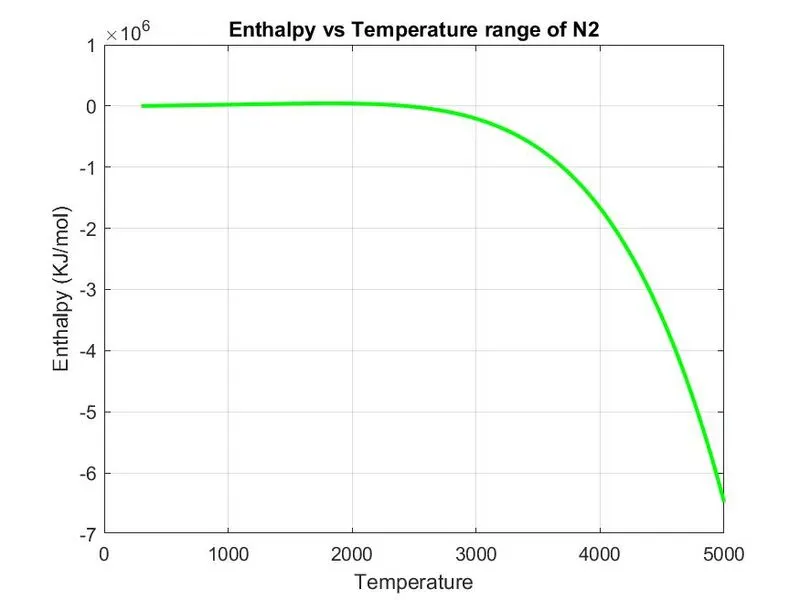
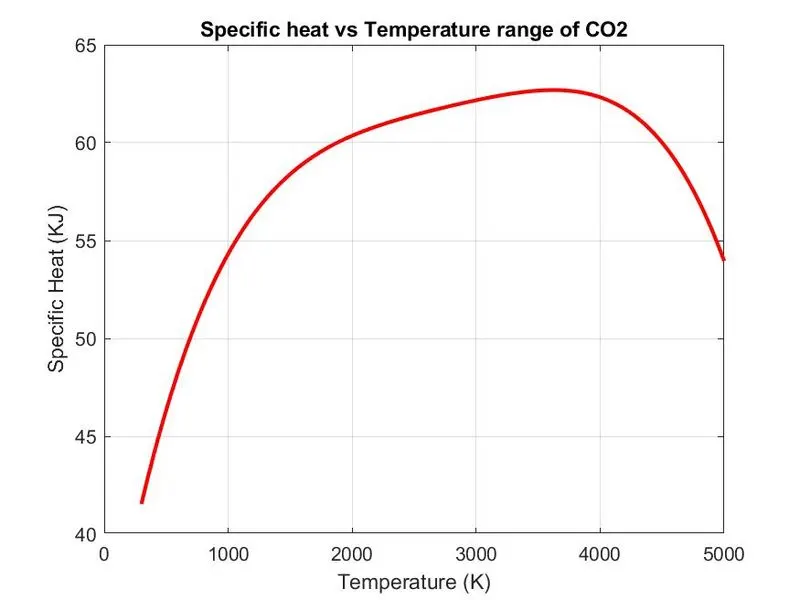
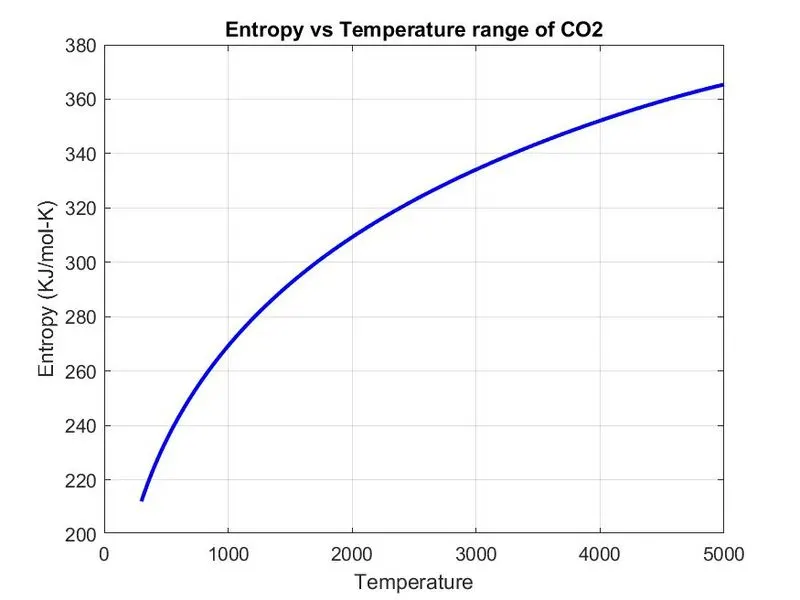
- Plot the Cp, Enthalpy and Entropy for the local temperature range.
- And create a folder and save the plots as an image file with appropriate names.
Theory :
File Parsing :
- The actual definition of "parse" is to split a file or another input into pieces of data that can easily be stored or manipulated.
- Where as in computer language it refers to syntactic analysis of the input code into its components parts in order to facilitate the writing of compilers and interpreters.
- And File Parsing means reading in a data stream of some sort and building an in memory model of the semantic content of that data. This aims at facilitating performing some kind of transformation on the data.
NASA Thermodynamic File :
It is the THERMO.dat file in which the temperature range and 53 species are mentioned in these data. Where each species contain 14 coefficients and temprature range. Ww have to parse these 14 coefficients to find the Specific heat, Entropy and Enthalpy using the formula:

where,
- R = Universal Gas Constant
- T = Temperature
- Cp = Specific heat (KJ)
- S = Entropy (KJ/mol-K)
- H = Enthalpy (KJ/mol)
- a(n) = Coefficients (where, n = 1 to 14)
Codes :
Main Code :
clear all
close all
clc

%Input
R = 8.314; % Gas Constant

%Reading the data file
%Open file and Reading the file

f1 = fopen('THERMO.dat','r');
get = fgetl(f1);

%Reading temperature from the data file
temperature = fgetl(f1);

%Splitting
s = strsplit(temperature);

%Converting string cells into numbers
low_temperature = str2double(s{2});
mid_temperature = str2double(s{3});
high_temperature = str2double(s{4});

%Temperature Range
T = linspace(low_temperature,high_temperature,1000);

%To skip the comment lines
for i = 1:3
    get = fgetl(f1);
end

%For reading the species
for j = 1:53
    tline = fgetl(f1);

    A = strsplit(tline,' ');
    species = (A{1});

    %Converting string to number
    low_temperature = str2double(A{end-3});
    mid_temperature = str2double(A{end-2});
    high_temperature = str2double(A{end-1});

    tline1 = fgetl(f1);
    a = strfind(tline1,'E'); %To find the sting E

    %Finding first 7 higher coefficients
    a1 = tline1(1:a(1)+3);
    a1 = str2double(a1);
    a2 = tline1(a(1)+4:a(2)+3);
    a2 = str2double(a2);
    a3 = tline1(a(2)+4:a(3)+3);
    a3 = str2double(a3);
    a4 = tline1(a(3)+4:a(4)+3);
    a4 = str2double(a4);
    a5 = tline1(a(4)+4:a(5)+3);
    a5 = str2double(a5);

    tline2 = fgetl(f1);
    b = strfind(tline2,'E');
    a6 = tline2(1:b(1)+3);
    a6 = str2double(a6);
    a7 = tline2(b(1)+4:b(2)+3);
    a7 = str2double(a7);

    %Finding second 7 lower coefficients
    a8 = tline2(b(2)+4:b(3)+3);
    a8 = str2double(a8);
    a9 = tline2(b(3)+4:b(4)+3);
    a9 = str2double(a9);
    a10 = tline2(b(4)+4:b(5)+3);
    a10 = str2double(a10);

    tline3 = fgetl(f1);
    c = strfind(tline3,'E');
    a11 = tline3(1:c(1)+3);
    a11 = str2double(a11);
    a12 = tline3(c(1)+4:c(2)+3);
    a12 = str2double(a12);
    a13 = tline3(c(2)+4:c(3)+3);
    a13 = str2double(a13);
    a14 = tline3(c(3)+4:c(4)+3);
    a14 = str2double(a14);

    %Calculating Specific heat
    Cp = Specific_heat(a1,a2,a3,a4,a5,a8,a9,a10,a11,a12,T,R,mid_temperature);

    %Calculating Entropy
    S = Entropy(a1,a2,a3,a4,a5,a7,a8,a9,a10,a11,a12,a14,T,R,mid_temperature);

    %Calculating Enthalpy
    H = Enthalpy(a1,a2,a3,a4,a5,a6,a8,a9,a10,a11,a12,a13,T,R,mid_temperature);

    %Calculating Molecular Weight
    W = Molecular_weight(species);

    %Writing molecular weight file
    MW_file = fopen('Molecular Weight.txt','w');
    fprintf(MW_file,'Molecular weight of %s is %d',species,W);
    fclose(MW_file); %To close the file

    %Plotting
    %Save in the folder
    cd('C:\Users\Hirendra Mehta\OneDrive\Documents\MATLAB\Parsing NASA Thermodynamic data')
    mkdir(species);
    cd(species);

    %Plot 1 (CP vs T)
    figure(1)
    plot(T,Cp,'linewidth',2,'color','r');
    xlabel('Temperature (K)');
    ylabel('Specific Heat (KJ)');
    title(sprintf('Specific heat vs Temperature range of %s',species));
    grid on
    saveas(figure(1),'Specific Heat.jpg');

    %Plot 2 (S vs T)
    figure(2)
    plot(T,S,'linewidth',2,'color','b');
    xlabel('Temperature');
    ylabel('Entropy (KJ/mol-K)');
    title(sprintf('Entropy vs Temperature range of %s',species));
    grid on
    saveas(figure(2),'Entropy.jpg');

    %Plot 3 (Cp vs T)
    figure(3)
    plot(T,H,'linewidth',2,'color','g');
    xlabel('Temperature');
    ylabel('Enthalpy (KJ/mol)');
    title(sprintf('Enthalpy vs Temperature range of %s',species));
    grid on
    saveas(figure(3),'Enthalpy.jpg');

    cd('C:\Users\Hirendra Mehta\OneDrive\Documents\MATLAB\Parsing NASA Thermodynamic data')

    %Molecular Weight
    W = Molecular_weight(species);
end
Function to find Specific Heat :
function Cp = Specific_heat(a1,a2,a3,a4,a5,a8,a9,a10,a11,a12,T,R,mid_temperature)
%Calculating Specific heat for higher and lower temperature respectively

if (T<=mid_temperature)
    Cp = R*(a8+(a9*T)+(a10*(T).^2)+(a11*(T).^3)+(a12*(T).^4));
else
    Cp = R*(a1+(a2*T)+(a3*(T).^2)+(a4*(T).^3)+(a5*(T).^4));
end
end
Function to find Entropy :
function S = Entropy(a1,a2,a3,a4,a5,a7,a8,a9,a10,a11,a12,a14,T,R,mid_temperature)
%Calculating Entropy for higher and lower temperature respectively

if (T<=mid_temperature)
    S = R*(a8.*log(T)+(a9*T)+((a10*(T).^2)/2)+((a11*(T).^3)/3)+((a12*(T).^4)/4)+a14);
else
    S = R*(a1.*log(T)+(a2*T)+((a3*(T).^2)/2)+((a4*(T).^3)/3)+((a5*(T).^4)/4)+a7);
end
end
Function to find Enthalpy :
function H = Enthalpy(a1,a2,a3,a4,a5,a6,a8,a9,a10,a11,a12,a13,T,R,mid_temperature)
%Calculating Enthalpy of higher and lower temeperature respectively

if (T<=mid_temperature)
    H = R*T.*(a8+((a9*T)/2)+((a10*(T).^2)/3)+((a11*(T).^3)/4)+((a12*(T).^4)/5)+((a13./T)));
else
    H = R*T.*(a1+((a2*T)/2)+((a3*(T).^2)/3)+((a4*(T).^3)/4)+((a5*(T).^4)/5)+((a6./T)));
end
end
Function to find Molecular Weight :
function W = Molecular_weight(species)

% Defining Atomic name of the species
atomic_name = ['H','C','O','N','Ar'];

% Defining Atomic masses of main species
atomic_weight = [1.008 12.011 15.999 14.007 39.948];

W=0; % Molecular weight starting range

for i=1:length(species)
    for j=1:length(atomic_name)
        if strcmp(species(i), atomic_name(j))
            W = W+atomic_weight(j);
            position = j;
        end
    end
    n = str2double(species); % If there is more element in the species then incrementing atomic weight of the species

    if n>1
        W= W+atomic_weight(position)*(n-1);
    end
end
fprintf('Molecular Weight of %s :- ',species);
fprintf('%f',W);
disp('')
end
Stepwise Explination of the code used :
- Firstly the main code is started off with the 'clear all', 'close all' and 'clc' commands which clear's the workspace, closes figures whose handles are not hidden and clears the command window respectively
- Then the input R is entered followed by the 'fopen' command to open the "THERMO.dat" file.
- Then we use the 'fgetl' command to read the first THERMO then we read the temperatures. followed by the 'strsplit' command to split the temperatures into low, mid and high.
- the string are then converted into number using the 'str2double' command to find the temperatures.
- Then we assign the tempratures using the 'linspace' command and run a loop to skip the command lines the data file using the 'fgetl' command inside the loop.
- We then read the new line. to read the coefficient in the data file we first find the 'E' string using 'strfind' command to find before and after numbers of the coefficients then we will find remaining 14 and convert them to numbers from strings.
- The first 7 are found which are for higher temperature then the second 7 which are for lower temperature.
- Now we will specify Specific heat Cp, Entropy S, and Enthalpy H functions to find these parameters and then specify molecular weight function to find the W of different species.
- Using the cd command now we can change the directory and then creating directory folder where we want to save the files using 'mkdir' command.
- Now, we will plot Specific heat, Entropy and Enthalpy with the temprature for different species.
- lastly by using the 'saveas' command we can save the plots of different species to the specified folder.
Final Results :
Plots :
O2 plots :
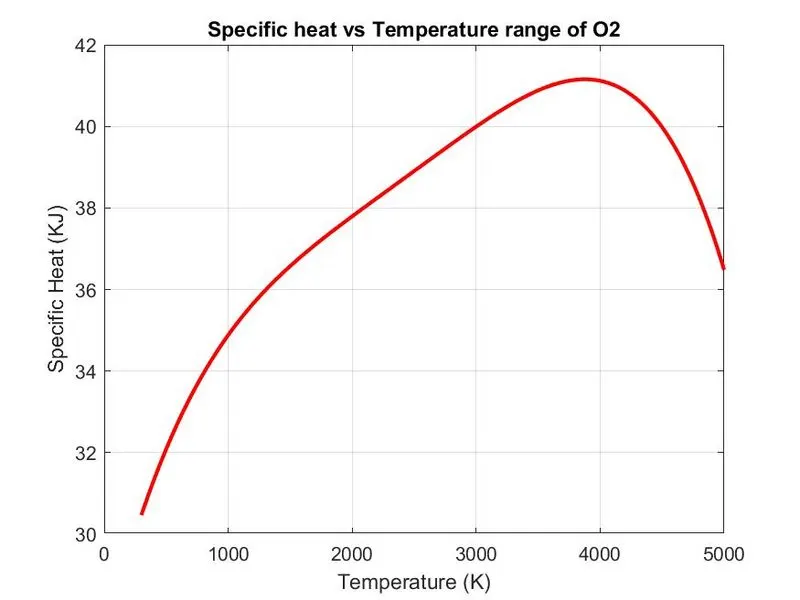
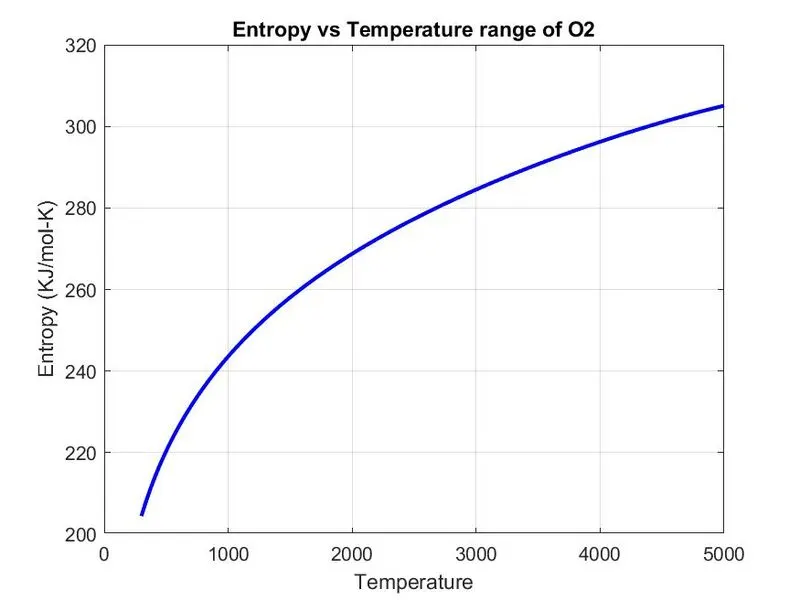
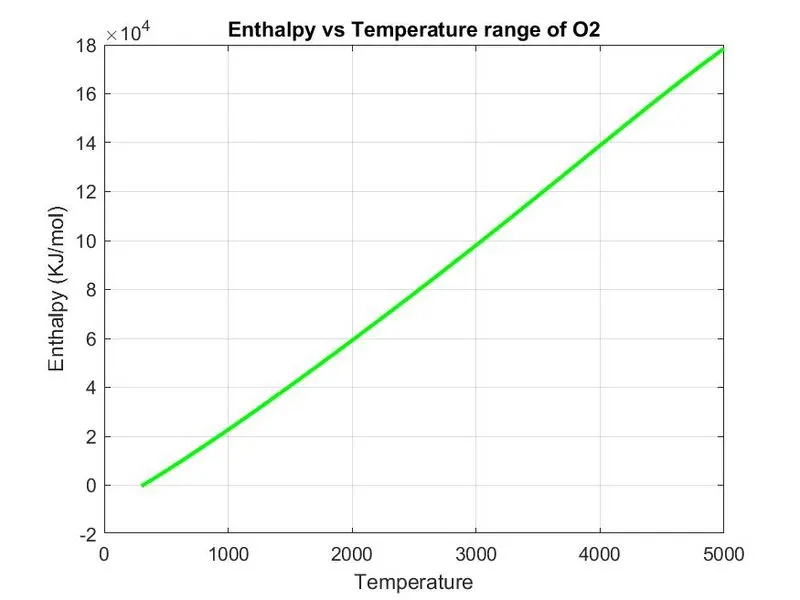
N2 Plots :
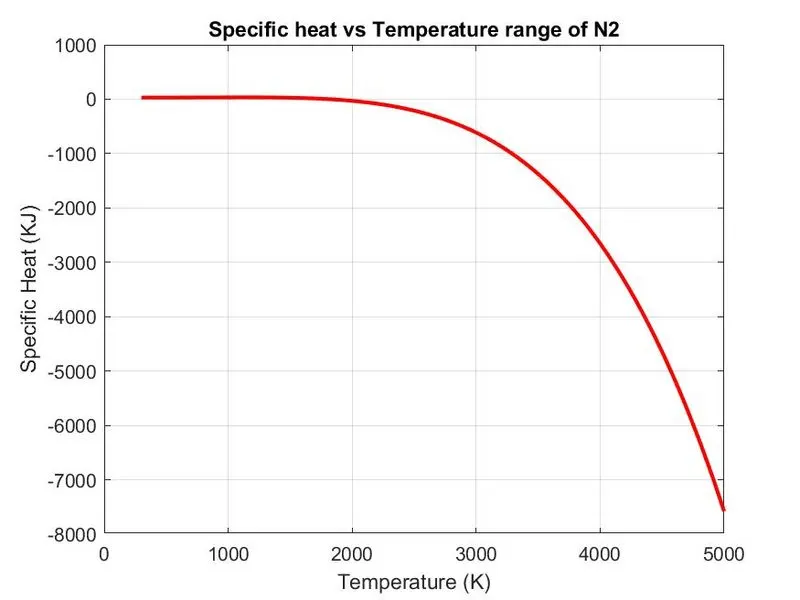
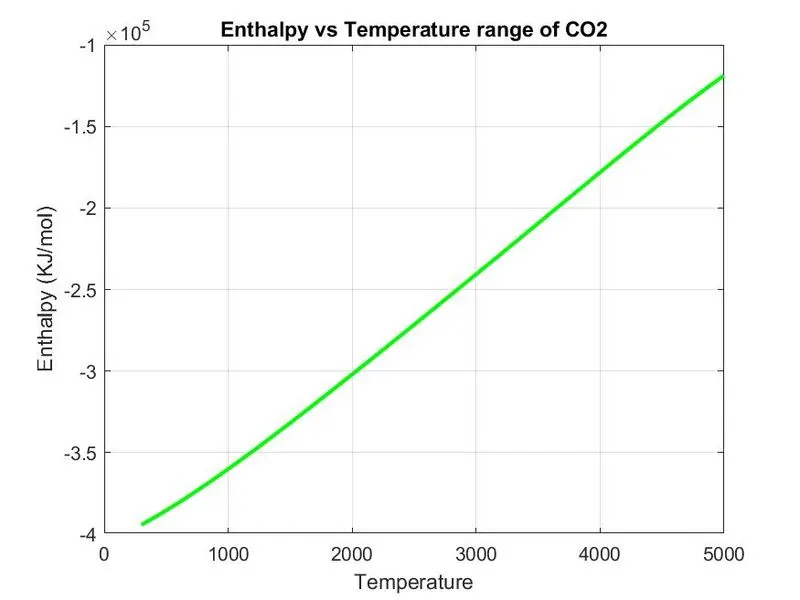
CO2 Plots :
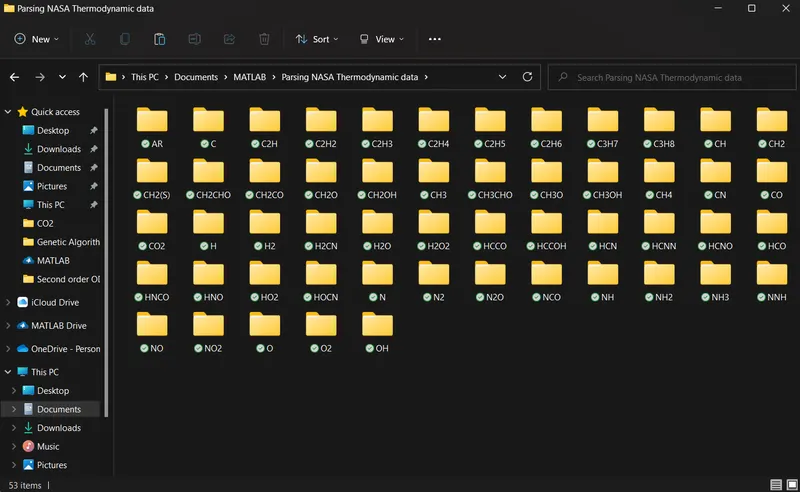
Screenshot of the directory where different species are saved :
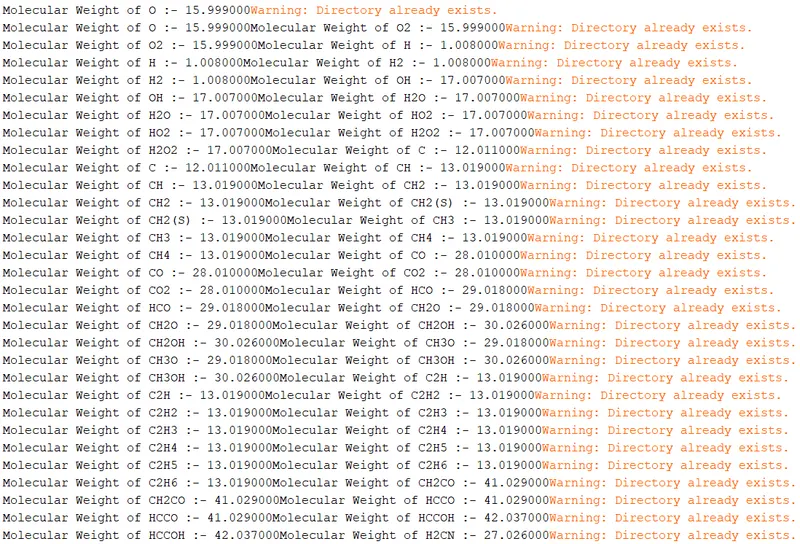
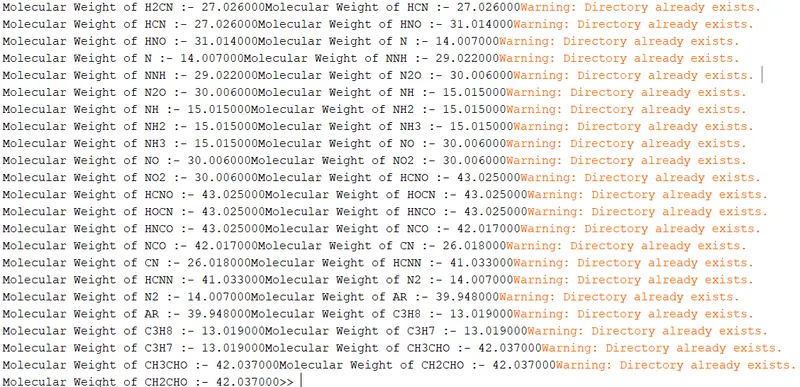
Molecular Weights of Species :
Google Drive Link for All the species :
https://drive.google.com/drive/folders/1XvOFMmXmK6iiRPTgZPwCWzjCSM8BPfQc?usp=sharing