Project 1 - Parsing NASA thermodynamic data
Aim:
To write a code in MATLAB to parse the NASA thermodynamic data file and to calculate thermodynamic properties of various gas species.
Governing equation :
Specific heat (`Cp`):
It is the ratio of the quantity of heat required to raise the temperature of a body by 1 degree to that required to raise the temperature of an equal mass of water by one degree.

Where, CP = Specific heat,
R = Universal gas constant.
Enthaply (`H`) :
Simply, Enthalpy is the sum of internal energy and product of pressure and volume. When a process occurs at constant pressure.

Where, H = Enthalpy,
R = Universal gas constant.
Entropy (`S`) :
It is the measure of a system’s thermal energy per unit temperature that is unavailable for doing useful work. Because work is obtained from ordered molecular motion, the amount of entropy is also a measure of the molecular disorder, (or) randomness, of a system.

Where, S = Entropy,
R = Universal gas constant.
Objective :
- To code a program to extract the 14 co-efficient from the THERMO data file for all the 53 species.
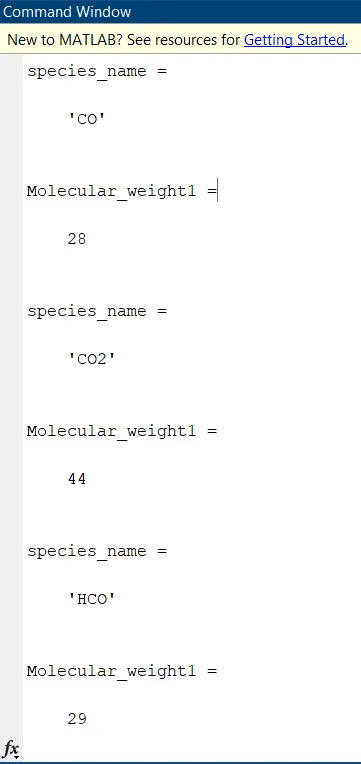
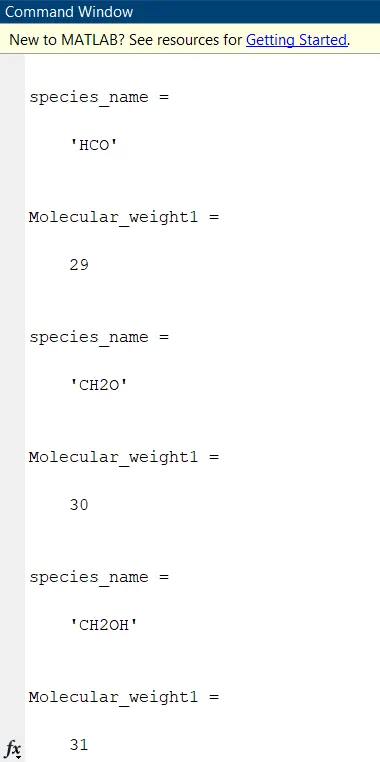
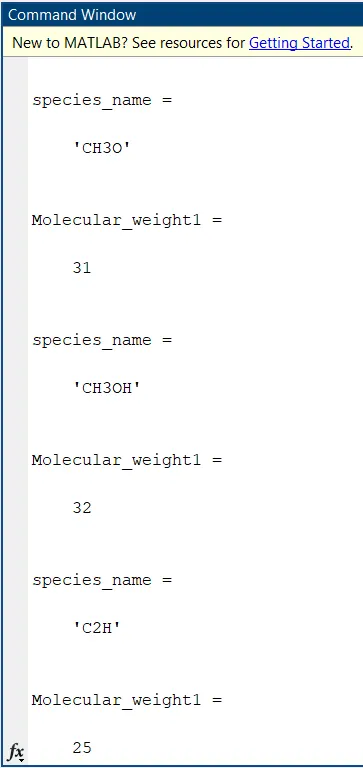
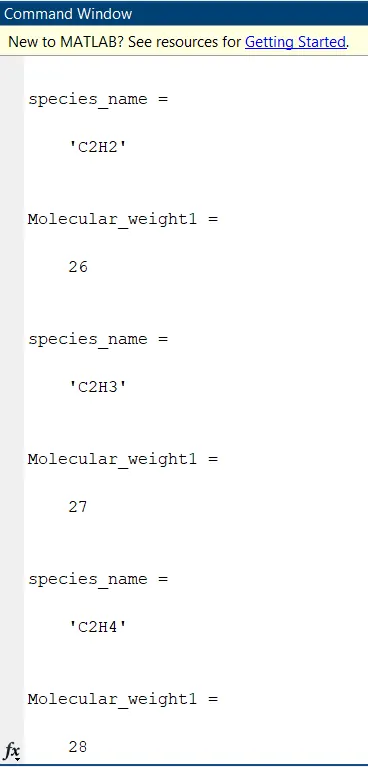
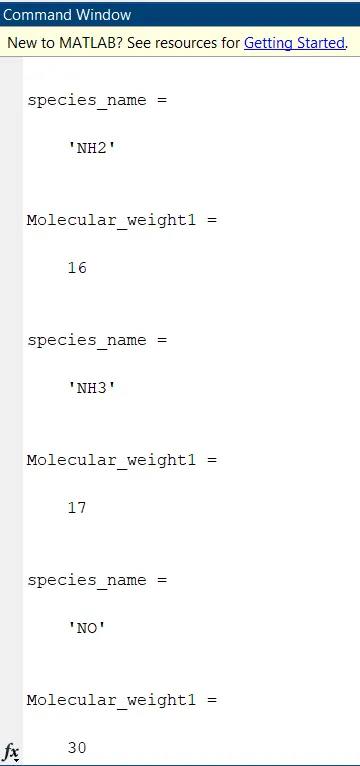
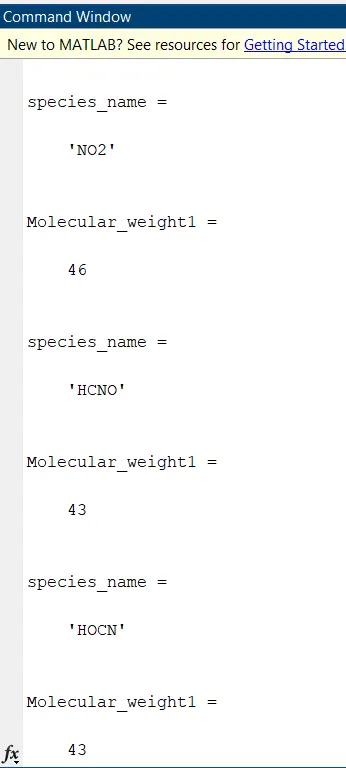
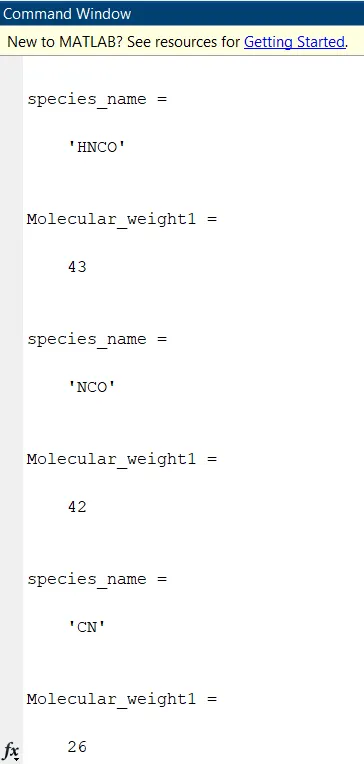
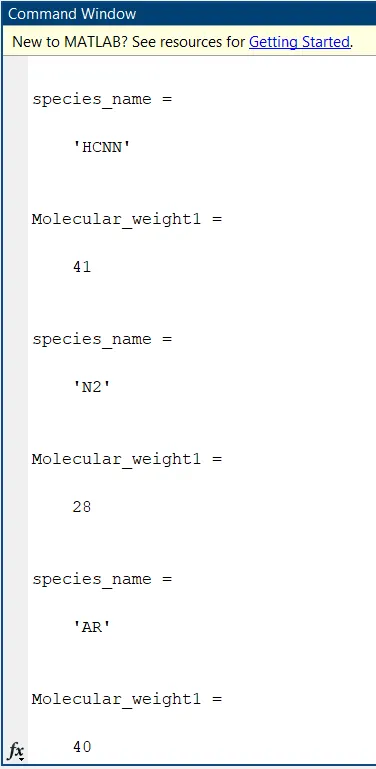
- To calculate Enthalpy, Entropy, Specific heat & molecular weight for all the species in the data file.
- Plot Cp, Enthalpy, and Entropy for temperature range for all species.
- All the plot created must be saved to the in separate folders with the species name containing all the three plots.
Matlab code for Parsing of NASA thermodynamic file :
clear all
close all
clc

%Open Nasa experimental data
f1 = fopen('THERMO1.dat','r');

%reading 1st line from the data
first_line = fgetl(f1);

%Reading the 2nd line from the data for obtaining the temperatures ranges
global_temp_range = fgetl(f1);

%splitting the 2nd line using strsplit and 'space' as delimiter
temp_range = strsplit(global_temp_range,' ');

%Obatining the temperature values from the splitted data and converting
%string to number
global_min_temp = str2num(temp_range{2});
global_med_temp = str2num(temp_range{3});
global_max_temp = str2num(temp_range{4});

%skipping the comment lines
for i =1:3
    comments = fgetl(f1);
end


%iterating codes for all 53 elements
for j =1:inf

    species_ln = fgetl(f1);
    %this will display once when code is completly executed
    if strcmp(species_ln,'END')
        disp('file reading completed')
        break
    end
    species = strsplit(species_ln,' ');
    species_name = species{1}

    line2 = fgetl(f1);
    A = strfind(line2,'E');

    a1 = str2num(line2(1:A(1)+3));
    a2 = str2num(line2(A(1)+4:A(2)+3));
    a3 = str2num(line2(A(2)+4:A(3)+3));
    a4 = str2num(line2(A(3)+4:A(4)+3));
    a5 = str2num(line2(A(4)+4:A(5)+3));

    line3 = fgetl(f1);
    B = strfind(line3,'E');

    a6 = str2num(line3(1:B(1)+3));
    a7 = str2num(line3(B(1)+4:B(2)+3));
    b1 = str2num(line3(B(2)+4:B(3)+3));
    b2 = str2num(line3(B(3)+4:B(4)+3));
    b3 = str2num(line3(B(4)+4:B(5)+3));


    line4 = fgetl(f1);
    C = strfind(line4,'E');

    b4 = str2num(line4(1:C(1)+3));
    b5 = str2num(line4(C(1)+4:C(2)+3));
    b6 = str2num(line4(C(2)+4:C(3)+3));
    b7 = str2num(line4(C(3)+4:C(4)+3));

    % First 7 are high temperature co-efficients from a1 to a7
    % Second 7 are low temperature co-efficients from b1 to b7


    %Create a vector of 500 evenly spaced temperature points
    T = linspace(global_min_temp,global_max_temp,500);
    % Universal gas constant
    R = 8.314;

    %calling the function with all the obtained coefficient and temperatures
    [cp ,h ,s ] = coeff(a1,a2,a3,a4,a5,a6,a7,b1,b2,b3,b4,b5,b6,b7,T,R,global_med_temp);

     %calling the molecular weight function with the spcies name
     Molecular_weight1= mole_weight1(species_name)

     %saving and plotting the data
    mkdir('data1')
    cd('data1')
    mkdir(species_name)
    cd(species_name)

    figure(1)
    plot(T,cp,'linewidth',3,'color','g')
    title(sprintf('Specific heat Vs Temperature for %s',species_name))
    xlabel('TEMPERATURE')
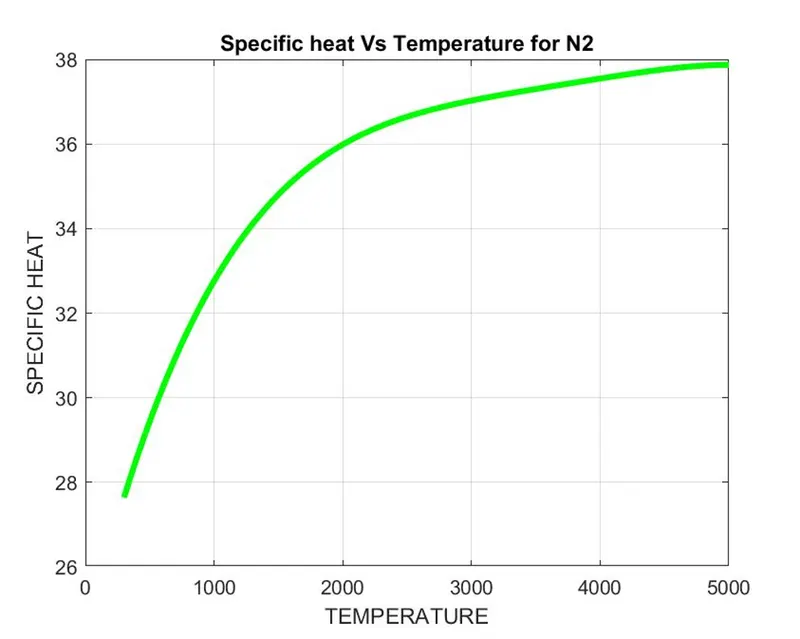
    ylabel('SPECIFIC HEAT')
    grid on

    figure(2)
    plot(T,h,'linewidth',3,'color','b')
    title(sprintf('Enthalpy Vs Temperature for %s',species_name))
    xlabel('TEMPERATURE')
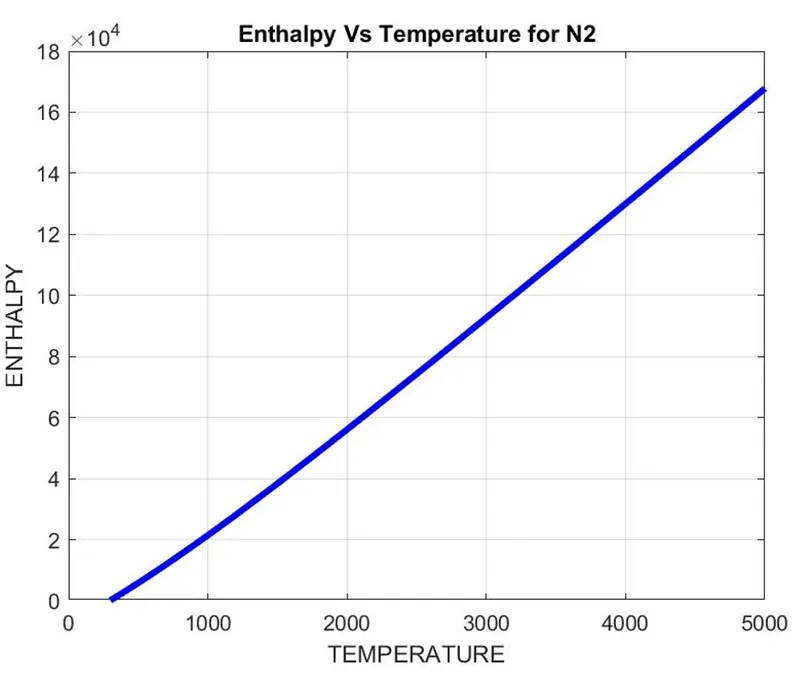
    ylabel('ENTHALPY')
    grid on

    figure(3)
    plot(T,s,'linewidth',3,'color','r')
    title(sprintf('Entropy Vs Temperature for %s',species_name))
    xlabel('TEMPERATURE')
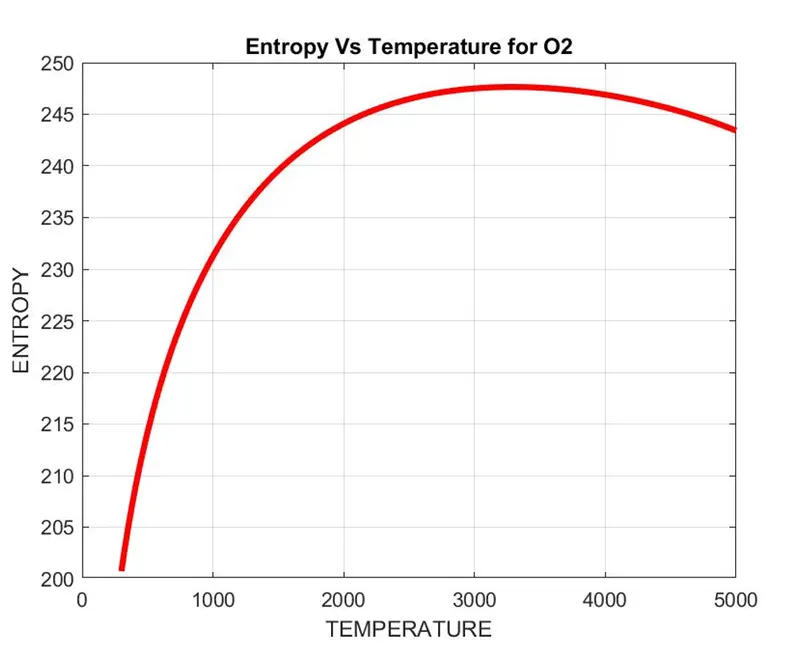
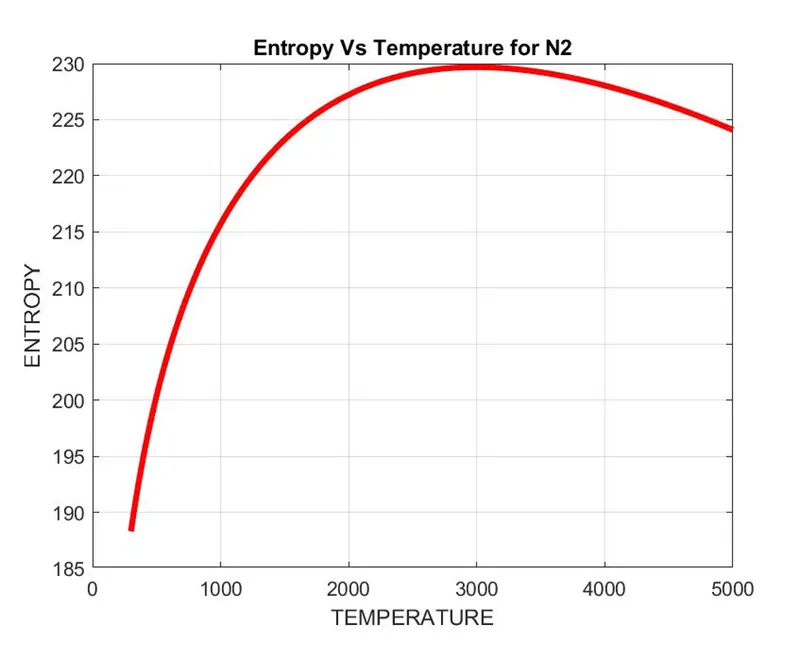
    ylabel('ENTROPY')
    grid on


    saveas(1,'Specific heat.jpg');
    saveas(2,'Enthalpy.jpg');
    saveas(3,'Entropy.jpg');

    cd ..
    cd ..


end
Matlab code to function to calculate the specfic heat, Enthalpy and Entropy :
%function to calculate the specfic heat, Enthalpy and Entropy
function [cp ,h ,s ] = coeff(a1,a2,a3,a4,a5,a6,a7,b1,b2,b3,b4,b5,b6,b7,T,R,global_med_temp)


       %Iterating with all the 500 temperatures
       for g = 1:length(T)
           %if the temperature is above the global_med_temperature
           if T(g)>global_med_temp

               %specfic heat
               cp = R.*(a1 + a2.*T + a3.*T.^2 + a4.*T.^3 + a5.*T.^4);
               %Enthalpy
               h =  R.*(a1.*T + (a2.*T.^2)./2 + (a3.*T.^3)./3 + (a4.*T.^4)./4 + (a5.*T.^5)./5 + a6);
               %Entropy
               s = R.*(a1.*log(T) + a2.^T + (a3.*T.^2)./2 + (a4.*T.^3)./3 + (a5.*T.^4)./4 + a7 );

           %if the temerature is belove the gobal_med_temperature
           else
               %specfic heat
                cp = R.*(b1 + b2.*T+ b3.*T.^2 + b4.*T.^3 + b5.*T.^4);
                %Enthalpy
                h = R.*(b1.*T + (b2.*T.^2)./2 + (b3.*T.^3)./3 + (b4.*T.^4)./4 + (b5.*T.^5)./5 + b6);
                %Entropy
                s = R*(b1.*log(T) + b2.*T + (b3.*T.^2)./2 + (b4.*T.^3)./3 + (b5.*T.^4)./4 + b7);

           end


       end
end
Matlab code to calculate Molecular weight :
%function to calculate molecular weight of each species
function [mol_wt]=mole_weight1(element_name)
  %convert species name to upper case
  elements=upper(element_name);
   %the cell array of elements
  atoms={'H','C','N','O','A'};
   %providing atomic weight for the elements resp
   atomic_wt=[1 12 14 16 40];
   %assigning initially mol_wt to 0
   mol_wt=0;
 %iterating i from 1 to length of the species_name
   for i=1:length(elements)
       %iterating i from 1 to length of the elements
       for j=1:length(atoms)
          %comparing the species string with the elements string
           if strcmp(elements(i),atoms(j))
              %adding the atomic weight of the matched element
              mol_wt=mol_wt+atomic_wt(j);
              p= j;
           end


       end
        %converting the string to number
        n=str2double(elements(i));
        %if n of NaN is greater than 1 then perform the calculation
        if n>1
            mol_wt=mol_wt+atomic_wt(p)*(n-1);
        end
   end
end
Explanation of Matlab code :
- I used ‘fopen’ command to open Nasa’s experimental data.
- 1st line consists of text (THERMO1). I used ‘fgetl’ command to read the 1st
- Second-line consists of 3 temperature values. Use ‘fgetl’ to read the 2nd line and store it in variable global_temp_range.
- After reading the 2nd line, then use ‘strsplit’ command using ‘space’ as a delimiter. ‘strsplit’ splits the data using the given delimiter. Therefore, temp_range consists of all 3 temperature values in a array.
- Now, obtain the global minimum, medium, and maximum temperatures from the split data, use ‘str2num’ as this converts character array to numeric array.
- 3rd,4th & 5th lines in the data are comments. Use ‘fgetl’ again for reading those 3 lines just to skip lines.
- From line ‘6’ to line ‘218’, there are a set of 4 lines. 1st line consists of the name of species 2nd, 3rd, 4th lines consist of experimental data.
- Line 1 – read line ‘6’ using ‘fgetl’ and stored it in line 1 variable species_ln.
- I have used ‘strsplit’ command to split into array and read only 1st cell of the array which is the species name(i.e, species name ‘O’)
- Line 2 – I have read line ‘7’ using ‘fgetl’ and stored it in line 2 variable.
- Use ‘strfind’ command to find the places of ‘E’ in line 7, ‘strfind’ is used to find strings within other strings. Now store them in an array named ‘A’
- Similarly, follow these steps for the next 2 lines. Then, you will get A, B, C arrays respectively.
- Now, extract all the coefficients (a1, a2, a3, a4, a5, a6, a7, b1, b2, b3, b4, b5, b6, b7) using ‘str2num’ command.
- All this process should be done again for line 7 to line 212. Therefore, I have created a ‘for-loop’ for all the 53 species.
- Then create a vector of 500 evenly spaced temperature points using ‘linspace’ command and provide universal gas constant value.
- And now I have created separate function to calculate Cp, H, S and Molecular weight called them with all inputs arguments.
- And now we have to created a file 'data1' using 'mkdir' command and now to open that data file i used 'cd' command and again created separate folde for each species with 'cd' command.
- And now using 'plot' command created a Plot for Cp, Enthalpy, and Entropy for temperature range for all species and stored them individually in their folder using 'saveas' command in jpg format.
Results :
Screenshot of the windows where all the folders are saved :

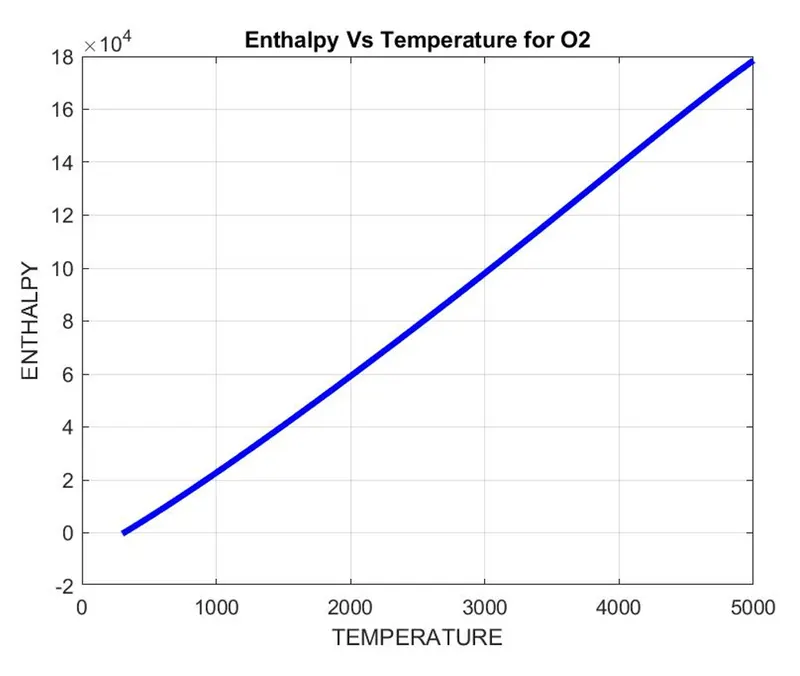
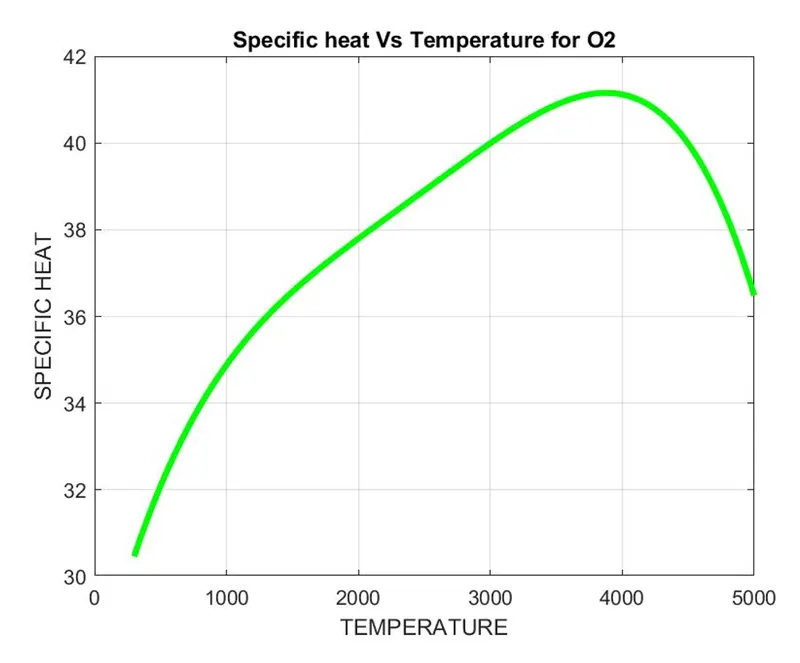
Plots for O2 :
Plots for N2 :
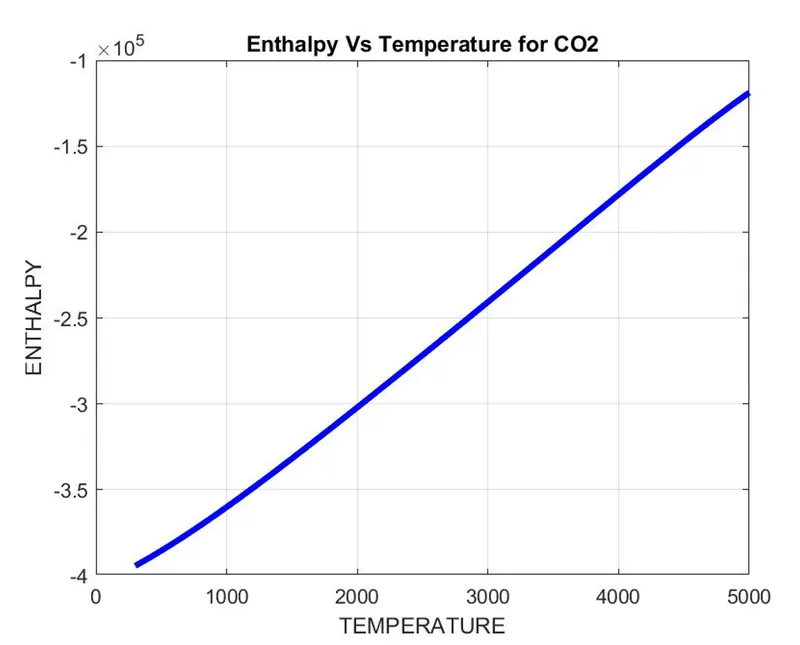
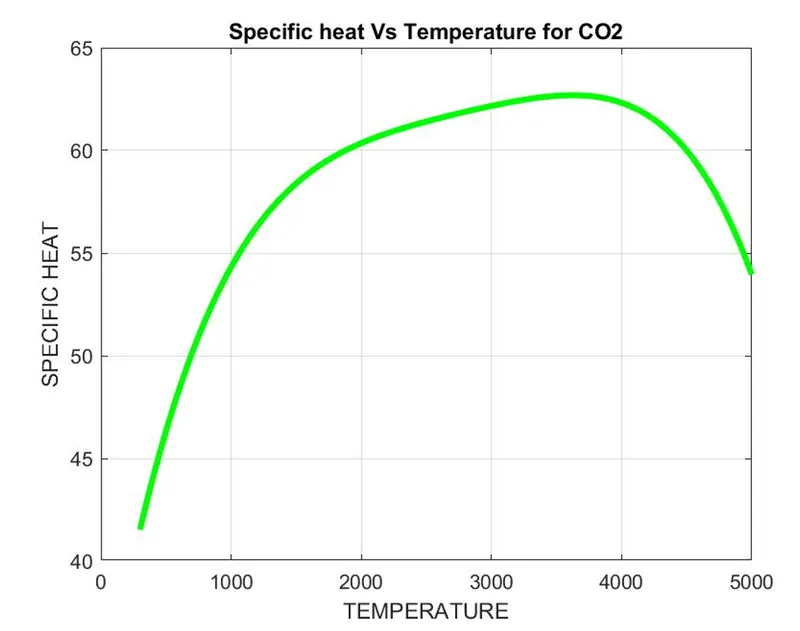
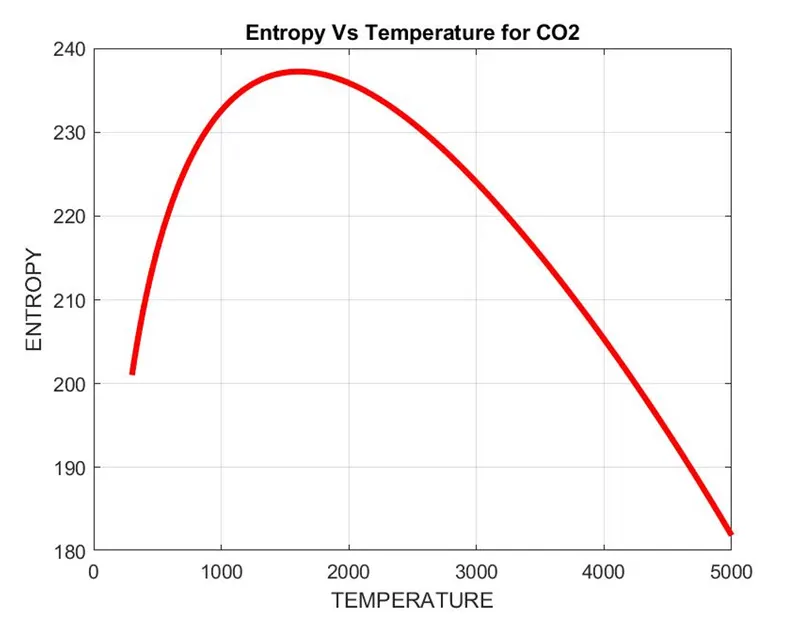
Plots for co2 :
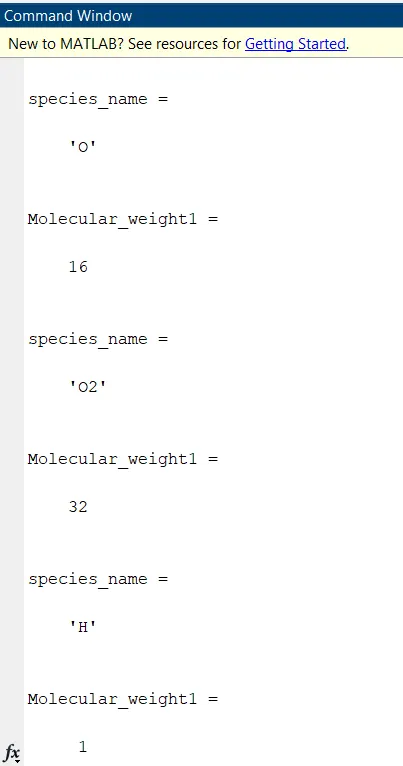
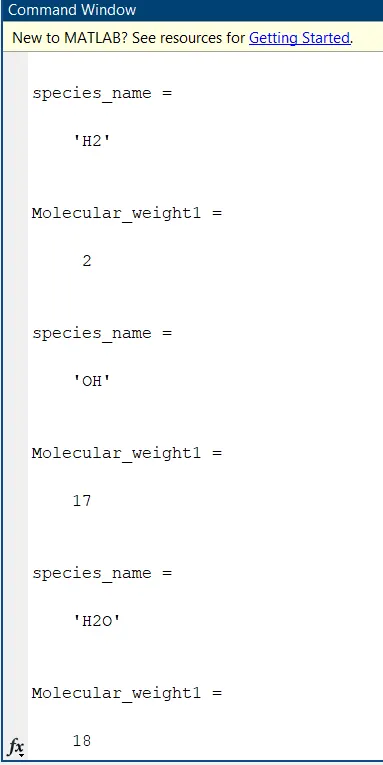
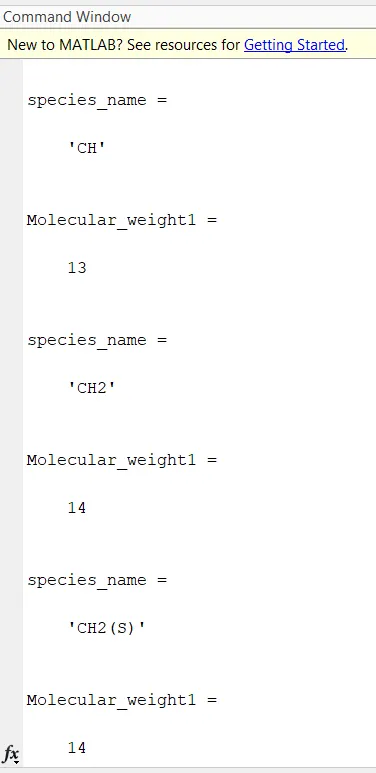
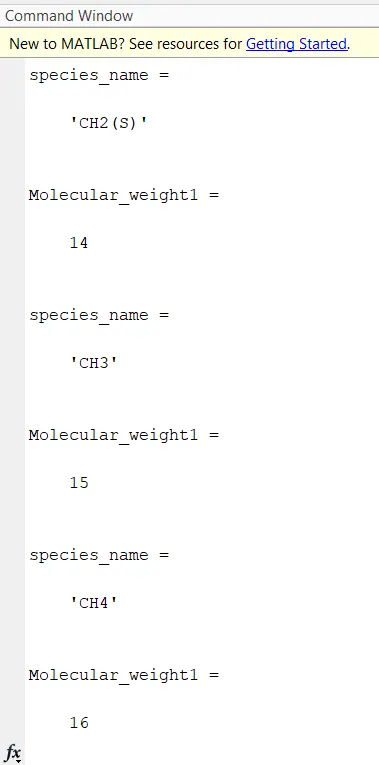
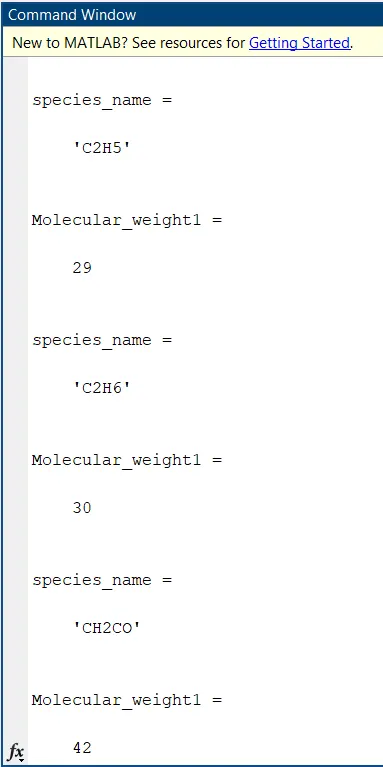
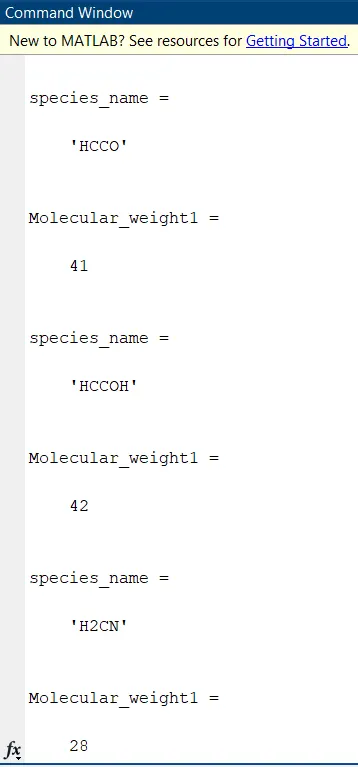
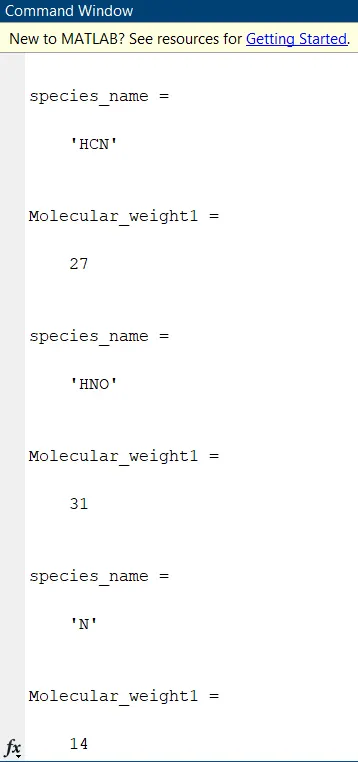
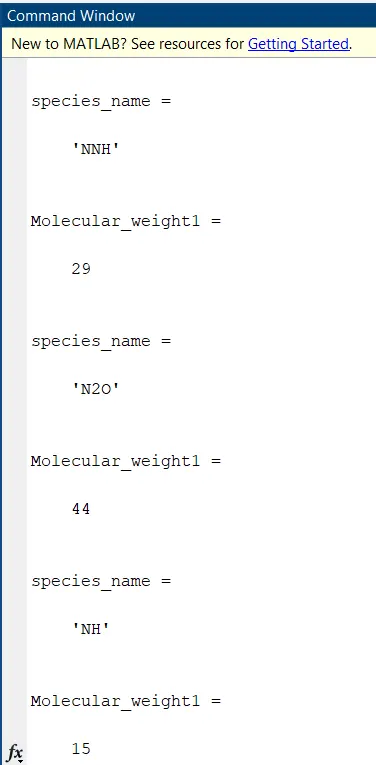
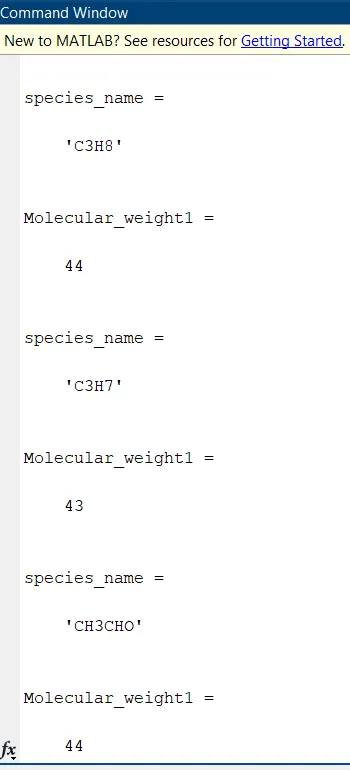
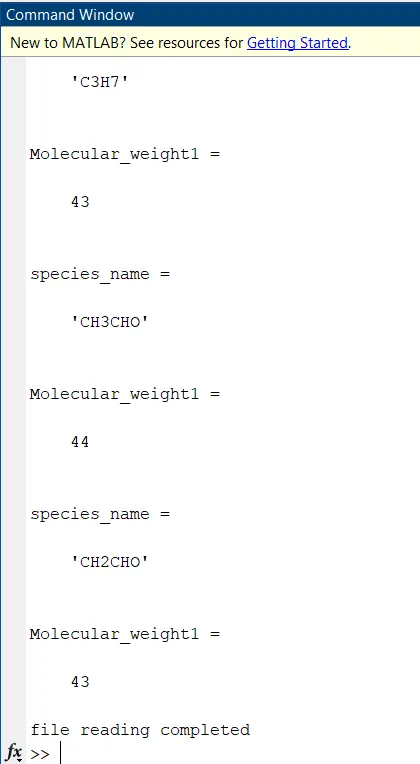
Screen shot of moleculare weight :