Project 1 - Parsing NASA thermodynamic data
EXPLANATION:
AIM:
To parse the thermodynamics data file by NASA.
INTRODUCTION:
FILE PARSING:
File parsing method is reading in a data stream, data can be extracted from the file which is stored and use
to do calculation. Both of the temperature is low & high for various species are extracted and to calculate the Cp, S, & h.
OBJECTIVE:
* To extract the coefficients from the file for each one.
* For each species of molecular weight is calculated.
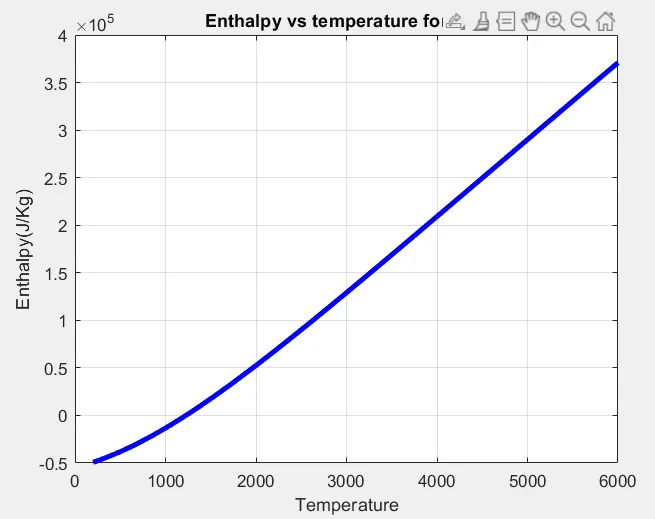
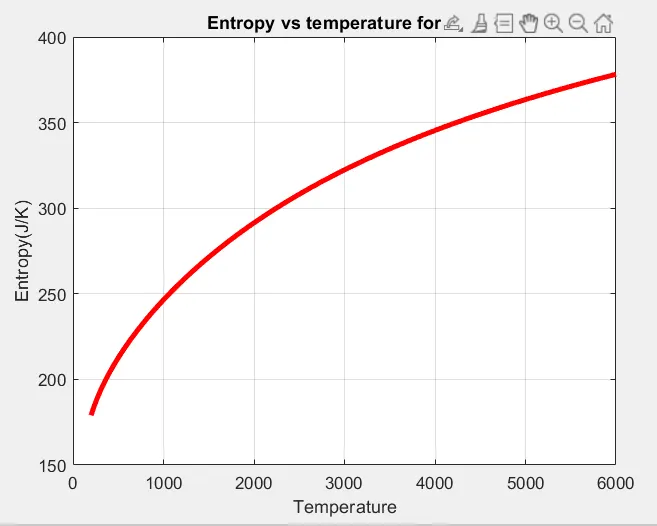
* Plot the Enthalpy(h), Entropy(S) & Specific heat(Cp) of each species with respesct to both low & high
temperature coefficients.
* Save the plots in respective folders of the species.
FORMULA:
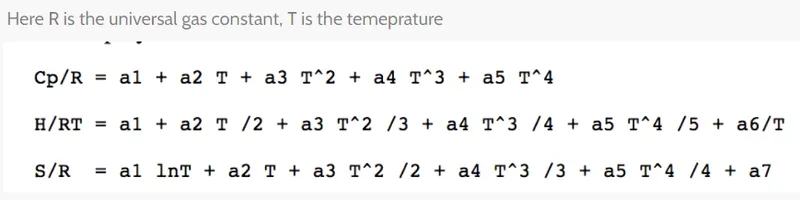
It is used to calculate the thermodynamics properties are given in below.
MAIN PROGRAM:
CODE:
%file parsing
clear all
close all
clc
%reading data from the file
f1 = fopen('THERMO.dat','r');
%Removing the first 5 lines
for j=1:5
fgetl(f1);
end
for i=1:53
%Obtaining the name of the species and converting to a string value
tline = fgetl(f1);
a = strsplit(tline1, ' ');
species_cell = a(1);
species = char(species_cell);
len=length(a)
%Finding the local values of temperature for each species
% str1 = strfind(tline1, '.');
low_local_coeff = str2double(a{len-3});
high_local_coeff = str2double(a{len-2});
mid_local_coeff= str2double(a{len-1});
%extracting the first line coeff
Line1 = fgetl(f1);
SL1 = strfind(Line1,'E');
Coef1 = Line1(1:SL1(1)+3);
Coef2 = Line1(SL1(1)+4:SL1(2)+3);
Coef3 = Line1(SL1(2)+4:SL1(3)+3);
Coef4 = Line1(SL1(3)+4:SL1(4)+3);
Coef5 = Line1(SL1(4)+4:SL1(5)+3);
a1 = str2double(Coef1);
a2 = str2double(Coef2);
a3 = str2double(Coef3);
a4 = str2double(Coef4);
a5 = str2double(Coef5);
%extracting the second line coeff
Line2 = fgetl(f1);
SL2 = strfind(Line2,'E');
Coef6 = Line2(1:SL2(1)+3);
Coef7 = Line2(SL2(1)+4:SL2(2)+3);
Coef8 = Line2(SL2(2)+4:SL2(3)+3);
Coef9 = Line2(SL2(3)+4:SL2(4)+3);
Coef10 = Line2(SL2(4)+4:SL2(5)+3);
a6 = str2double(Coef6);
a7 = str2double(Coef7);
a8 = str2double(Coef8);
a9 = str2double(Coef9);
a10 = str2double(Coef10);
%extracting the third line coeff
Line3 = fgetl(f1);
SL3 = strfind(Line3,'E');
Coef11 = Line3(1:SL3(1)+3);
Coef12 = Line3(SL3(1)+4:SL3(2)+3);
Coef13 = Line3(SL3(2)+4:SL3(3)+3);
Coef14 = Line3(SL3(3)+4:SL3(4)+3);
a11 = str2double(Coef11);
a12 = str2double(Coef12);
a13 = str2double(Coef13);
a14 = str2double(Coef14);
%Temperature for which the Cp, S, & h is calculated:
T=linspace(low_local_coeff,high_local_coeff,1000);
R = 8.314;
FUNCTION FOR Cp, S, & h:
for i=1:length(T)
if T(i)> mid_local_coeff
Cp(i) = (a1+(a2*T(i))+(a3*(T(i).^2))+(a4*(T(i).^3))+(a5*(T(i).^4)))*R;
S(i) = (a1*log(T(i))+(a2*T(i))+((a3*(T(i).^2))/2)+((a4*(T(i).^3))/3)+((a5*(T(i).^4))/4)+(a7))*R;
H(i) = (a1+(a2.*T(i)./2)+(a3.*T(i).^2)./3+((a4.*(T(i).^3))./4)+((a5.*(T(i).^4))./5)+(a6./T(i))).*(R.*T(i));
else
Cp(i)= (a8+(a9*T(i))+(a10*(T(i).^2))+(a11*(T(i).^3))+(a12*(T(i).^4)))*R;
H(i) = (a8+(a9.*T(i)./2)+((a10.*(T(i).^2))./3)+((a11.*(T(i).^3))./4)+((a12.*(T(i).^4))./5)+(a13./T(i))).*(R.*T(i));
S(i) = (a8*log(T(i))+(a9*T(i))+((a10*(T(i).^2))/2)+((a11*(T(i).^3))/3)+((a12*(T(i).^4))/4)+(a14))*R;
end
end
FUNCTION FOR MOLECULAR WEIGHT:
Molecular_weight=Mol_Weight(species);
sprintf('Molecular_weight of %s=%d', species,Molecular_weight)
%CREATING THE FOLDER
f=sprintf('%s',species);
%making a directory & changing to save the plots:
mkdir(f)
%navigating inside the folder
cd(f);
%Creating the plots:
%Plotting H v T
figure(1)
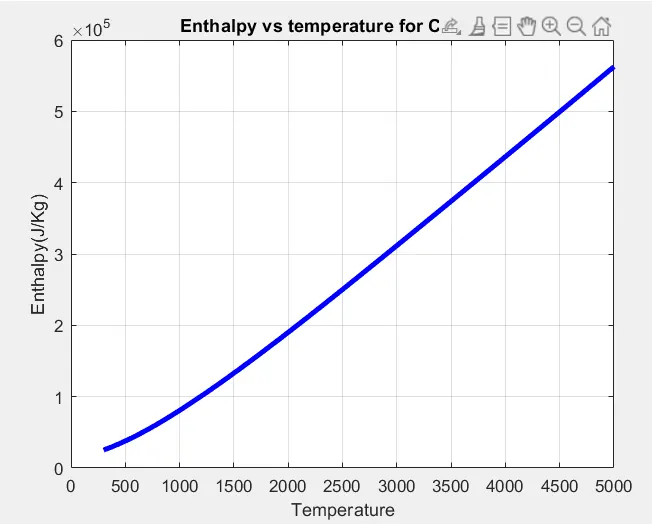
plot(T,H,'linewidth',3,'color','b')
grid on
xlabel('Temperature')
ylabel('Enthalpy(J/Kg)')
title(sprintf('Enthalpy vs temperature for %s',species))
saveas(figure(1),'H vs T.jpg')
%Plotting Cp v T
figure(2)
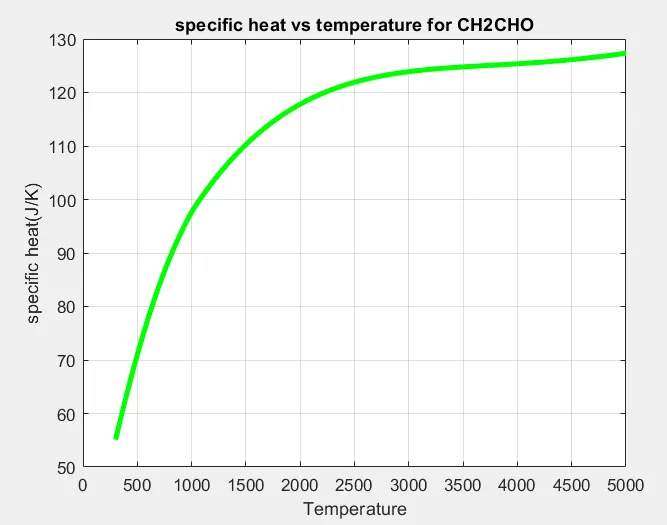
plot(T,Cp,'linewidth',3,'color','g')
grid on
xlabel('Temperature')
ylabel('specific heat(J/K)')
title(sprintf('specific heat vs temperature for %s',species))
saveas(figure(2),'Cp vs T.jpg')
%Plotting S v T
figure(3)
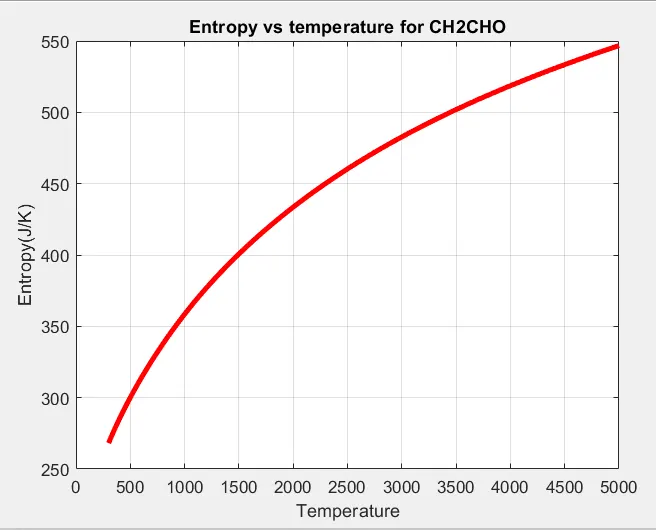
plot(T,S,'linewidth',3,'color','r')
grid on
xlabel('Temperature')
ylabel('Entropy(J/K)')
title(sprintf('Entropy vs temperature for %s',species))
saveas(figure(3),'S vs T.jpg')
%exiting from the folder
cd ..
end
CODE EXPLANATION:
* The name of the file is " THERMO.dat " & the reading access using " fopen " command.
* Using for next line is " fgetl " command & the string is split using " strsplit " command.
* The numbers in the string are converted by using the " str2double " command.
* The local temperature are extracted.
* Code function is created contain the formula to calculate the Cp, S & h and call in the main code.
* The temperature is created using the " linspace ".
* The Cp, S & h is calculated for this temperature and graphs are plotted.
* A further directory is created using the " mkdir " command to make folders with the name of the
species & the plots are saved in general species name.
* Code function is created to calculate the molecular weight of species & call in the main program.
* Both of the condition are " if " & " strcmp " command is used to end the program & the string is read
as 'END'.
EXPLANATION:
FUNCTION FOR MOLECULAR WEIGHT :
* Both of the array is atoms & atomic weight respective character array is defined.
* " if " conditional loop is used in this molecules.
* Accordingly the molecular weight is calculated.
* " sprintf " command is used to print the molecular weight.
FUNCTION FOR Cp, S & h:
* The input & output results are having the low temperatrure coefficients & high temperature
coefficients & the temperature is determined.
* An " if " conditional loop is used to give the condition, using the low or high temperature
coefficients is less than mid & high local temperature respectively.
PLOT-1 : CH2CHO
Cp vs T
h vs T
S VS T
COMMAND WINDOW:

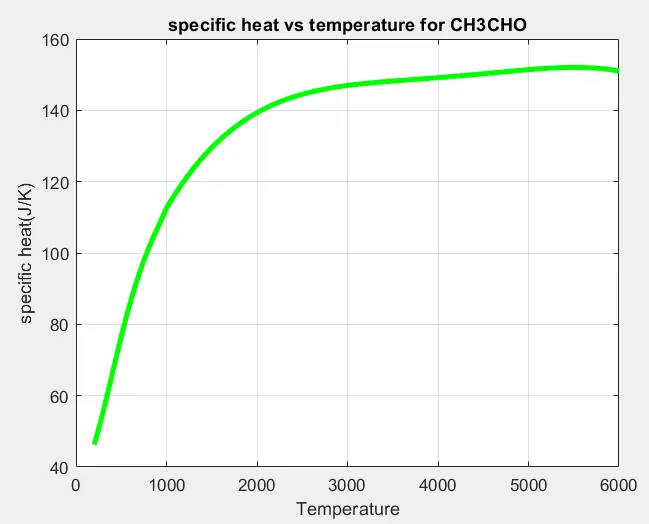
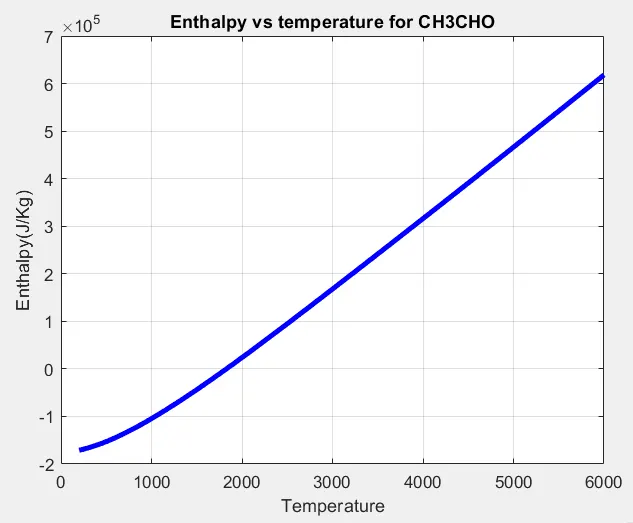
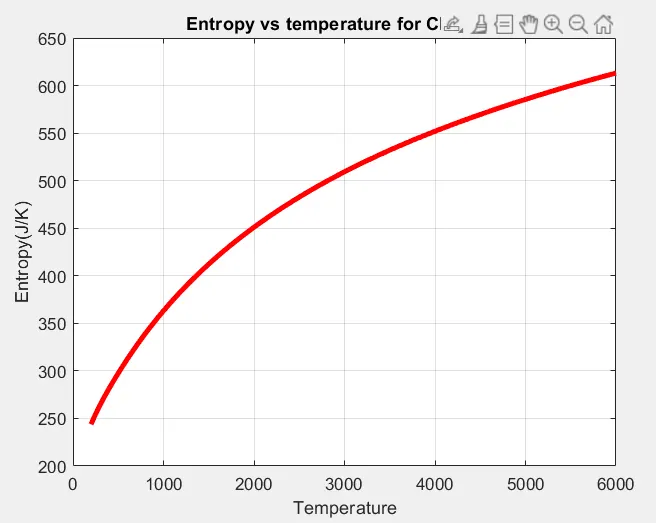
PLOT-2: CH3CHO
CP VS T
h VS T
S VS T
COMMAND WINDOW:

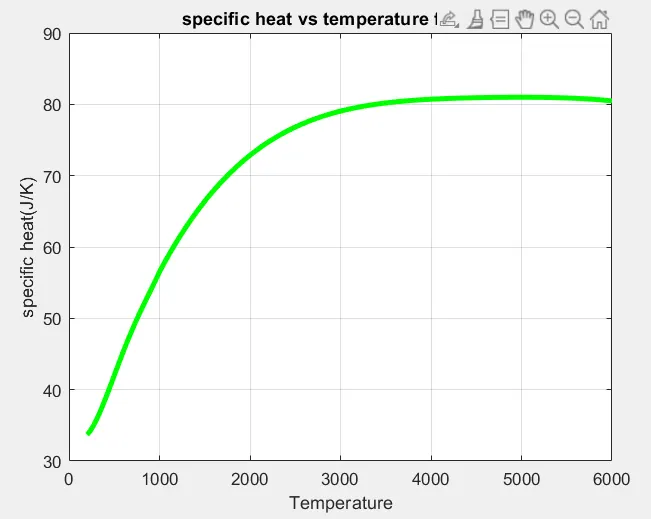
PLOT-3: NH3
CP VS T
h VS T
S VS T
COMMAND WINDOW:

CONCLUSION & RESULT:
* The coefficients were extracted from the file.
* The molecular weight were calculated for all the compound.
* The graphs are plotted and then saved in respective place of compound folder.