Project 1 - Parsing NASA thermodynamic data
Aim:
1. To write a MatLab code to extract 14 species from the given Nasa temp data and calculate entropy, enthalpy, and specific heats for all the species from provided formulae
R is the universal gas constant
T is the temperature 
2. calculate the molecular weight of each molecule and display them in the command window.
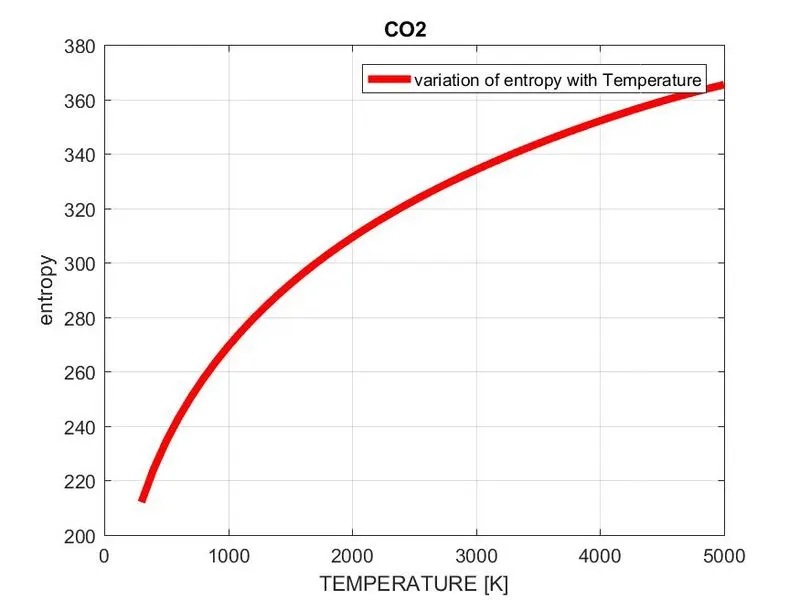
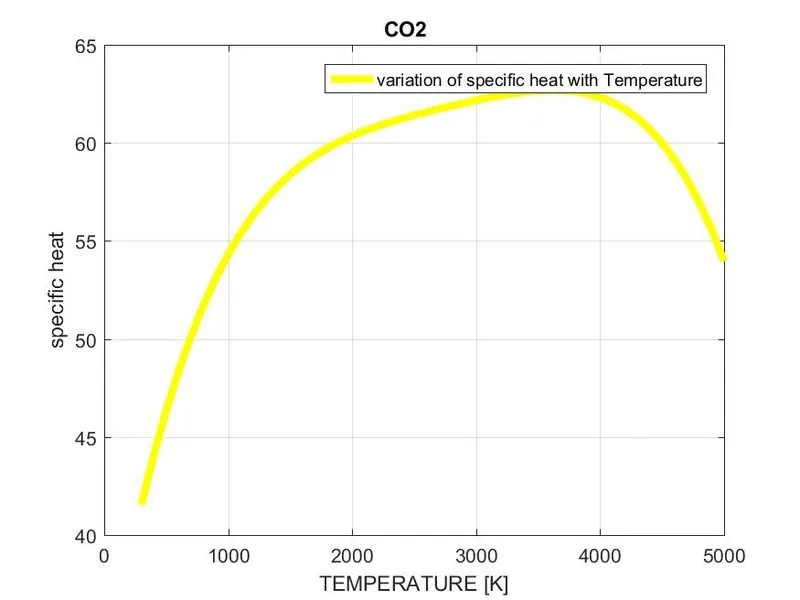
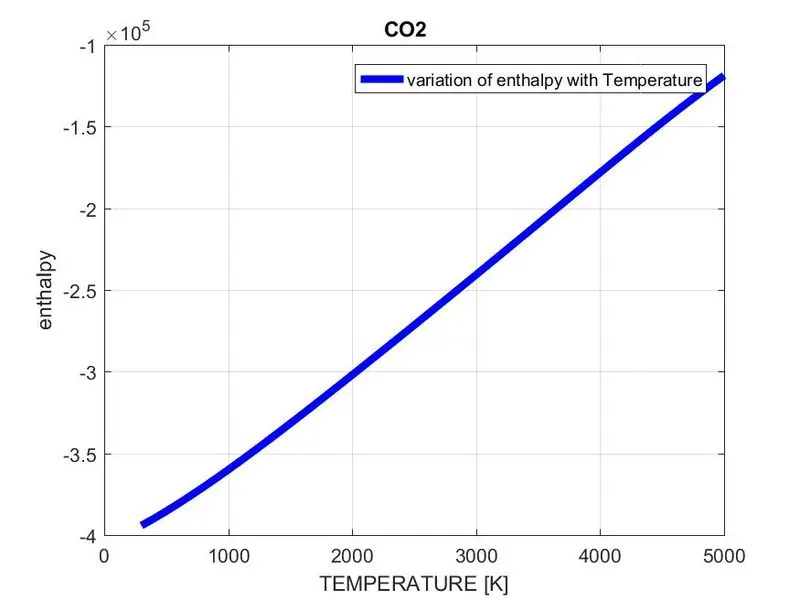
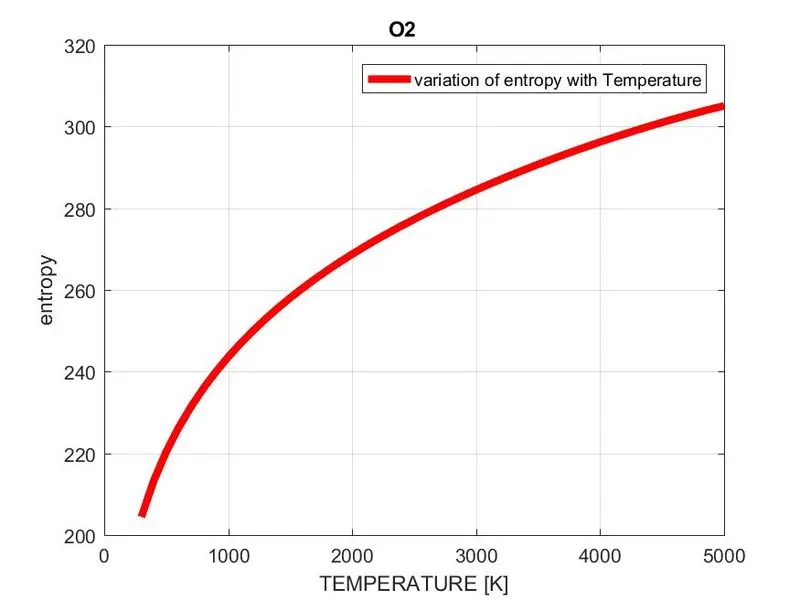
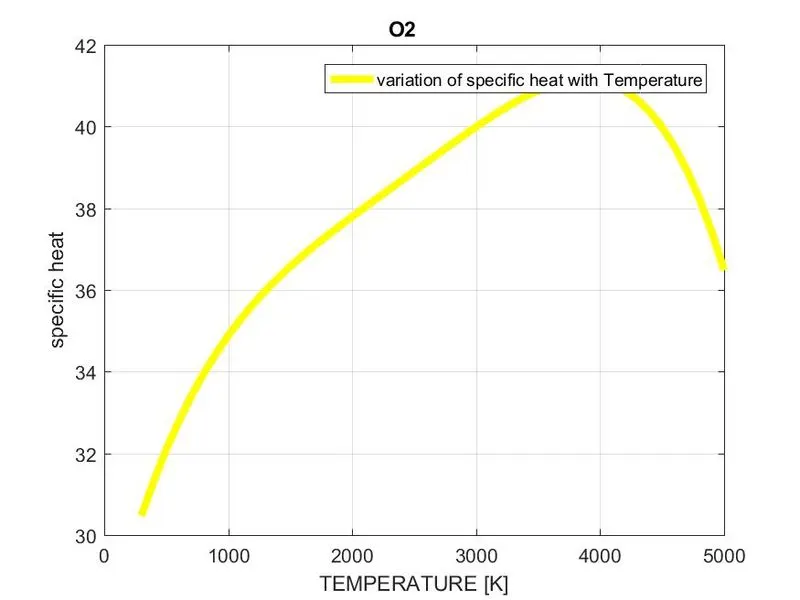
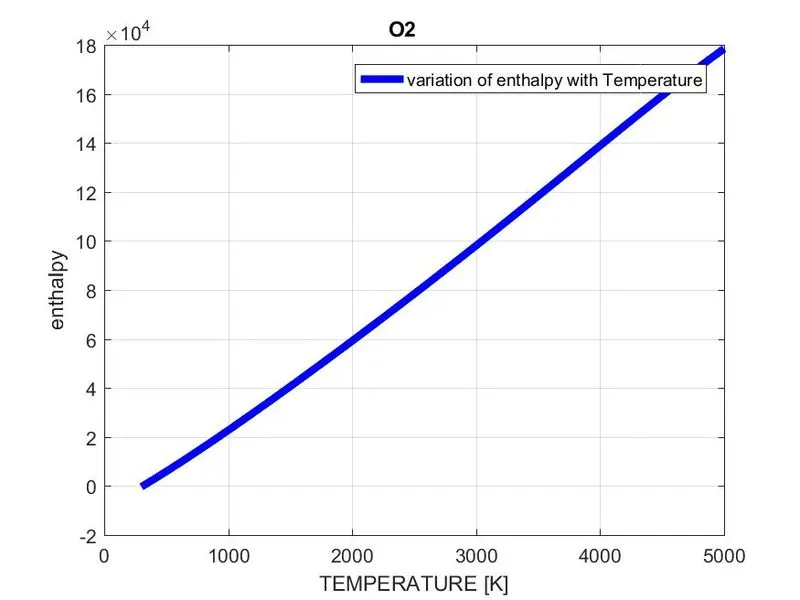
3. automatically, generate plotting T vs Cp, S, H for all the species and save them in appropriate folders for all the species.
5. Screenshots of the folder where all the plots are saved.
6. provides plots of O2, N2 & Co2
the main program for plots of all species, molecular weight, and function for both given below step-wise explanations are given below.
%% main program for both
clear all       % clear all the temporary files
close all       % close all the plots
clc             % clear the commond window
 file=fopen('THERMO.dat','r'); % opening the file THERMo.dat
 lhead=fgetl(file);            % getting heading of the file
 lt=fgetl(file);               %  reading temperature values
 lc1=fgetl(file);              % reading the commet in the file
 lc2=fgetl(file);              % reading the commet in the file

A=strsplit(lt,' ') ;            % splitting the lt string assing to a variable A
Tl=str2double(A{2});            % converting string to array assing to T1 varable
Tm=str2double(A{3});            % converting string to array assing to Tm varable
Th=str2double(A{4});            % converting string to array assing to T1 varable
 %species information
 l01=fgetl(file);               % reading the comment in the file
 for i=1:53                     % defining how many times  i is going to execute
 species=fgetl(file);           % reading species
 species_name=species(1:6);

 l1=fgetl(file);                % assigning species to to variable l1
 a=strfind(l1,'E');             % finding positon of E in he sstring l1 and assing variable to a
a_1=l1(1:12+3);                 % from line 23(a_1) to 54 (a14) in the program defiens the rading
                                %the valuse of all the 14 coefficients
 a1=str2num(a_1);
 a_2=l1(a(1)+4:a(2)+3);
 a2=str2num(a_2);
 a_3=l1(a(2)+4:a(3)+3);
 a3=str2num(a_3);
 a_4=l1(a(3)+4:a(4)+3);
 a4=str2num(a_4);
 a_5=l1(a(4)+4:a(5)+3);
 a5=str2num(a_5);
 l2=fgetl(file);
 b=strfind(l2,'E');
 a_6=l2(1:12+3);
 a6=str2num(a_6);
 a_7=l2(b(1)+4:b(2)+3);
 a7=str2num(a_7);
 a_8=l2(b(2)+4:b(3)+3);
 a8=str2num(a_8);
 a_9=l2(b(3)+4:b(4)+3);
 a9=str2num(a_9);
 a_10=l2(b(4)+4:b(5)+3);
 a10=str2num(a_10);
 l3=fgetl(file);
 c=strfind(l3,'E');
 a_11=l3(1:12+3);
 a11=str2num(a_11);
 a_12=l3(c(1)+4:c(2)+3);
 a12=str2num(a_12);
 a_13=l3(c(2)+4:c(3)+3);
 a13=str2num(a_13);
 a_14=l3(c(3)+4:c(4)+3);
 a14=str2num(a_14);
 %creating folder for each species

T=300:100:5000;    % defining range pf temperature
 R=8.314;          % value of universal gas constant


 % calling input function for finding out h, cp, s
 [h,cp,s]=inputs(R,T,a1,a2,a3,a4,a5,a6,a7,a8,a9,a10,a11,a12,a13,a14);

 %plotings
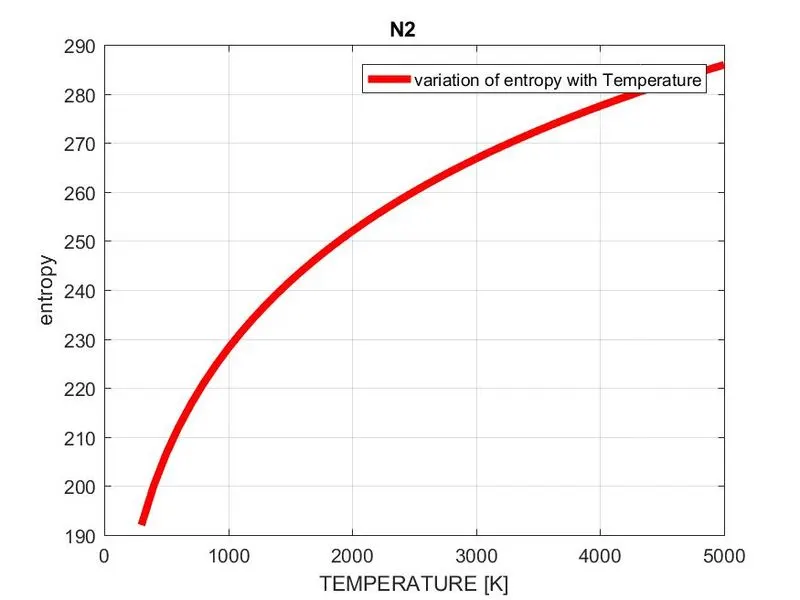
%temperature vs entropy
figure(1)
 plot(T,s,'color','r','linewidth',4)
 title(species_name);
 xlabel('TEMPERATURE [K]');
 ylabel('entropy')
 legend('variation of entropy with Temperature')
 grid on

 figure(2)
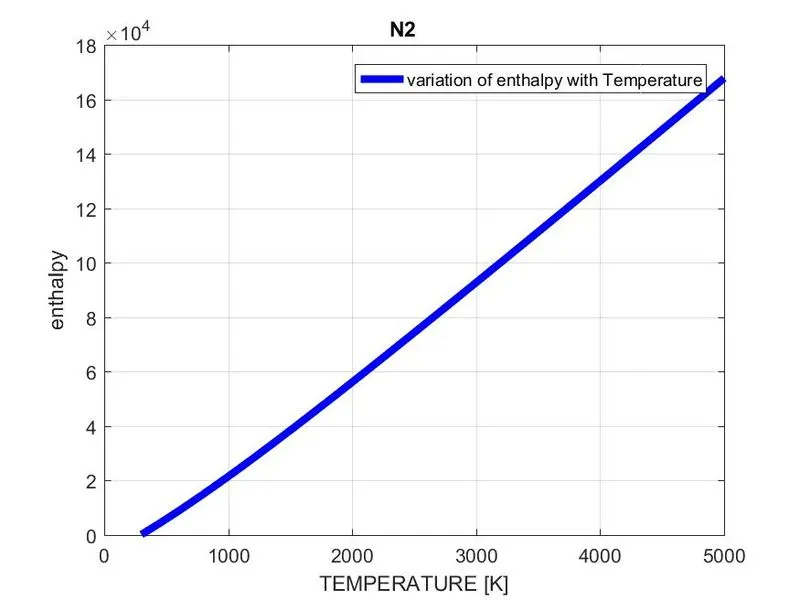
 %temperature vs enthalpy
 plot(T,h,'color','b','linewidth',4)
 title(species_name);
 xlabel('TEMPERATURE [K]');
 ylabel('enthalpy')
 legend('variation of enthalpy with Temperature')
 grid on

 figure(3)
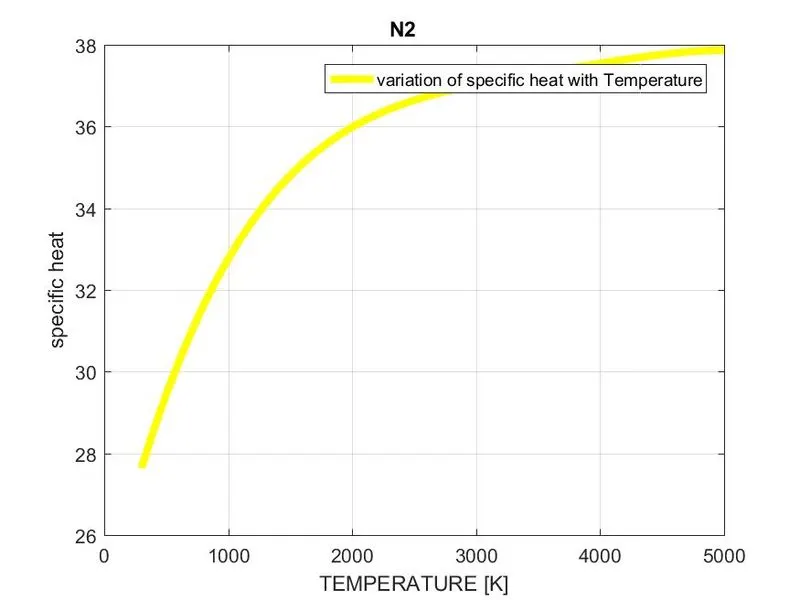
  %temperature vs specific heat
 plot(T,cp,'color','y','linewidth',4)
 title(species_name);
 xlabel('TEMPERATURE [K]');
 ylabel('specific heat')
 legend('variation of specific heat with Temperature')
 grid on

 directory =(['C:\Users\91957\coding files MATLAB\ ',species_name]);  % creat the folder (path) to save the images
 cd(directory)    %it changes current folder to new folder to save files

 %saves the plot
 saveas(1,'entropy.jpg');        % saving S vs T for all species
 saveas(2,'enthalpy.jpg');       % saving H vs T for all species
 saveas(3,'specific heat.jpg');  % saving Cp vs T file for all species
 cd('C:\Users\91957\coding files MATLAB\') % closing the directory

  % calling the function to calculate  molecular weight of species

 mm = molecular_mass(species_name);                     % formulae for calculate molecular weight
fprintf('molecular weight of %s=%f\n',species_name,mm); %to print the molecular weight of all species

 end
 fclose(file);   % closing the opened file which is opened to write


%% function for finding out the species s h & cp
function [h,cp,s]=inputs(R,T,a1,a2,a3,a4,a5,a6,a7,a8,a9,a10,a11,a12,a13,a14)
         Tm =1000; %mean temperature
    if T(i)>Tm     % condition for the temperature to be on high temperature side
        % formulae for finding out  cp for high temp
        cp=(a1+a2.*T+a3.*T.^2+a4.*T.^3+a5.*T.^4).*R;
         % formulae for finding out h for high temp
         h=(a1+(a2.*T)./2+(a3.*T.^2)./3+(a4.*T.^3)./4+(a5.*T.^4)./5+(a6./T)).*T.*R;
          % formulae for finding out s for high temp
        s=(a1.*log(T)+a2.*T+(a3.*T.^2)./2+(a4.*T.^3)./3+(a5.*T.^4)./4+a7)*R;

    else
         % formulae for finding out  cp for low temp
        cp=(a8+a9.*T+a10.*T.^2+a11.*T.^3+a12.*T.^4);
        % formulae for finding out h for low temp
        h=(a8+(a9.*T)./2+(a10.*T.^2)./3+(a11.*T.^3)./4+(a12.*T.^4)./5+(a13./T)).*T.*R;
        % formulae for finding out s for low temp
        s=(a8.*log(T)+a9.*T+(a10.*T.^2)./2+(a11.*T.^3)./3+(a12.*T.^4)./4+a14)*R;
    end
end
end


%% writing function to calculate molecular weifgt of each specie
 function [mm]=molecular_mass(species_name)
 species=upper(species_name);
 constituents=['H','C','N','O', 'A'];                    % different elements of species
 atomic_weight=[1.00794 12.0107 14.0067 15.9994 39.948]; % molecular weights of elements of species
 mm=0;  % initial value of variable
 u=0;
 for i=1:length(species)      % defining the length of i
     for j=1:length(atomic_weight)% defining the length of j
         if strcmpi(species_name(i),constituents(j))
             mm=mm+atomic_weight(j);
             u=j;
         end
     end
     n=str2double(species_name(i));
     if n>1

         mm=mm+atomic_weight(u)*(n-1);
     end
 end

 end
No errors have been found except some typing mistakes
Displaying the molecular weights of the all species
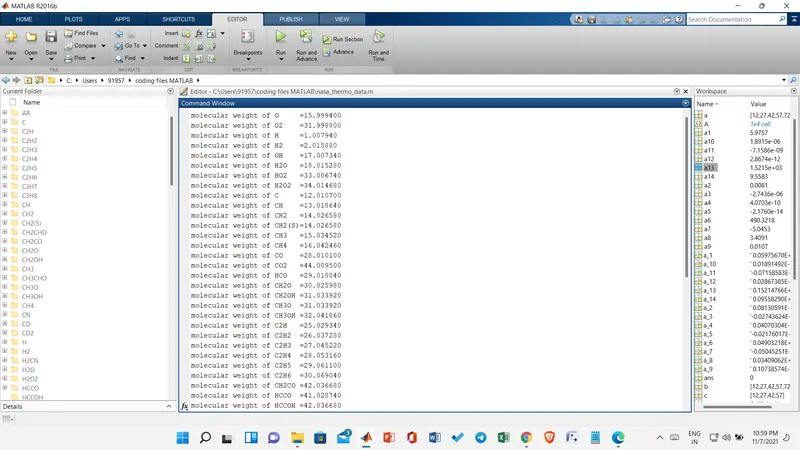
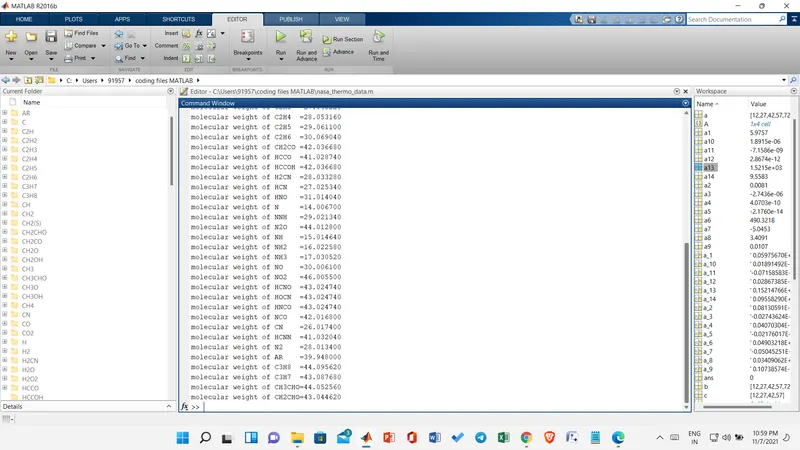
screenshot of the folder where all graphs of differents species were saved

All the plots of species O2
All the plots of species N2
All the plots of species CO2