Parsing NASA thermodynamic data
Aim
To write a code to parse NASA thermodynamic data file and calculate the thermodynamic properties like specific heat ,enthalpy and entropy.
Objective
- Write a function to extract 14 coefficients and calculate the thermodynamic properties of all species in the data file.
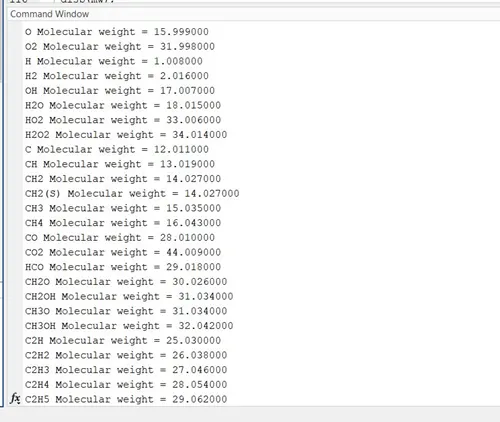
- Calculate the Molecular weight of each species and display it in the command window.
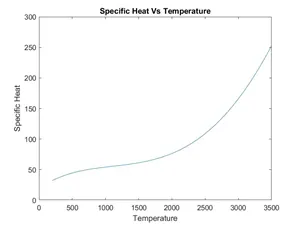
- Plot Cp,Enthaply and Entropy Vs Local Temperature specific for each species.
Theory
File parsing deals with how information can be read from a file and how it can be implemented in the program.File parsing refers to analysing a string oor symbols in a data file by splitting the data so that it can be used in the program.
Specific Heat :Amount of Heat per unit mass required to raise the temperature by one degree Celsius.
Enthalpy:It is the total heat content of a system.
Entropy:A measure of unavailable energy in a closed thermodynamic system.
Atomic Mass: The mass of an atom in atomic mass unit.It is equivalent to the number of neutrons and protons in the atom.
Molecular Weight: Total Weight of the given molecule.
Equations

T is the temperature
R is Universal Gas Coefficient
Cp: Specific Heat
H :Enthalpy
S: Entropy
The first 7 coefficients are Hight temperature Coefficient and the second 7 coefficients are low temperature coefficients in the given thermodynamic file.
Final Program
clear all
close all
clc
f1=fopen('THERMO.dat','r');
tline1=fgetl(f1);
%global_temp_line
tline2=fgetl(f1);
gtemp=strsplit(tline2,' ');
global_low_temperature=str2double(gtemp{2});
global_mid_temperature=str2double(gtemp{3});
global_high_temperature=str2double(gtemp{4});
%neglecting_next_3_lines
for i=1:3
neglect=fgetl(f1);
end
for i=1:53
line1=fgetl(f1);
split_1=strsplit(line1,' ');
Species_name=split_1{1};
a=strfind(line1,'G');
ltemp=line1(a+4:length(line1));
split_2=strsplit(ltemp,' ');
local_low_temp=str2double(split_2{1});
local_high_temp=str2double(split_2{2});
local_mid_temp=str2double(split_2{3});
%second_line
line2=fgetl(f1);
b=strfind(line2,'E');
b1=line2(1:b(1)+3);
b_1=str2double(b1);
b2=line2(b(1)+4:b(2)+3);
b_2=str2double(b2);
b3=line2(b(2)+4:b(3)+3);
b_3=str2double(b3);
b4=line2(b(3)+4:b(4)+3);
b_4=str2double(b4);
b5=line2(b(4)+4:b(5)+3);
b_5=str2double(b5);
%third_line
line3=fgetl(f1);
b6=line3(1:b(1)+3);
b_6=str2double(b6);
b7=line3(b(1)+4:b(2)+3);
b_7=str2double(b7);
b8=line3(b(2)+4:b(3)+3);
b_8=str2double(b8);
b9=line3(b(3)+4:b(4)+3);
b_9=str2double(b9);
b10=line3(b(4)+4:b(5)+3);
b_10=str2double(b10);
%fourth_line
line4=fgetl(f1);
b11=line4(1:b(1)+3);
b_11=str2double(b11);
b12=line4(b(1)+4:b(2)+3);
b_12=str2double(b12);
b13=line4(b(2)+4:b(3)+3);
b_13=str2double(b13);
b14=line4(b(3)+4:b(4)+3);
b_14=str2double(b14);
T= local_low_temp:local_high_temp;
R=8.314;
%calculation of Cp h and s
cp=specific_heat(b_1,b_2,b_3,b_4,b_5,b_8,b_9,b_10,b_11,b_12,local_mid_temp,T,R);
h=Enthalpy(b_1,b_2,b_3,b_4,b_5,b_6,b_8,b_9,b_10,b_11,b_12,b_13,local_mid_temp,T,R);
s=Entropy(b_1,b_2,b_3,b_4,b_5,b_7,b_8,b_9,b_10,b_11,b_12,b_14,local_mid_temp,T,R);
mkdir(['E:',Species_name]);
cd(Species_name)
figure(1)
plot(T,cp);
xlabel('Temperature')
ylabel('Specific Heat')
title('Specific Heat Vs Temperature')
image=getframe(gcf);
imwrite(image.cdata,' Cp vs T.png')
saveas(1,'specific_heat','jpg')
figure(2)
plot(T,h);
xlabel('Temperature')
ylabel('Enthalpy')
title(' Enthalpy vs Temperature ')
image=getframe(gcf);
imwrite(image.cdata,' H vs T.png')
saveas(2,'enthalpy','jpg')
figure(3)
plot(T,s);
xlabel('Temperature')
ylabel('Entropy')
title(' Entropy vs Temperature ')
image=getframe(gcf);
imwrite(image.cdata,'S vs T.png')
saveas(3,'Entropy','jpg')
cd ..
%Calculation of Molecular Weight
[M]=Mol_Weight(Species_name);
mw=sprintf('%s Molecular weight = %f',Species_name,M);
disp(mw);
end
Functions
Specific Heat
function [cp]=specific_heat(b_1,b_2,b_3,b_4,b_5,b_8,b_9,b_10,b_11,b_12,local_mid_temp,T,R)
if (T>local_mid_temp)
cp=R*((b_1+(b_2.*T)/2)+(b_3.*(T.^2))+(b_4.*(T.^3))+(b_5.*(T.^4)));
else
cp=R*(b_8+(b_9.*T)+(b_10.*(T.^2))+(b_11.*(T.^3))+(b_12.*(T.^4)));
end
Enthalpy
function [h]=Enthalpy(b_1,b_2,b_3,b_4,b_5,b_6,b_8,b_9,b_10,b_11,b_12,b_13,local_mid_temp,T,R)
if (T>local_mid_temp)
h=(R*T).*(b_1+((b_2.*T)/2)+((b_3.*(T.^2))/3)+((b_4.*(T.^3))/4)+((b_5.*(T.^4))/5)+(b_6./T));
else
h=(R*T).*(b_8+((b_9.*T)/2)+((b_10.*(T.^2))/3)+((b_11.*(T.^3))/4)+((b_12.*(T.^4))/5)+(b_13./T));
end
Entropy
function [s]=Entropy(b_1,b_2,b_3,b_4,b_5,b_7,b_8,b_9,b_10,b_11,b_12,b_14,local_mid_temp,T,R)
if (T>local_mid_temp)
s=R*((b_1.*log(T))+(b_2.*T)+((b_3.*(T.^2))/2)+((b_4.*(T.^3))/3)+((b_5.*(T.^4))/4)+b_7);
else
s=R*((b_8.*log(T))+(b_9.*T)+((b_10.*(T.^2))/2)+((b_11.*(T.^3))/3)+((b_12.*(T.^4))/4)+b_14);
end
Molecular Weight
function [M]=Mol_Weight(Species_name)
atomic_mass=[15.999,1.008,12.011,14.007,39.948];
elements=['O','H','C','N','A'];
mol_w=0;
for i=1:length(Species_name)
for j=1:length(elements)
if strcmpi(Species_name(i),elements(j))
mol_w=mol_w+atomic_mass(j);
z=j;
end
end
mol=str2double(Species_name(i));
if(mol>1)
mol_w=mol_w+(atomic_mass(z)*(mol-1));
end
end
M=mol_w;
end
Outputs
O2
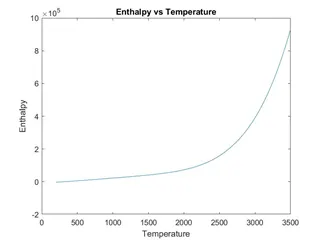
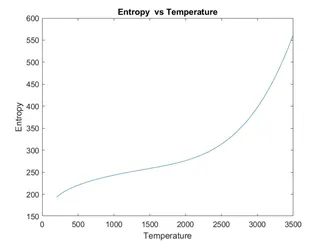
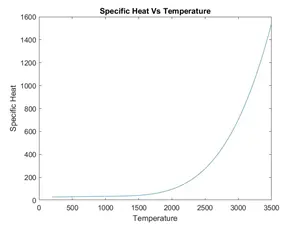
N2
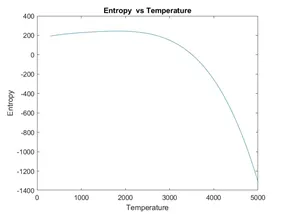
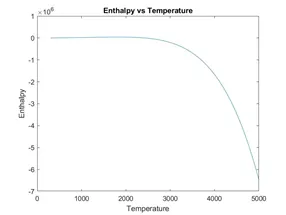
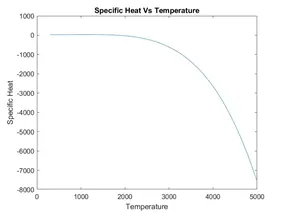
C02
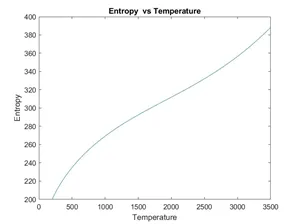
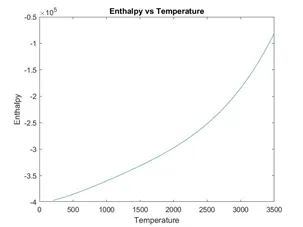
Command Window

Explanation of Code
In the given challenge Nasa Thermodynamic data with file name THERMO.dat was given.We have to read the data from the given file and calculate Cp,H and S.
There are 53 gas species with 14 coefficients for each defined under individual local temperature range.
- The program starts with clear all ,close all and clc.
f1=fopen('THERMO.dat','r');
tline1=fgetl(f1);
The above lines are used to read the data from THERMO.dat and f1 acts as pointer to this file.The next line is executed to neglect the first line of the file.
- %global_temp_line
tline2=fgetl(f1);
gtemp=strsplit(tline2,' ');
global_low_temperature=str2double(gtemp{2});
global_mid_temperature=str2double(gtemp{3});
global_high_temperature=str2double(gtemp{4});
Using tline2=fgetl(f1); we read the next line in the file.
‘gtemp=strsplit(tline2,' ');’ is used to split the above line whenever a space is detected and its stored in a cell array gtemp.Then using ‘str2double’ we convert the string to double data type and store in variables to obtain high ,medium and low global temperature range.
3.A for loop is used to neglect next 3 unwanted lines from the file.
- A for loop from 1 to 53 is initiated since there is 53 elements in the file .The whole file can be divide into 4 lines for each species.First line providing the species name and local temperature range and next three lines providing the coefficients.First the species name is identified and stored in a variable ‘Species_name’.Then local temperature ranges and 14 coefficients of each species is stored into different variables for further calculation.
5.Function cp,h,s are called .The graphs are plotted .
mkdir helps in creating a directory and its run inside the loop.
mkdir(['E:',Species_name]); helps to create directory for each species and give folder name respective ‘Species_name’.imwrite and save as commands are used to write into a folder and save the plots in the folders of each species.cd command is used to change directory of each species.
6.Molecular Weigth is calculated with the function called [M]=Mol_Weight(Species_name); and its stored in array M.
mw=sprintf('%s Molecular weight = %f',Species_name,M)
disp(mw);
The above line are executed to display the molecular weight of each element in the command window.
In the function Mol_Weight(Species_name) we used strcmpi() . It is used to compare the species name with the elements used in the function.This command is case insensitive.