Project 1 - Parsing NASA thermodynamic data
Parsing NASA thermodynamic data
Aim:
- To write a code in MATLAB to parse the NASA thermodynamic data.
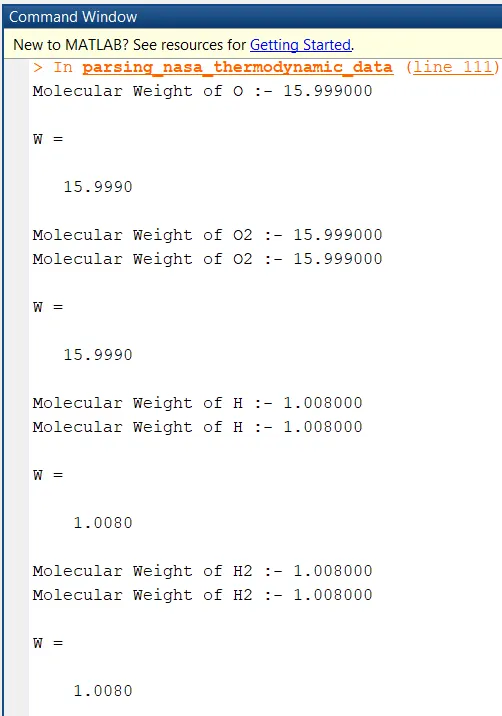
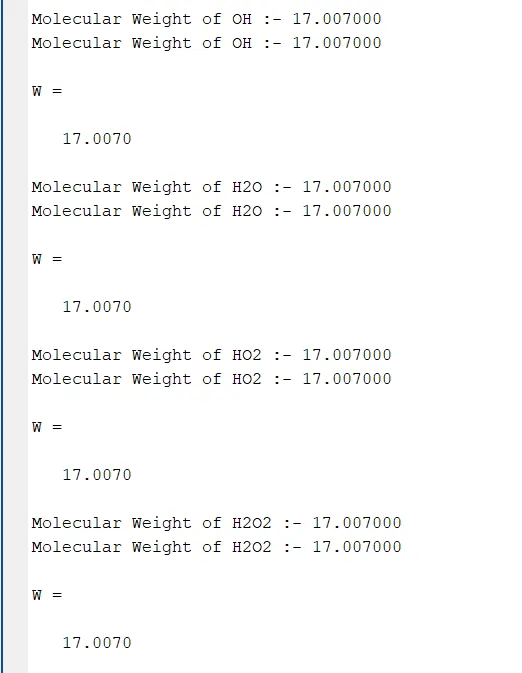
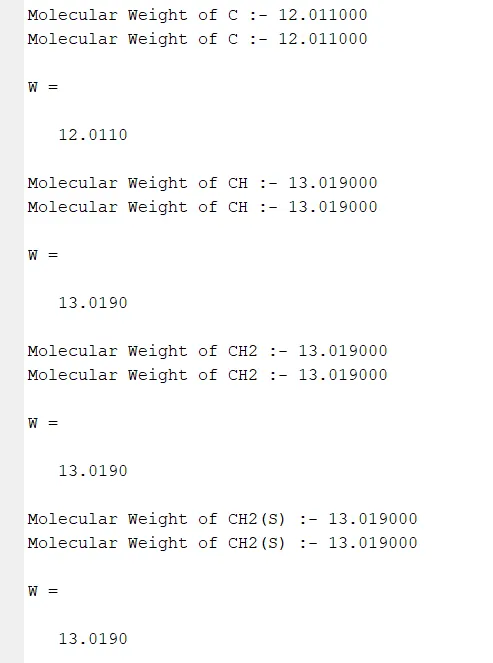
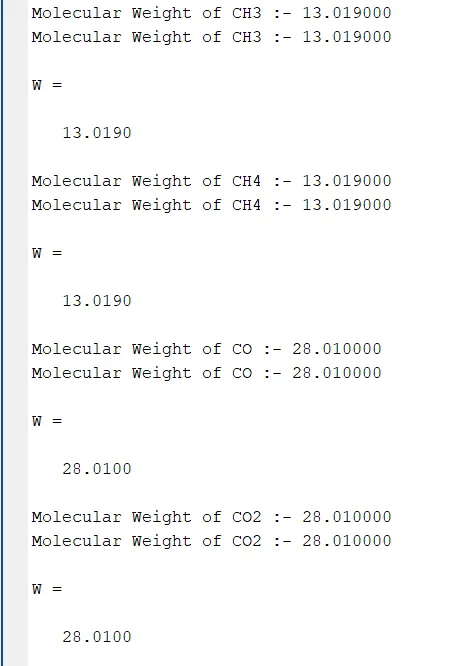
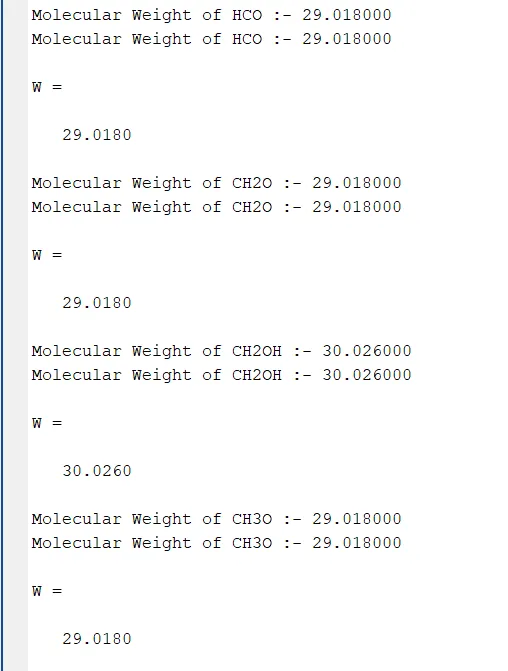
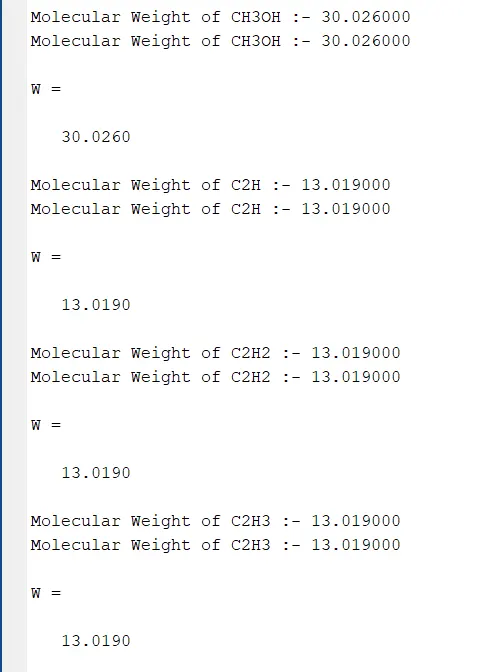
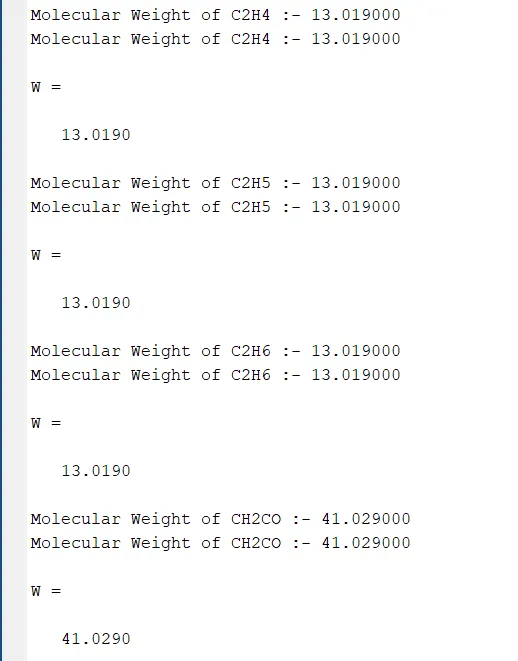
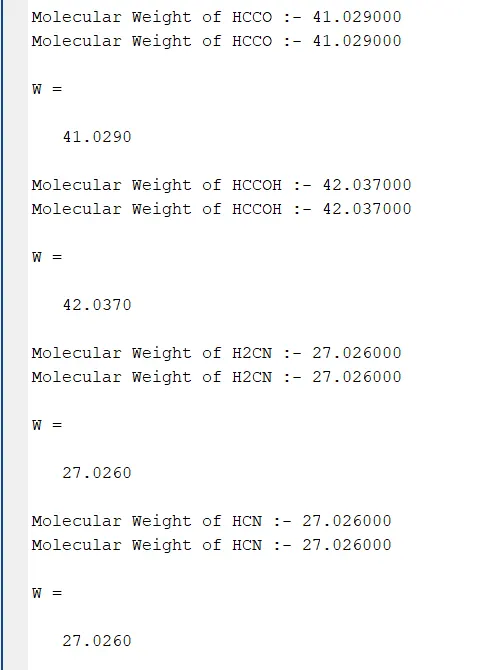
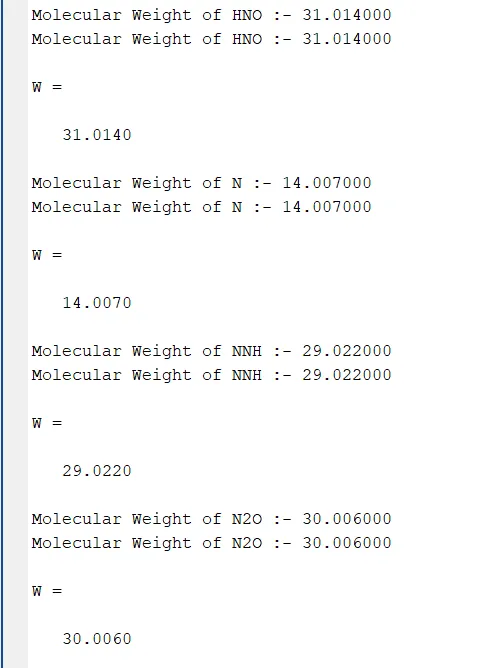
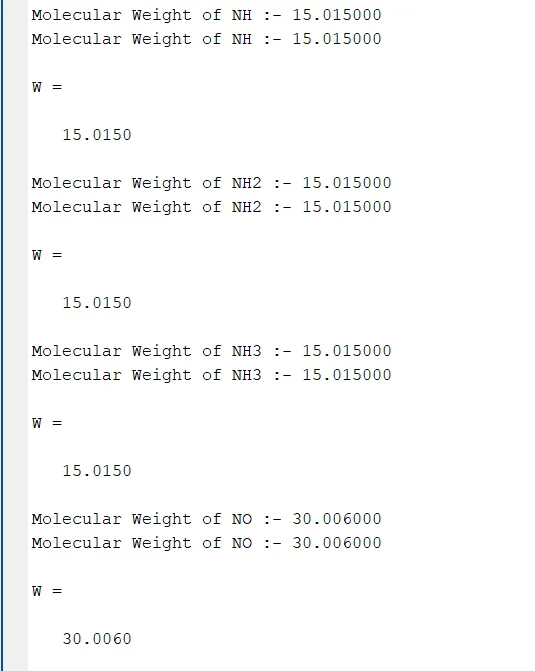
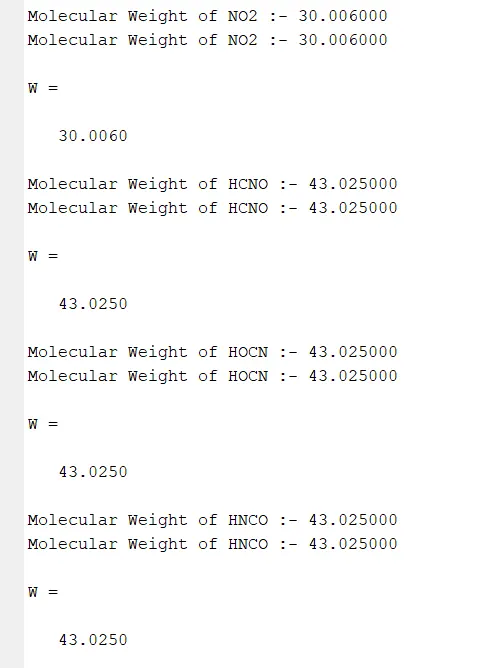
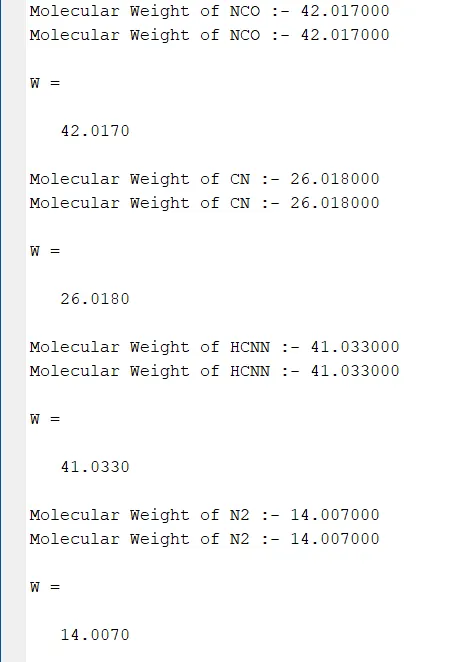
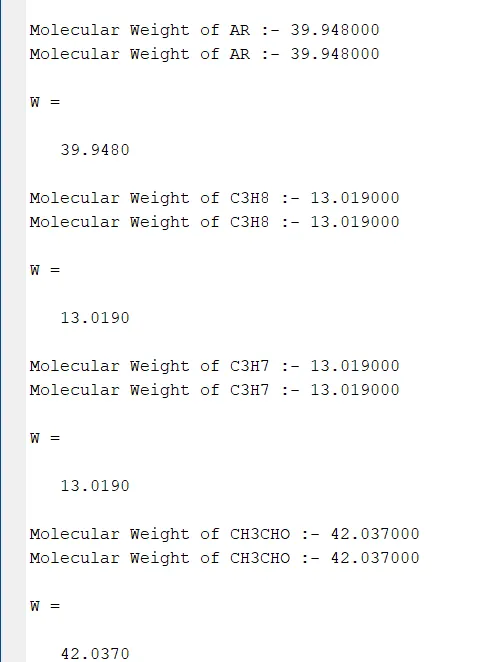
- To calculate the molecular weight of each species and display it in the command window.
- To plot Cp, Enthalpy, and Entropy for local temperature range.
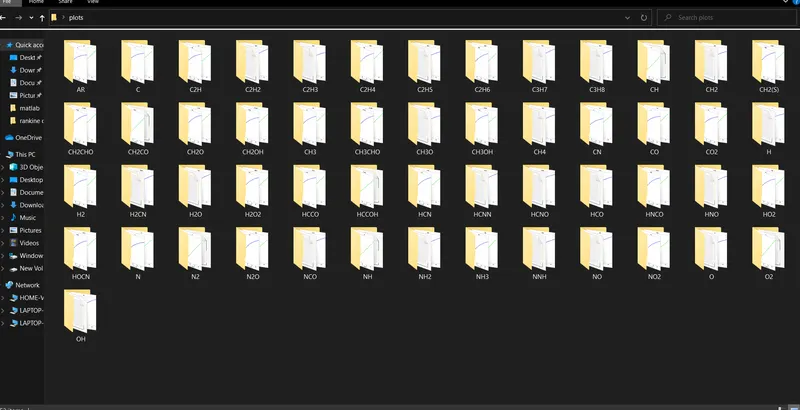
- To save the plot as images with appropriate names and dump them in separate folders for each species with suitable names automatically.
Equations:
The NASA polynomials have the form as shown below.
Cp/R = a1+ a2 T+ a3 T^2+ a4 T^3+ a5 T^4
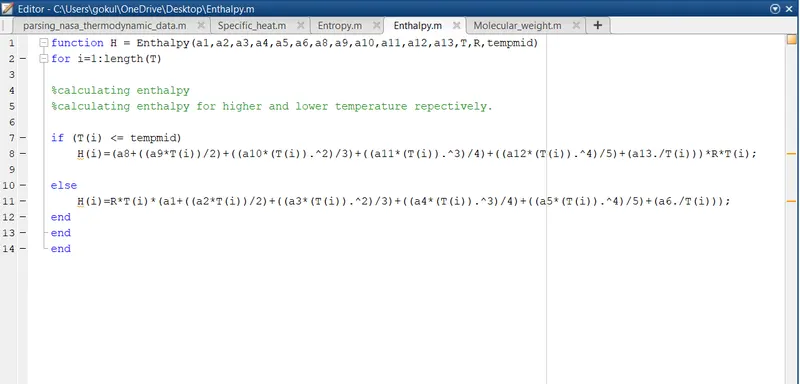
H/RT = a1+a2 T/2+ a3 T^2/3+ a4 T^3/4+a5 T^4/5+ a6/T
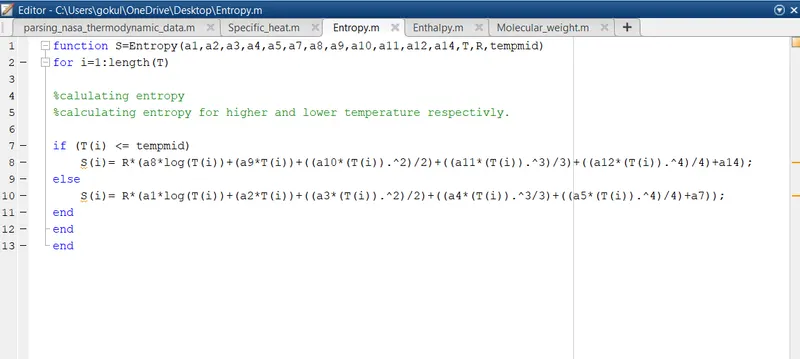
S/R =a1 ln T+ a2 T+ a3 T^2/2 + a4 T^3/3+ a5 T^4/4 +a7
Where R is the universal gas constant, T is the temperature.
Objectives:
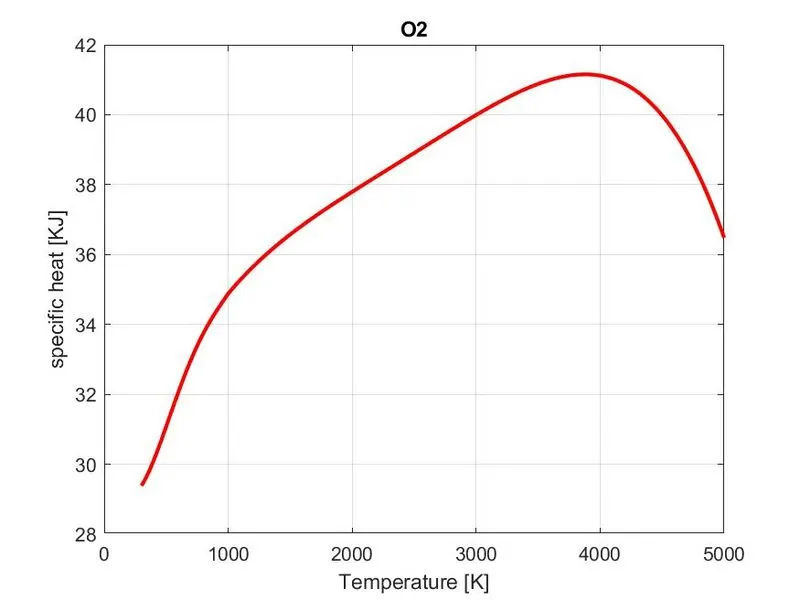
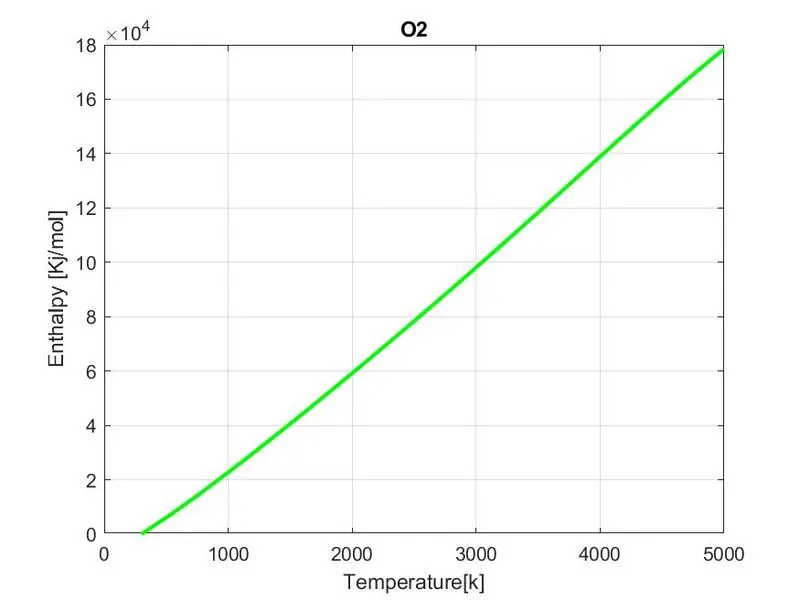
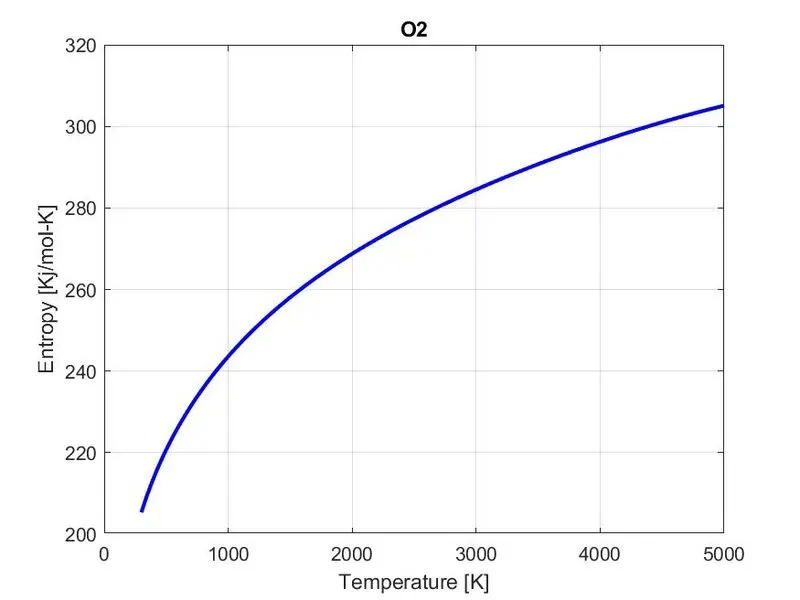
1. plots for O2
- variation of specific heat with temperature.
- variation of Enthalpy with temperature.
- variation of Entropy with temperature.
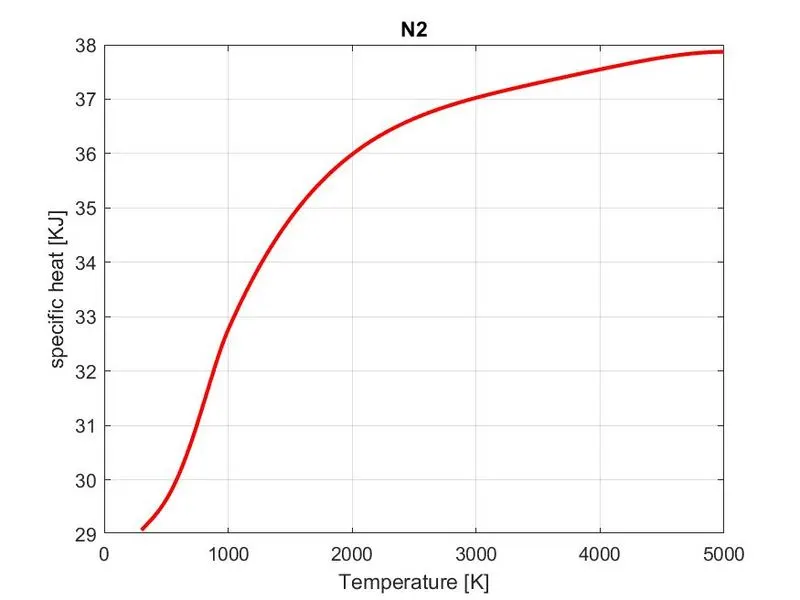
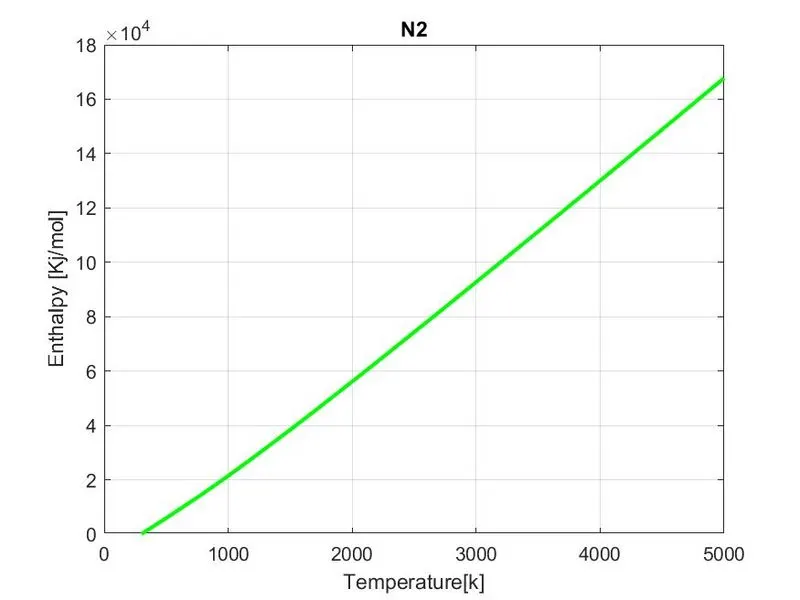
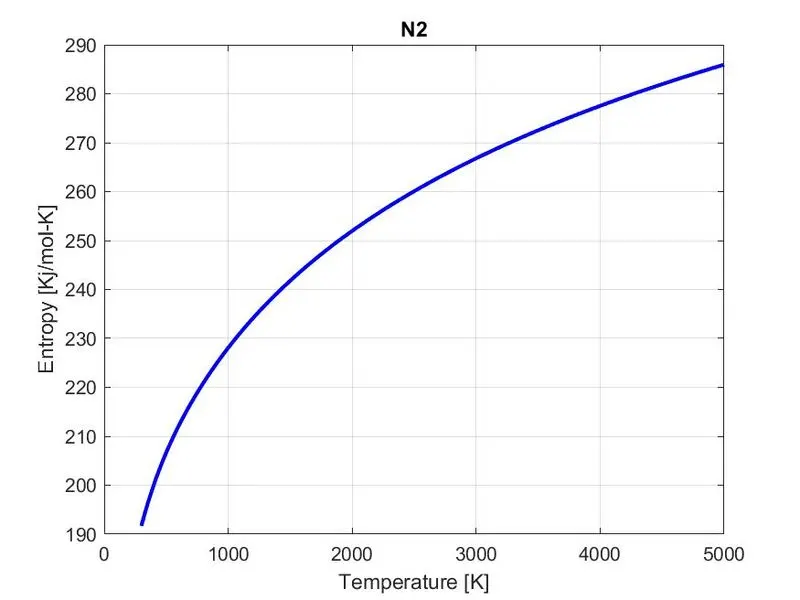
2. Plots for N2
- variation of specific heat with temperature.
- variation of Enthalpy with temperature.
- variation of Entropy with temperature.
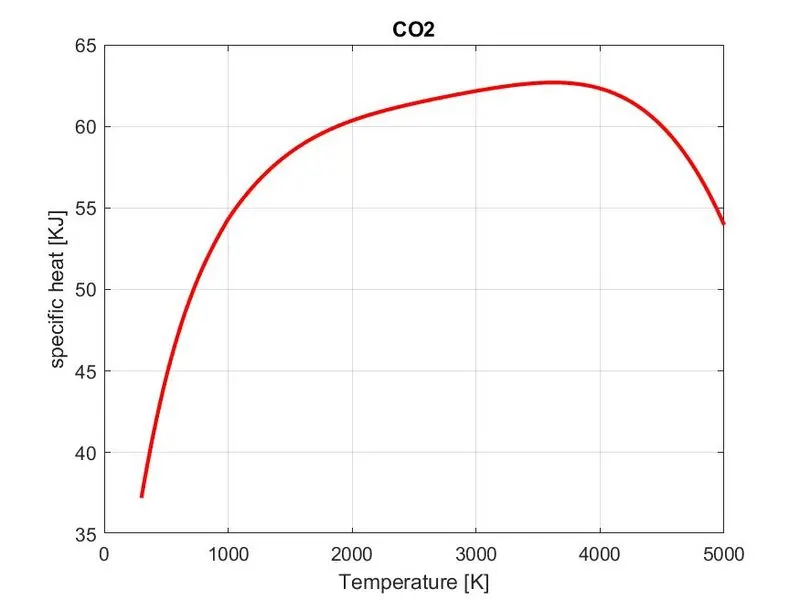
3. Plots for CO2
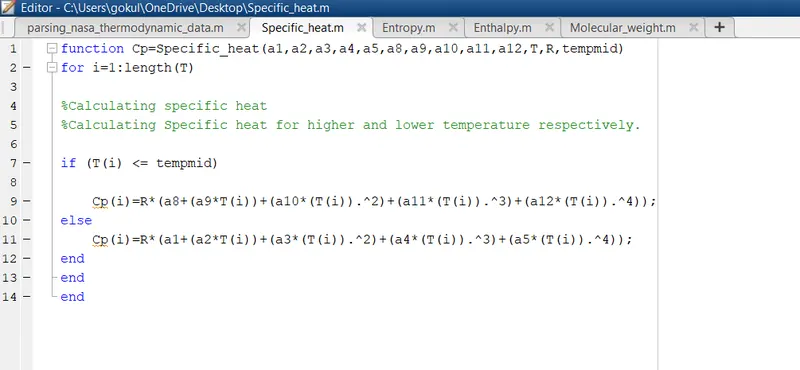
- variation of specific heat with temperature.
- variation of Enthalpy with temperature.
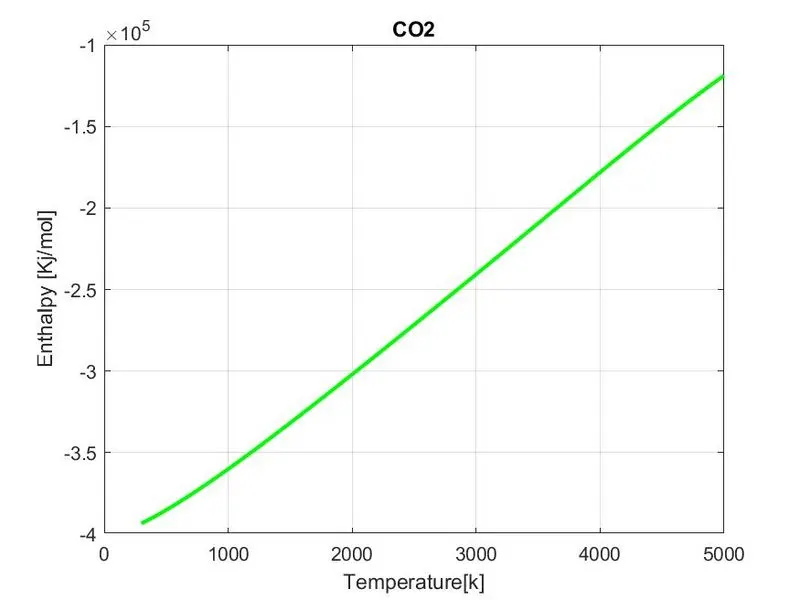
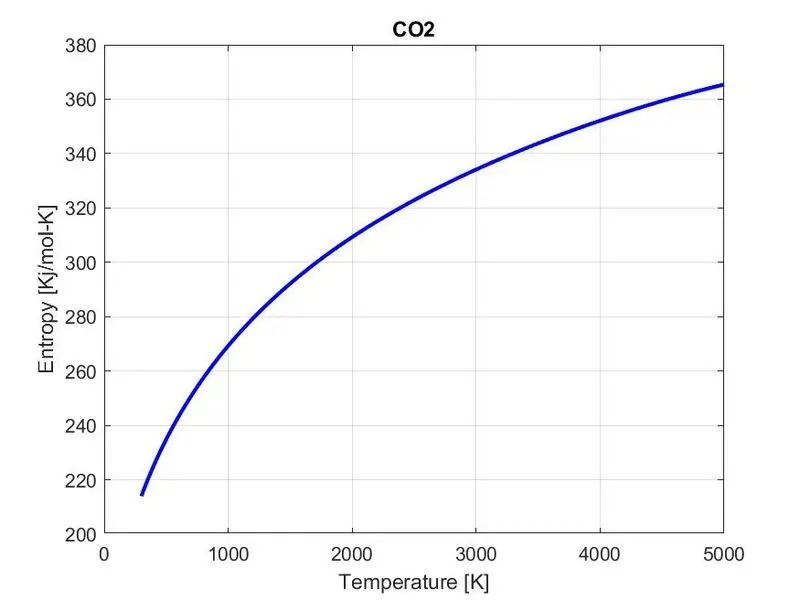
- variation of Entropy with temperature.
1.Code for Specific heat
2. Code for Entropy
3. Code for Enthalpy
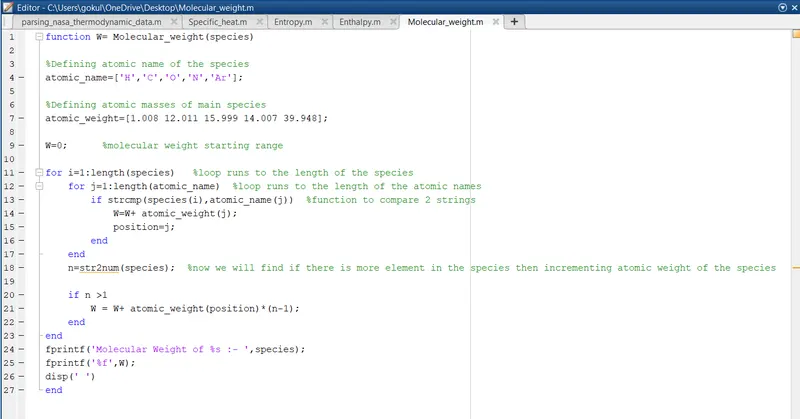
4. Code for Molecular weight
Procedure:
- Initially, the given data file is read with help of fopen command with the reading function. Then successive lines in the data file are extracted for the global temperature range using fgetl command.
- The desired input from the user is stored as a string.
- The input string is then compared with the molecule available in the data file pile using strcmp. If a match is obtained, respective coefficients are extracted from the data file using fgetl command. Different coefficients in a particular line are sorted out by specifying the place in that line. Similarly, the local temperature range for the input molecule is also extracted from the data file.
- In order to get the molecular weight, the function for calculating the molecular weight is called and stored to a variable and is displayed.
- Now, for the thermodynamic property values(Cp, S, H), the associated functions are called.
- mkdir command is then used in order to create a directory to store the output figures.
- Now for the different thermodynamic property values, associated Cp vs T, S vs T, H vs T plots are created.
- The current folder is defined where the figure should be stored and save as a command is used to store the figure t that particular folder created.
- The current folder is again defined to make the directory back to the parent folder and all the open files are close with fclose command.
Errors:
1.
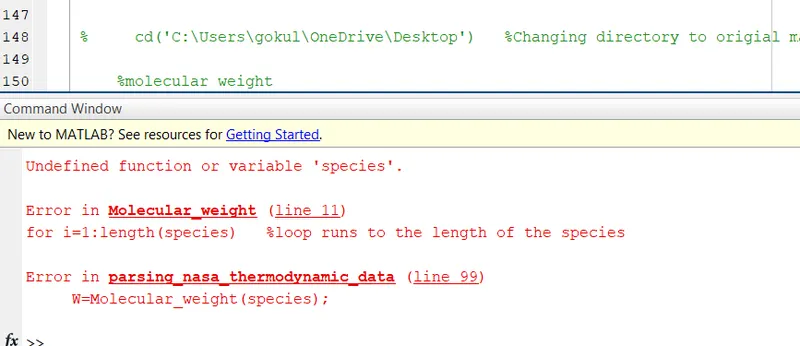
syntax error- In molecular weight subfunction variable 'species' actually starting small letter, mistakenly put the capital letter.
2.
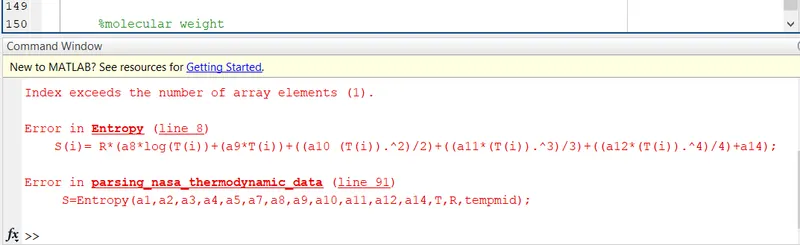
logical error- the solution is to put multiplication element after a10.
Conclusion:
- Using MATLAB code, the necessary coefficients required to evaluate various thermodynamic parameters for different species are extracted from NASA thermodynamic data file.
- The specific heat, Enthalpy, and Entropy for all species are calculated and plotted against the local temperature range.
- The Molecular weight is calculated for all the species.
Output -
Screenshot of the window where all the folders are saved
The molecular weight of all the species.