Project 1 - Parsing NASA thermodynamic data
AIM : Parsing a file that contains NASA thermodynamics data using MATLAB.
OBJECTIVE :
- Write a function that extracts the 14 co-efficients and calculates the enthalpy, entropy and specific heats for all the species in the data file.
Equations of Specific heat, Enthalpy(H) and Entropy(S) are as under;

In this, The first 7 coefficients are HIGH-temperature coefficients and the second 7 coefficients are LOW-temperature coefficients. Also use the Local Temperature Ranges which is unique for each individual species, not the Global Temperature Range.
- Calculate the molecular weight of each species and display it in the command window.
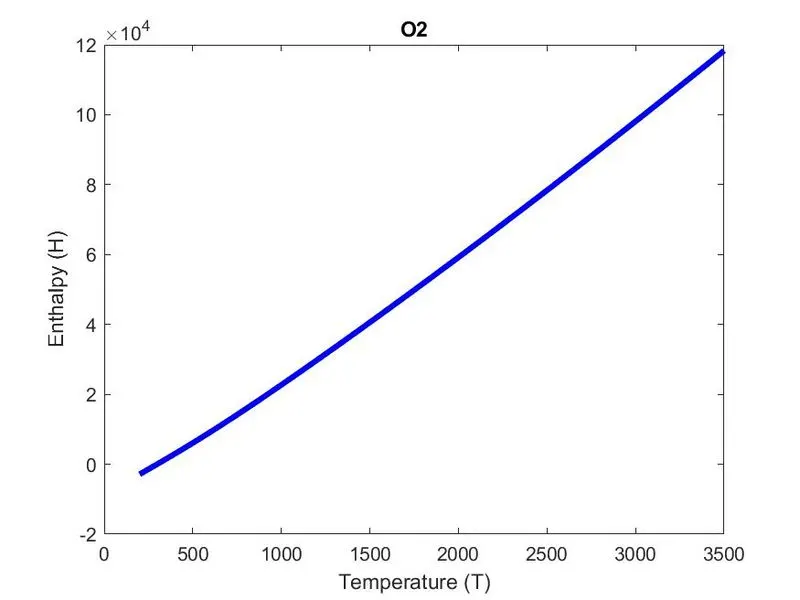
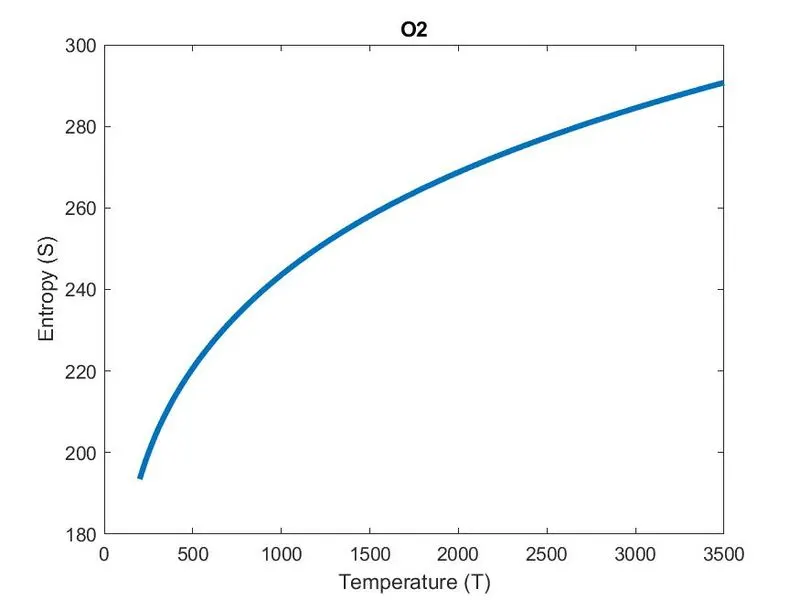
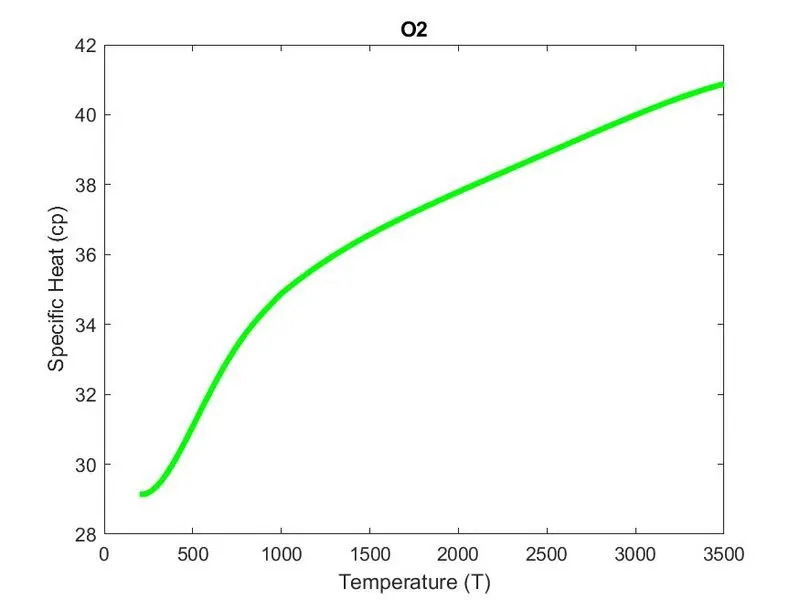
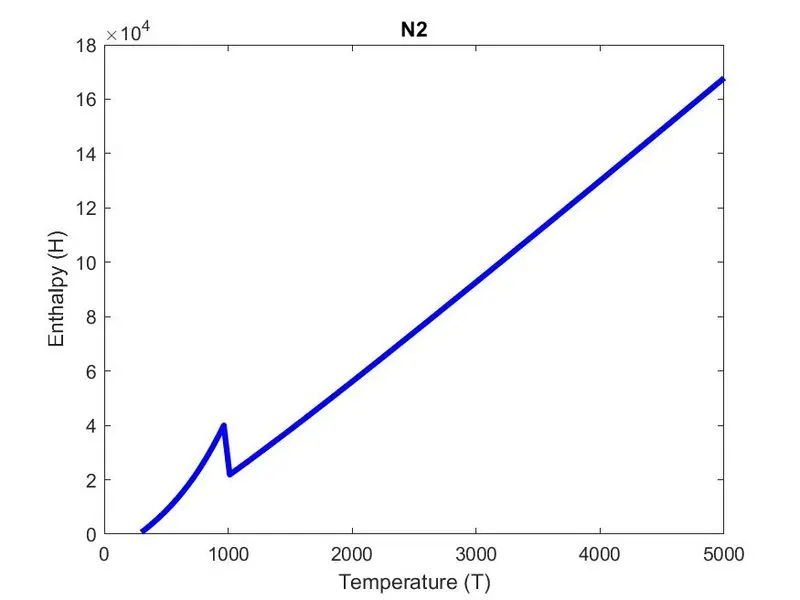
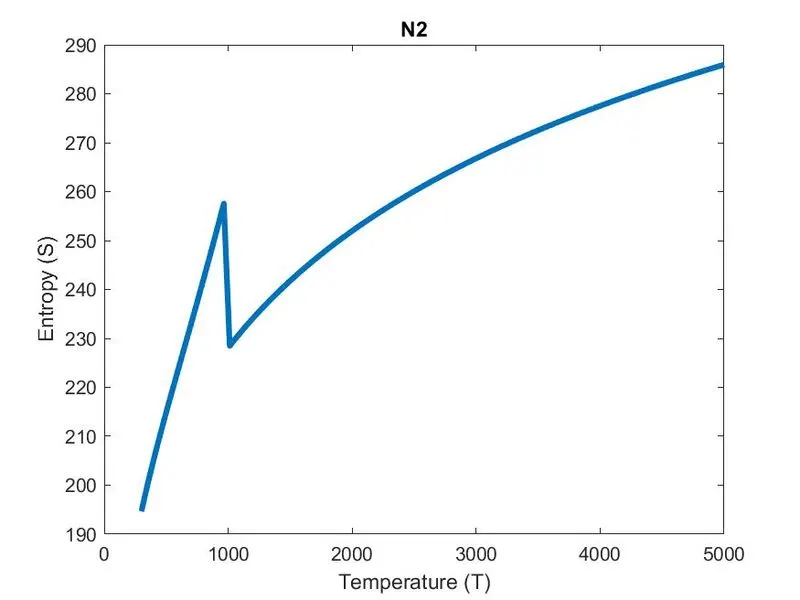
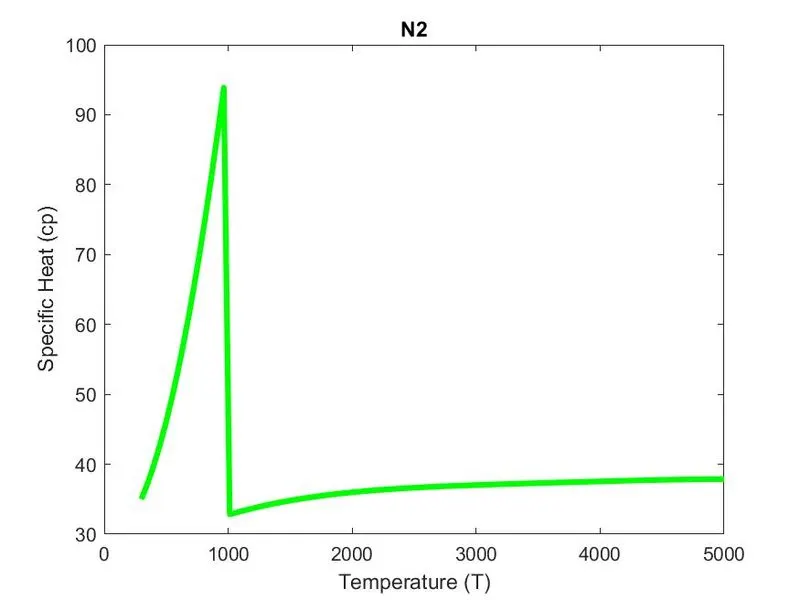
- Plot the Cp, Enthalpy and Entropy for the local temperature range (low temperature : high temperature) specific for each species.
- Save the plots as images with appropriate names and dump them in separate folders for each species with suitable name. All these should be generated automatically.
- The main program that you will submit will just take the "THERMO.dat" file as an input and generate Cp, H and S plots.
- Screenshot of the window where all the folders are saved.
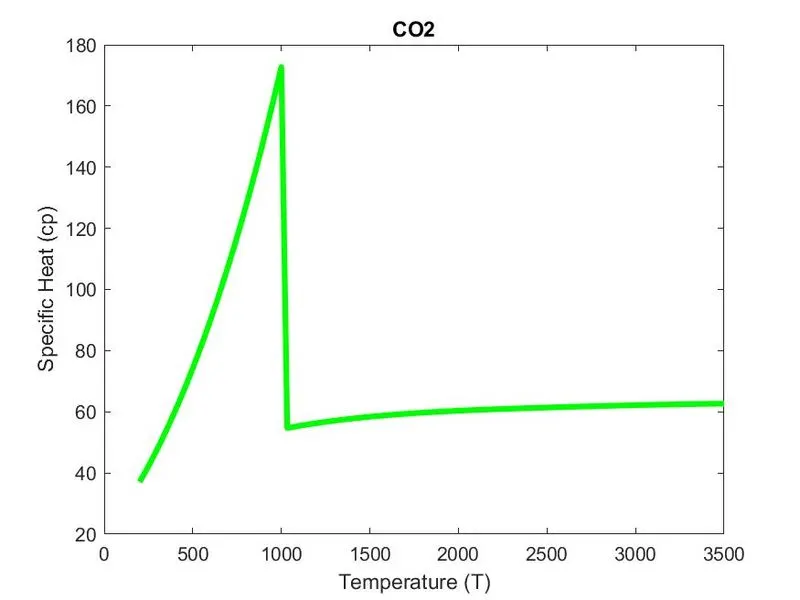
- Plots for o2, N2 and Co2 species (your program should be case insensitive, if it is going to take the species name as an input).
THEORY :
- PARSING :
To parse, in computer science, is where a string of commands – usually a program – is separated into more easily processed components, which are analyzed for correct syntax and then attached to tags that define each component. The computer can then process each program chunk and transform it into machine language.
What is Parsing ?
To parse is to break up a sentence or group of words into separate components, including the definition of each part's function or form. The technical definition implies the same concept.
Parsing is used in all high-level programming languages. Languages like C++ and Java are parsed by their respective compilers before being transformed into executable machine code. Scripting languages, like PHP and Perl, are parsed by a web server, allowing the correct HTML to be sent to a browser.
Here with the given data we are finding out enthalpy, entropy and specific heat.
- ENTHALAPY :
Energy can neither be created nor be destroyed. It can only be transformed into various forms which are interchangeable. For instance, tides are harnessed to convert tidal energy into electrical energy. Similarly, we rotate a turbine to convert the mechanical energy into electrical energy. Also, this electrical energy is further converted into light or heat energy by lighting a bulb or an appliance.
Simultaneously, enthalpy is one such term that describes the amount of change in energy during the process of conversion. Students have to understand enthalpy definition and derivation for a comprehensive study of the same. Therefore, to make it easier and more straightforward, here is a brief explanation along with relevant diagrams and examples along with mathematical equations.
Enthalpy - Definition :
Enthalpy is the quantity of heat in a system. This heat is utilised in the occurrence of a process. Any heat-related system is called a thermodynamic system, so enthalpy is a thermodynamic quantity.
Besides, it should be noted that any system comprises of multiple participants. Each of these participants has its pressure and volume. As we already know, the product of pressure and volume of a specific system is constant.
This enthalpy is equal to the sum of internal energy of such a system with the constant.
You need to understand that the forms of energy get changed, but enthalpy remains constant. For example, when water freezes into ice, some amount of energy is spent in doing the work, which is called enthalpy.
As a result, scientists are often found to be calculating enthalpy instead of energy. You should be cautious about learning both the terms. Although they seem to be equal, they are actually not.
Enthalpy - Mathematical Equation : ΔH = ΔE + Δ(PV) ;
Similar to any other scientific theory, enthalpy also has a mathematical formula. It shows the equation of enthalpy definition and derivation with appropriate labels.
You should note that Δ (delta) is a symbol that represents a change in some quantity. Herein the change in internal energy is expressed through ΔU.
Also, consider another essential aspect; that of energy loss due to it being is used up for work. This amount of energy shall be deducted from the amount of heat added to the system to find the actual amount of energy change.
These are basic terms and expressions, which will help in understanding the overall concept with clarity.
It is often observed that students confuse both these terms - entropy and enthalpy. Also, they often use it interchangeably. However, the ground reality is entirely different. Both these terms are hugely different.
Refer to the table below for a clear comparison -
|
Sl. No. |
Entropy |
Enthalpy |
|
1. |
It is a property that helps in the measurement of the movement of molecules. |
It is a type of energy that is composed of both internal energy and energy flow. |
|
2. |
It is considered only under limitations or controlled conditions. |
It can be measured or is applicable at normal or regular conditions. |
|
3. |
The unit of measurement is Joule per Kelvin. |
The measuring unit is Joule per mole. |
|
4. |
A thermodynamic system is likely to favour a maximum amount of entropy in it. |
Any thermodynamic system will favour only a minimum amount of enthalpy. |
Now, that you know the difference, it is quite clear that enthalpy definition and derivation is a form of energy. So, when the internal energy changes, it is called enthalpy during constant pressure.
As mentioned above, there are other properties, such as pressure and volume. Let us dig deeper into those terminologies to understand enthalpy.
Enthalpy - Relation with Volume and Pressure :
Herein, let us consider a situation where there is no work done. In terms of Chemistry, we are considering a chemical reaction as a system which is capable of performing a certain action. However, for the sake of understanding, we are acknowledging that no work is being done.
Hence, if any amount of energy is emitted or absorbed from or by the system, there would be an equal amount of change in internal energy. It is observed that this kind of reaction is possible only when the volume and pressure are constant.
Nevertheless, the experiments are conducted in open flasks, resulting in exchange of heat within and outside the surrounding. This further leads to the concept of work done and enthalpy.
You should note that work done implies both ways; it is not just surrounding works on the system or vice versa. Since a specific amount of energy has been spent on doing work, the heat absorbed or emitted is not equal to internal energy.
Thus, internal energy equals the sum of work done and the product of volume and pressure. The enthalpy definition and derivation is represented as -
H = E + PV
Where H = enthalpy
E = internal energy
P = pressure
V = volume
Therefore, now if we want to represent the changes in energy levels or enthalpy, we can write it as -
ΔH = ΔE + Δ(PV)
With this, you should note the following two points -
-
At constant volume, the heat emitted or absorbed during a reaction equals the internal energy of a system.
-
At constant pressure, heat emitted or absorbed during a chemical reaction equals the enthalpy of the system.
- ENTROPY :
What is Entropy?
The Entropy is the measure of the disorder of the energy of a collection of particles. This idea is derived from Thermodynamics, which explains the heat transfer mechanism in a system. This term comes from Greek and means “a turning” point. It was first coined by Rudolf Clausius, a German physicist.
He documented a precise form of the Second law of thermodynamics through entropy. It states that any spontaneous change in an isolated system for irreversible reaction always leads towards the increasing entropy. For example, when we put a block of ice on a stove, these two make an integral part of a single isolated system. Thereby the ice melts and entropy increases.
Since all the spontaneous processes are irreversible, we can say that the entropy of the universe is increasing. Moreover, it can be concluded that more energy will be unavailable for work. Due to this, it is said that the universe is “running down”.
The S.I unit of entropy is Joules per Kelvin. Also, it is expressed as Delta S, and following is the equation.
ΔSsystem = Qrev / T
Where S denotes the change in entropy, Q denotes reverse of heat and temperature is represented by T in Kelvin scale.
Absolute Entropy ;
It is a related term and is expressed by S. It is derived from the third law of thermodynamics. The entropy is zero at absolute zero, and it is made so by adding a constant.
Entropy Characteristics :
-
It increases with mass.
-
In the course of vaporisation, melting and sublimation, entropy increases.
-
When liquid or hard substances dissolve in water, Entropy increases.
-
In contrast, when gas is dissolved in the water, it decreases.
-
In malleable solids such as metals, entropy is higher.
-
On the other hand, entropy is lesser in brittle and hard substances.
-
As chemical complexity increases, the entropy increases as well.
Calculation of Entropy :
In an isothermal reaction, the entropy change is defined as Delta S= the change in heat (Q) divided by absolute temperature or T. The equation as follows
Delta S= Q/T.
For a reversible thermodynamic process, Entropy can be expressed in calculus as an integral from the initial state of a process to its final state that is dQ/T. More specifically, entropy is a measure for probability and molecular randomness of a macroscopic entity. In a system which can be presented by variables, they can predict a certain number of changes. If each configuration is probable equally, then the entropy is the natural logarithm of the total number of changes, multiplied by Boltzmann's constant.
S = kB ln W
Where kB is Boltzmann's constant, S is entropy, ln is natural logarithm, and W denotes the number of possible states.
Note: Boltzmann's constant= 1.38065 × 10⁻²³ J/K.
Enthalpy and Entropy Relation :
Also, enthalpy entropy and free energy are closely related to each other as both entropy and enthalpy are combined into a single value by Gibbs free energy. This free energy is dependent on chemical reaction for doing useful work. This relation is first stated in 1070’s by Josiah Willard Gibbs.
It is expressed by G. The equation is as follows -
G=H-TS
Where H is enthalpy, T is temperature and S is entropy. If we subtract the product of T and S from Enthalpy, we get Gibbs free energy.
In constant temperature,
ΔG = ΔH – TΔS
The direction of a chemical reaction is determined by Delta G. For a spontaneous process, G is negative, and for a non-spontaneous process, G is positive.
SPECIFIC HEAT:-
-
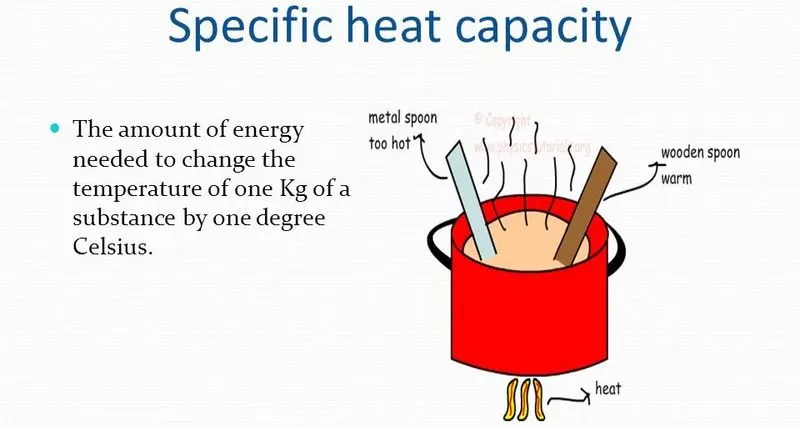
Specific Heat Capacity:-The specific heat capacity (symbol cp) of a substance is the heat capacity of a sample of the substance divided by the mass of the sample. Informally, it is the amount of energy that must be added, in the form of heat, to one unit of mass of the substance in order to cause an increase of one unit in temperature. The SI unit of specific heat is joule per kelvin and kilogram, J/(K kg).
The below given is the formula that we use to calculate Cp in this project.
UNIVERSAL GAS CONSTANT (R) :-
- The gas constant is a physical constant denoted by R and is expressed in terms of units of energy per temperature increment per mole.
- The gas constant value is equivalent to Boltzmann constant but expressed as the pressure-volume product instead of
energy per increment of temperature per particle. - It's value is R=8.314 J/Kg-K.
Procedure with step by step explanation :
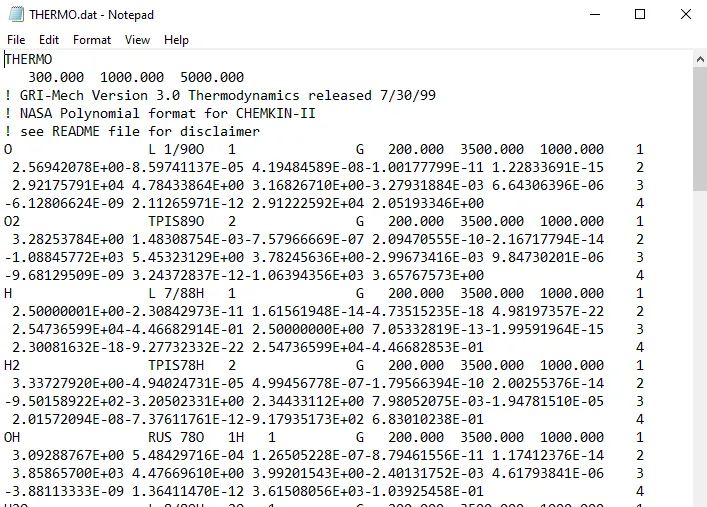
Firstly , we need a data file which contains all the data that we need to parse and make sure that we have create function and matlab programme in the same folder where this data file is located.or else it will throw an error.
f1 = fopen('THERMO.dat','r');        %Open file, or obtain information about open files
fgets(f1);                           %reads 1st line
G_temp = fgets(f1);                  %reads second line which involves temperatures
A = strsplit(G_temp,' ');            %splitting the strings in temp variable into pieces and assigning to variable 'A'
f1=fopen('THERMO.dat','r')By this command we will open the file with its specific name which is ‘THERMO.dat’ in .dat format and ‘r’ symbolise to read that file .It means we have a file with some name and we want to open that file in our matlab software to read that data for some changes or for other additional help then this all all will be done by fopen command and with ‘r’ symbol coding notation .If we want to create any file then we will use ‘w’ symbol coding notation which refers ‘w’ to write.fgetl(f1): fgetl command is for taking the line and fgetl(f1) means taking the line from f1 file.Once again typing code of fgetl(f1) refers taking second line from file f1.So similarly we can use this command so many times as same as the number of lines to take from files in sequence.So in our coding first five lines are header related line l1 to l5 which are not generally our area of focus.A = Strsplit(G_temp,' ')strsplit refers to the string split and ' ' is a string splitter. It means here is that the line l6 which is in string format will be splitted by strsplit command and this whole splitting or cutting of string will occur where string splitter will be present which is a space in string line and which is represented in coding by ' ' .These splitted part are stored in B variable element.
%%%%%    --------------     S P E C I E S    -------------------   %%%%%
for i=1:53

S = fgets(f1);  %reads 6th line and assigned to variable "species" for considering the line
species = strsplit(S,' ');
N_of_species{i} = species{1}; %Name of the species

loc_low_temp = str2num(species{end-3});
loc_mid_temp = str2num(species{end-1});
loc_high_temp = str2num(species{end-2});
Here we have asigned the variable S to 6th line which contains species name and later we will split the line to get the data seperately,since this the first species name we will use it for loop and run it for 53 times since we have 53 species in the data file,so when we mention N_of_species{i} = species{1}; which assigns all the species extracted with id number .
later, we seperate the temperature data in particular local temperature data which is in string format conerted to number with command str2num as shown above,since we have three temp values i.e., low,medium,high temp we will assign to three varialbler names as
loc_low_temp = str2num(species{end-3});loc_mid_temp = str2num(species{end-1});loc_high_temp = str2num(species{end-2});
Extracting 14 co-effiecients values :
Now we will be writing line of codes that will seperate coefficient values and we will be assigning them to the variable with coeffiecient names that is a1,a2,a3,a4,..............a14.
Remember before we have read 6 lines of ther data file ,now we have 7th line to read wich have coeffiecient values from a1 to a5. so we already knew that fgetl command helps in the same way the line 7,8,9 will have a1 to a5 & a6 to a10 & a11 to a14 values whic we will sewperate based on the position value of E in the decimal values.
%  2.56942078E+00-8.59741137E-05 4.19484589E-08-1.00177799E-11 1.22833691E-15    2
line_1 = fgets(f1);
CL1 = strfind(line_1,'E');
a1 = str2num(line_1(1:(CL1(1)+3)));                    % STORES VALUE   2.56942078E+00
a2 = str2num(line_1(CL1(1)+4:(CL1(2)+3)));             % STORES VALUE  -8.59741137E-05
a3 = str2num(line_1(CL1(2)+4:(CL1(3)+3)));             % STORES VALUE   4.19484589E-08
a4 = str2num(line_1(CL1(3)+4:(CL1(4)+3)));             % STORES VALUE  -1.00177799E-11
a5 = str2num(line_1(CL1(4)+4:(CL1(5)+3)));             % STORES VALUE   1.22833691E-15

%  2.92175791E+04 4.78433864E+00 3.16826710E+00-3.27931884E-03 6.64306396E-06    3
line_2 = fgets(f1);
CL2 = findstr(line_2,'E');
a6 = str2num(line_2(1:(CL2(1)+3)));
a7 = str2num(line_2(CL2(1)+4:(CL2(2)+3)));
a8 = str2num(line_2(CL2(2)+4:(CL2(3)+3)));
a9 = str2num(line_2(CL2(3)+4:(CL2(4)+3)));
a10 = str2num(line_2(CL2(4)+5:(CL2(5)+3)));

% -6.12806624E-09 2.11265971E-12 2.91222592E+04 2.05193346E+00                   4
line_3 = fgets(f1);
CL3 = findstr(line_3,'E');
a11 = str2num(line_3(1:(CL3(1)+3)));
a12 = str2num(line_3(CL3(1)+4:(CL3(2)+3)));
a13 = str2num(line_3(CL3(2)+4:(CL3(3)+3)));
a14 = str2num(line_3(CL3(3)+4:(CL3(4)+3)));
to understand how the splitting happens and how the variables has been asssined to respective values without any errors we will take first two coeffcients first
line_1 = fgets(f1);
from the above line we already guessed that it stores 7th line of the data file to line_1 variable name,
later we are using this name to find the position of E in the line and stores them in array format to variable CL1 ,
CL1 = strfind(line_1,'E');
from the picture below we have seen that matlab stores the position values of E in array.

now we know the positional values of E in line 7.now , its time to asssign the values with the help of str2num command which helps in converting strings to numbers here we are telling matlab to start from the initial number to 1st postion of E and add 3 extra values line_1(1:(CL1(1)+3)) which return a value of 2.56942078E+00 here +00 are the extra three position we have added to complete the value without getting errors for decimal values .a1 is the variable name we have assigned and for a2 we start from the last postion with additional 4 to second postion of E value in CL1 and add other extra three postions to E and store it in a2 variable. we can see the code format and what values it hjas been assigned in comments .
a1 = str2num(line_1(1:(CL1(1)+3)));                    % STORES VALUE   2.56942078E+00
a2 = str2num(line_1(CL1(1)+4:(CL1(2)+3)));             % STORES VALUE  -8.59741137E-05
after assigning all the vales to their respective coewffiecient variables we will proceed assigning temperature and gas constant values which are required for formulating the spedcific heat (Cp),Enthalapy(H) and Entropy(S1).The polynomial function below specifies the values for spedcific heat (Cp),Enthalapy(H) and Entropy(S1) and additionally we have T and R whcih are temperature ranges and universal gas constant which is 8.314.
The function formulation is coded below :
T = linspace(loc_low_temp,loc_high_temp,100);

R = 8.314;  % UNIVERSAL GAS CONSTANT (J/mol*K)

for j = 1:length(T)
    if T(j) > loc_mid_temp

   cp(j)=(a1+a2.*T(j)+a3.*T(j).^2 +a4.*T(j).^3+a5.*T(j).^4 ).*R;
   H(j)=(a1+a2.*T(j)./2+a3.*T(j).^2/3+a4.*T(j).^3/4+a5.*T(j).^4/5+a6./T(j)).*R.*T(j);
   S1(j)=(a1.*log(T(j))+a2.*T(j)+a3.*T(j).^2/2+a4.*T(j).^3/3+a5.*T(j).^4/4 + a7).*R;

   else

   cp(j)=(a8+a9.*T(j)+a10.*T(j).^2+a11.*T(j).^3+a12.*T(j).^4).*R;
   H(j)=(a8 + a9.*T(j)/2+a10.*T(j).^2/3+a11.*T(j).^3/4+a12.*T(j).^4/5+a13./T(j)).*R.*T(j);
   S1(j)=(a8.*log(T(j))+a9.*T(j)+a10.*T(j).^2/2 +a11.*T(j).^3/3+a12.*T(j).^4/4+a14).*R;

    end

end
In given NASA file for each species like molecules O2 (oxygen), N2 (nitrogen), CO2 (carbon- die-oxide) etc have fourteen coefficient. The FIRST 7coefficients are at HIGH-temperature coefficients and the SECOND 7 coefficients are at LOW-temperature coefficients. So we will determine these thermodynamic properties at low temperature as well as high temperature coefficient.We will also code for making directory for storing the specific plots for each species with its name. All these will be generated automatically by coding as shown below
%PLOTTING Temperature vs Entropy

    figure(1)
    plot(T,S1,'linewidth',3)
    title(N_of_species{i})
    xlabel('Temperature (T)')
    ylabel('Entropy (S)')

%PLOTTING Temperature vs Enthalpy

   figure(2)
    plot(T,H,'linewidth',3,'color','b')
    title(N_of_species{i})
    xlabel('Temperature (T)')
    ylabel('Enthalpy (H)')

%PLOTTING Temperature vs Specific Heat

   figure(3)
   plot(T,cp,'linewidth',3,'color','g')
        title(N_of_species{i})
    xlabel('Temperature (T)')
    ylabel('Specific Heat (cp)')

    % creating 53 species folders under main folder of name "N_of_species" and saving plots

     mkdir (N_of_species{i});
     cd(N_of_species{i});
     saveas(1,'entropy.jpg')
     saveas(2,'enthalpy.jpg')
     saveas(3,'specific heat.jpg')
     cd .. % ../	One level up from the current folder which means after creating species folder it direct back to main folder and creates another species folder
we create an Molecular_weight function MM and assigning species input to that,then define the main element of all 53 species in an array atomic_name that are ['H' ,'C' , 'N' , 'O' , 'A' ,'S'].Then by taking above main elements we will create there atomic_wieght that are [1 , 12 , 14 , 16 , 40 , 32 ].Then we will assign molecular starting range MM To zero and then create an for loop condition which runs to the length of the species and an another nested for loop is created which runs to the length of the string atomic_name.
Then we will create an condition using if condition and use strcmp command to compare the species and atomic_name strings to calculate molecular masses if by comparison both string found same then we will assign its molecular weight.
Now, we will string to the number using str2num command assign to n. Then we run an condition of if loop to find weather the species contains more than one element if there are more then 1 elements that is n>1 then we will increment the atomic weight by the multiplication of position and n-1 to the atomic_weight array
if n>1 MM = MM + Atomic_weight(u)*(n-1);
%code for molecular mass
function MM = molecular_mass(species_name) %Function take N_of_species as input and give MM as output

species = upper(species_name); %species stored in a string


elements = ['H' ,'C' , 'N' , 'O' , 'A' ,'S']; %Element array is used to stored species_name

Atomic_weight = [1 , 12 , 14 , 16 , 40 , 32 ];%Atomic weight of each element is stored in array called Atomic_weight

MM = 0 ; %Molecular weight  initially set to 0.

for i = 1:length(species_name) %for loop is used to run species_name
    for j = 1:length(elements) %Is used to run entire length of elements
        if strcmp(species(i),elements(j)) %strcmp command is used to compare 2 string
            MM = MM + Atomic_weight(j);
            u = j;
        end
    end
    n = str2num(species(i)); %str2num command is used to convert string into number
    if n>1
        MM = MM + Atomic_weight(u)*(n-1);
    end
end
end
Then we will print the Molecular weight using fprintf command and display it using disp command
    % Calculate the molecular weight of each species and display it in the command window.
     Molecular_weight(i) = molecular_mass(N_of_species{i});

     p = sprintf('Molecular weight of %s is equal to %f',N_of_species{i},Molecular_weight(i));

     disp(p)  % Displays all speices molecular masses in command window


end
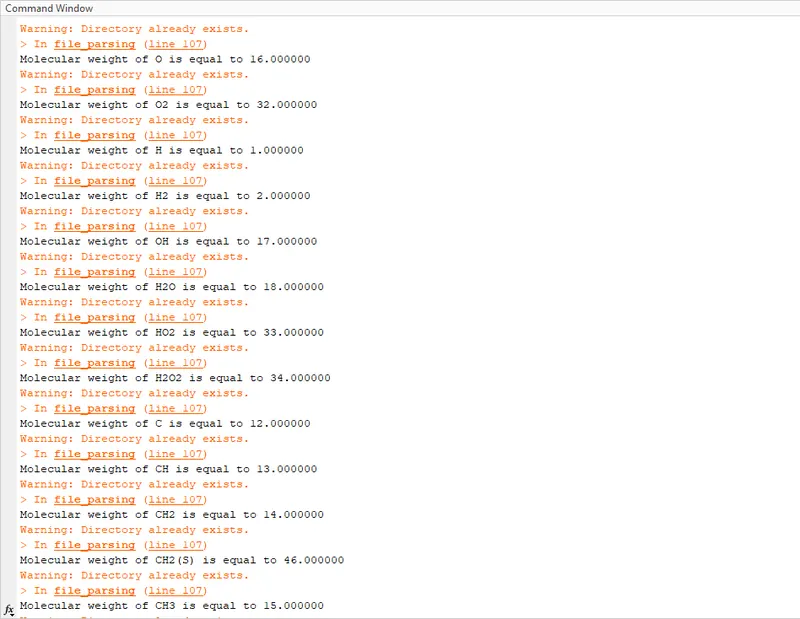
the data that is diplayed in the command window is shown below.
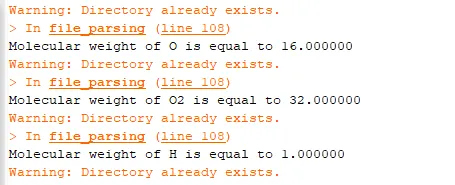
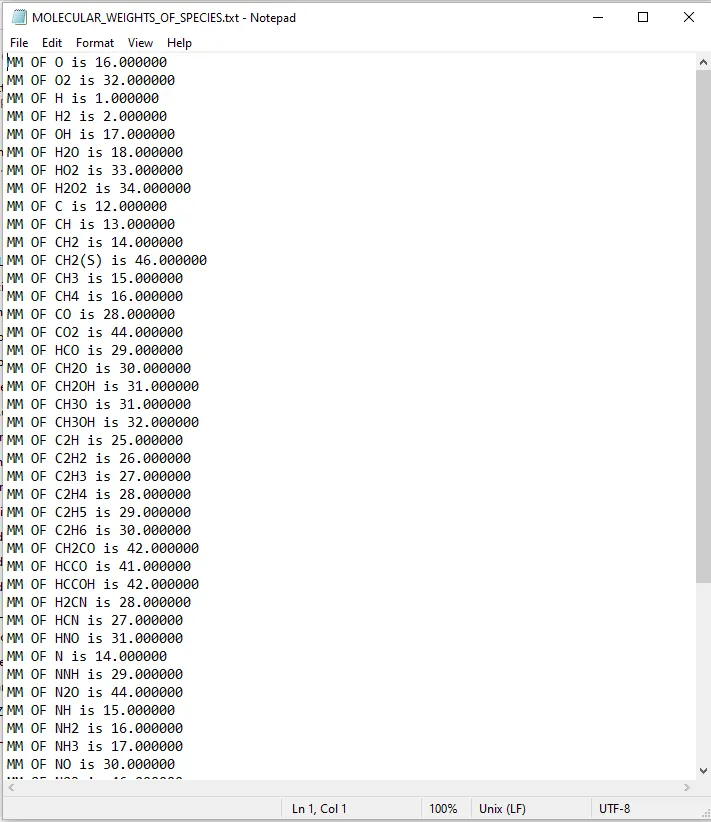
Here i have additionally coded extra commands to store all the molecular weight of each species is written in a textfile and saved as MOLECULAR_WEIGHTS_OF_SPECIES.txt
% molecular weight of each species is written in a textfile and saved as MOLECULAR_WEIGHTS_OF_SPECIES.txt

     f2 = fopen("MOLECULAR_WEIGHTS_OF_SPECIES.txt",'w');

     for k=1:53

     fprintf(f2,'MM OF %s is %f \n',N_of_species{k},Molecular_weight(k));

     end
     fclose(f2)

fclose(f1)

%%%%%    --------------    END OF PROGRAM    -------------------   %%%%%
output text file for the above code
MIAN PROGRAM :
%%%%%    --------------     File parsing NASA thermodynamic data    -------------------   %%%%%

clear all
close all
clc

f1 = fopen('THERMO.dat','r');        %Open file, or obtain information about open files
fgets(f1);                           %reads 1st line
G_temp = fgets(f1);                  %reads second line which involves temperatures
A = strsplit(G_temp,' ');            %splitting the strings in temp variable into pieces and assigning to variable 'A'

% glob_low_temp = str2num(A{2});
% glob_med_temp = str2num(A{3});
% glob_high_temp = str2num(A{4});

fgets(f1);  %reads 3rd line
fgets(f1);  %reads 4th line
fgets(f1);  %reads 5th line

%%%%%    --------------     S P E C I E S    -------------------   %%%%%
for i=1:53

S = fgets(f1);  %reads 6th line and assigned to variabl "species" for considering the line
species = strsplit(S,' ');
N_of_species{i} = species{1}; %Name of the species

loc_low_temp = str2num(species{end-3});
loc_mid_temp = str2num(species{end-1});
loc_high_temp = str2num(species{end-2});

%  2.56942078E+00-8.59741137E-05 4.19484589E-08-1.00177799E-11 1.22833691E-15    2
line_1 = fgets(f1);
CL1 = strfind(line_1,'E');
a1 = str2num(line_1(1:(CL1(1)+3)));                    % STORES VALUE   2.56942078E+00
a2 = str2num(line_1(CL1(1)+4:(CL1(2)+3)));             % STORES VALUE  -8.59741137E-05
a3 = str2num(line_1(CL1(2)+4:(CL1(3)+3)));             % STORES VALUE   4.19484589E-08
a4 = str2num(line_1(CL1(3)+4:(CL1(4)+3)));             % STORES VALUE  -1.00177799E-11
a5 = str2num(line_1(CL1(4)+4:(CL1(5)+3)));             % STORES VALUE   1.22833691E-15

%  2.92175791E+04 4.78433864E+00 3.16826710E+00-3.27931884E-03 6.64306396E-06    3
line_2 = fgets(f1);
CL2 = findstr(line_2,'E');
a6 = str2num(line_2(1:(CL2(1)+3)));
a7 = str2num(line_2(CL2(1)+4:(CL2(2)+3)));
a8 = str2num(line_2(CL2(2)+4:(CL2(3)+3)));
a9 = str2num(line_2(CL2(3)+4:(CL2(4)+3)));
a10 = str2num(line_2(CL2(4)+5:(CL2(5)+3)));

% -6.12806624E-09 2.11265971E-12 2.91222592E+04 2.05193346E+00                   4
line_3 = fgets(f1);
CL3 = findstr(line_3,'E');
a11 = str2num(line_3(1:(CL3(1)+3)));
a12 = str2num(line_3(CL3(1)+4:(CL3(2)+3)));
a13 = str2num(line_3(CL3(2)+4:(CL3(3)+3)));
a14 = str2num(line_3(CL3(3)+4:(CL3(4)+3)));


T = linspace(loc_low_temp,loc_high_temp,100);

R = 8.314;  % UNIVERSAL GAS CONSTANT (J/mol*K)

for j = 1:length(T)
    if T(j) > loc_mid_temp

   cp(j)=(a1+a2.*T(j)+a3.*T(j).^2 +a4.*T(j).^3+a5.*T(j).^4 ).*R;
   H(j)=(a1+a2.*T(j)./2+a3.*T(j).^2/3+a4.*T(j).^3/4+a5.*T(j).^4/5+a6./T(j)).*R.*T(j);
   S1(j)=(a1.*log(T(j))+a2.*T(j)+a3.*T(j).^2/2+a4.*T(j).^3/3+a5.*T(j).^4/4 + a7).*R;

   else

   cp(j)=(a8+a9.*T(j)+a10.*T(j).^2+a11.*T(j).^3+a12.*T(j).^4).*R;
   H(j)=(a8 + a9.*T(j)/2+a10.*T(j).^2/3+a11.*T(j).^3/4+a12.*T(j).^4/5+a13./T(j)).*R.*T(j);
   S1(j)=(a8.*log(T(j))+a9.*T(j)+a10.*T(j).^2/2 +a11.*T(j).^3/3+a12.*T(j).^4/4+a14).*R;

    end

end


%PLOTTING Temperature vs Entropy

    figure(1)
    plot(T,S1,'linewidth',3)
    title(N_of_species{i})
    xlabel('Temperature (T)')
    ylabel('Entropy (S)')

%PLOTTING Temperature vs Enthalpy

   figure(2)
    plot(T,H,'linewidth',3,'color','b')
    title(N_of_species{i})
    xlabel('Temperature (T)')
    ylabel('Enthalpy (H)')

%PLOTTING Temperature vs Specific Heat

   figure(3)
   plot(T,cp,'linewidth',3,'color','g')
        title(N_of_species{i})
    xlabel('Temperature (T)')
    ylabel('Specific Heat (cp)')

    % creating 53 species folders under main folder of name "N_of_species" and saving plots

     mkdir (N_of_species{i});
     cd(N_of_species{i});
     saveas(1,'entropy.jpg')
     saveas(2,'enthalpy.jpg')
     saveas(3,'specific heat.jpg')
     cd .. % ../	One level up from the current folder which means after creating species folder it direct back to main folder and creates another species folder

    % Calculate the molecular weight of each species and display it in the command window.
     Molecular_weight(i) = molecular_mass(N_of_species{i});

     p = sprintf('Molecular weight of %s is equal to %f',N_of_species{i},Molecular_weight(i));

     disp(p)  % Displays all speices molecular masses in command window


end

% molecular weight of each species is wriiten in a textfile and saved as MOLECULAR_WEIGHTS_OF_SPECIES.txt

     f2 = fopen("MOLECULAR_WEIGHTS_OF_SPECIES.txt",'w');

     for k=1:53

     fprintf(f2,'MM OF %s is %f \n',N_of_species{k},Molecular_weight(k));

     end
     fclose(f2)

fclose(f1)

%%%%%    --------------    END OF PROGRAM    -------------------   %%%%%
Function Program containing molecular mass information :
%code for molecular mass
function MM = molecular_mass(species_name) %Function take N_of_species as input and give MM as output

species = upper(species_name); %species stored in a string


elements = ['H' ,'C' , 'N' , 'O' , 'A' ,'S']; %Element array is used to stored species_name

Atomic_weight = [1 , 12 , 14 , 16 , 40 , 32 ];%Atomic weight of each element is stored in array called Atomic_weight

MM = 0 ; %Molecular weight  initially set to 0.

for i = 1:length(species_name) %for loop is used to run species_name
    for j = 1:length(elements) %Is used to run entire length of elements
        if strcmp(species(i),elements(j)) %strcmp command is used to compare 2 string
            MM = MM + Atomic_weight(j);
            u = j;
        end
    end
    n = str2num(species(i)); %str2num command is used to convert string into number
    if n>1
        MM = MM + Atomic_weight(u)*(n-1);
    end
end
end
PLOTS :
o2
N2
Co2
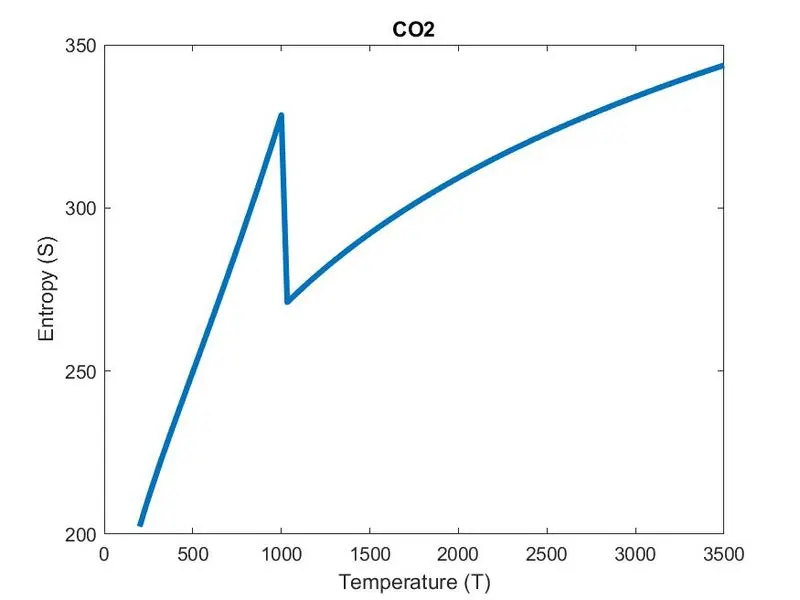
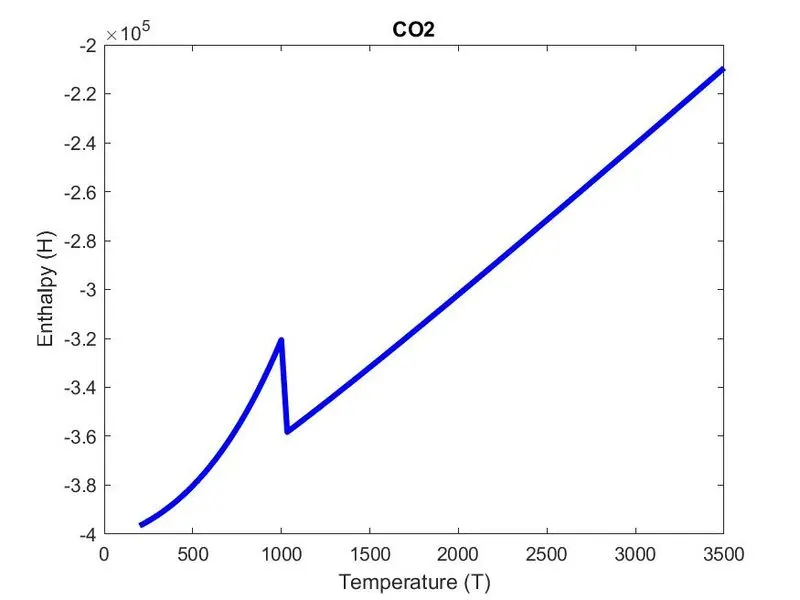
ERRORS FACED :
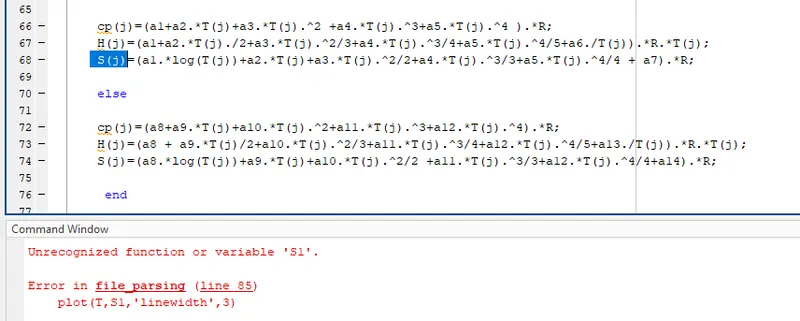
Error (1) : here i have specified same variable namme for both entropy and species as "S" which matlab will gives an error so we have specified seperate variable name S1 for entropy and the error is cleared.
Error (2) :
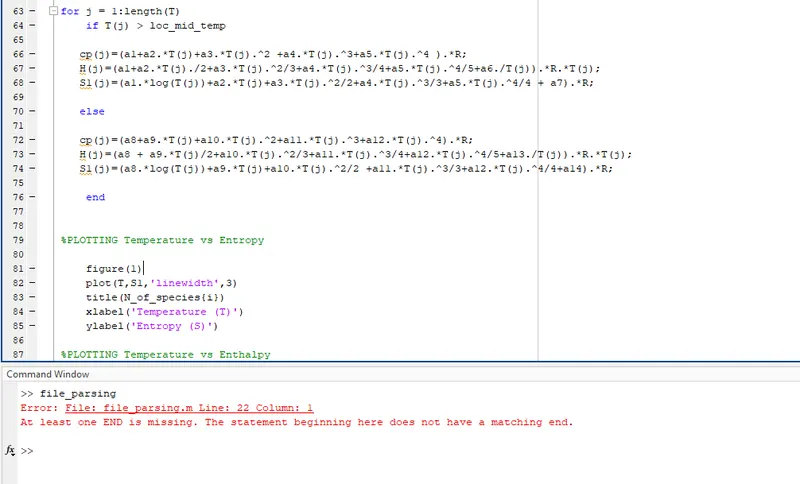
Here i have forgor to specify the end command lline after the loop ends since actually there are two loops involved so we can resolve the error with two 'end' lines .
SCREENSHOTS & PLOTS :

| FIg (1) : Plots as images with appropriate names and dumped them in separate folders for each species with suitable name. All these are generated automatically. |
 |
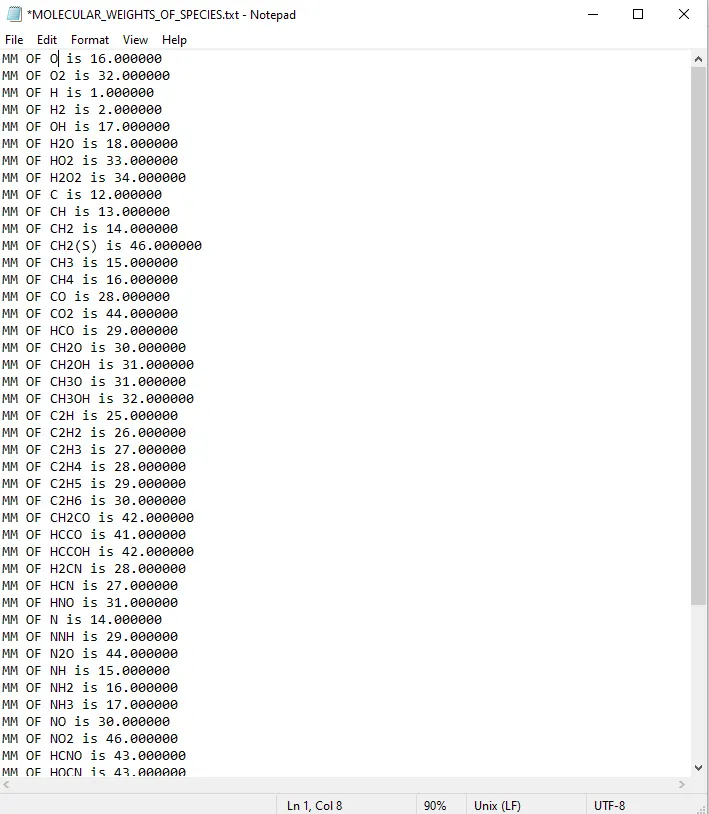 |
| Fig (2) : Calculated molecular weight of each species are displayed it in the command window. | Fig (3) : Molecular weight of each species are saved in a text file. |
REFERENCES :
Best way to parse text file - MATLAB Answers - MATLAB Central (mathworks.com)
https://en.wikipedia.org/wiki/Parsing
https://in.mathworks.com/help/matlab/ref/mkdir.html
https://in.mathworks.com/help/matlab/ref/cd.html
https://in.mathworks.com/help/matlab/ref/saveas.html
Note :
I have Calculated the molecular weight of each species and displayed it in the command window.Plotted the Cp, Enthalpy and Entropy for the local temperature range (low temperature : high temperature) specific for each species.I have Saved the plots as images with appropriate names and dump them in separate folders for each species with suitable name which are generated automatically.The main program that i have submitted will just take the "THERMO.dat" file as an input and generates Cp, H and S plots.I have written down a detailed report to describe the logics and line of commands
Attachments submitted in report :
Screenshots of the window where all the folders are saved.Plots for o2, N2 and Co2 species (your program should be case insensitive, if it is going to take the species name as an input).Screenshots of text file having data of all 53 species with thier molecular weightsLabelled the main and important sections of code using comments (%)Mentioned the errors faced while programming.Steps taken to overcome those errors.Screenshots showing errors thrown in command window.The codes, plots, images, are submitted through the answer box.