Project 1 - Parsing NASA thermodynamic data
Project Name- PARSING NASA Thermodynamic Data
Aim of the project:
Understanding file parsing using MATLAB software
Objectives:
- Write a function that extracts the 14 co-efficients and calculates the enthalpy, entropy and specific heats for all the species in the data file. You will be reading this file NASA thermodynamic data(Tip:use fopen and fgetl).
- Calculate the molecular weight of each species and display it in the command window.
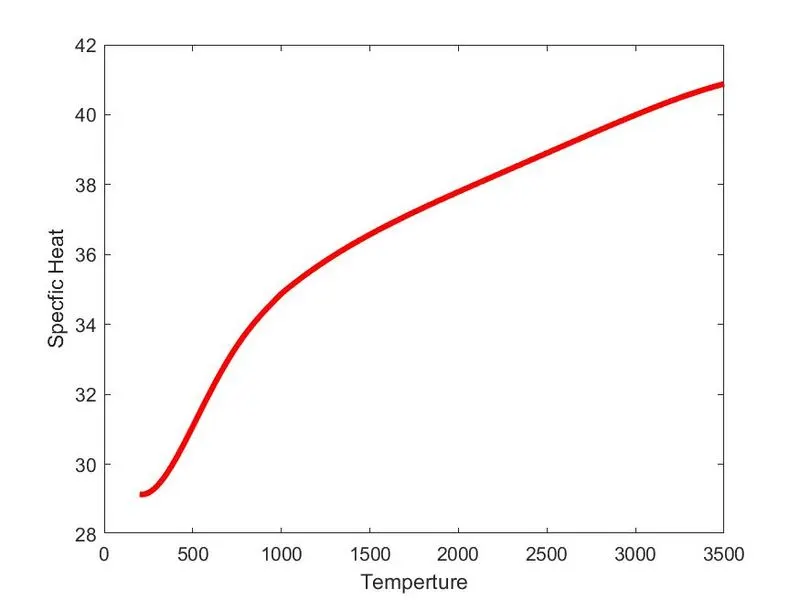
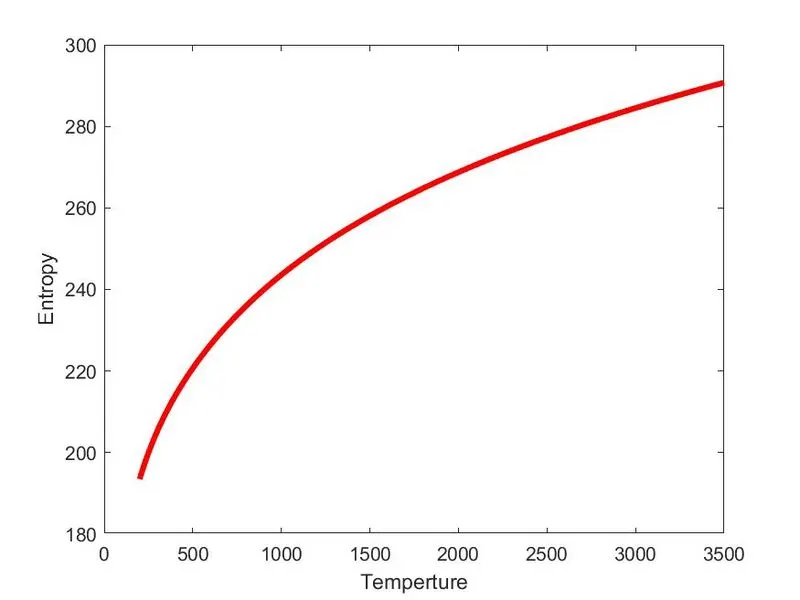
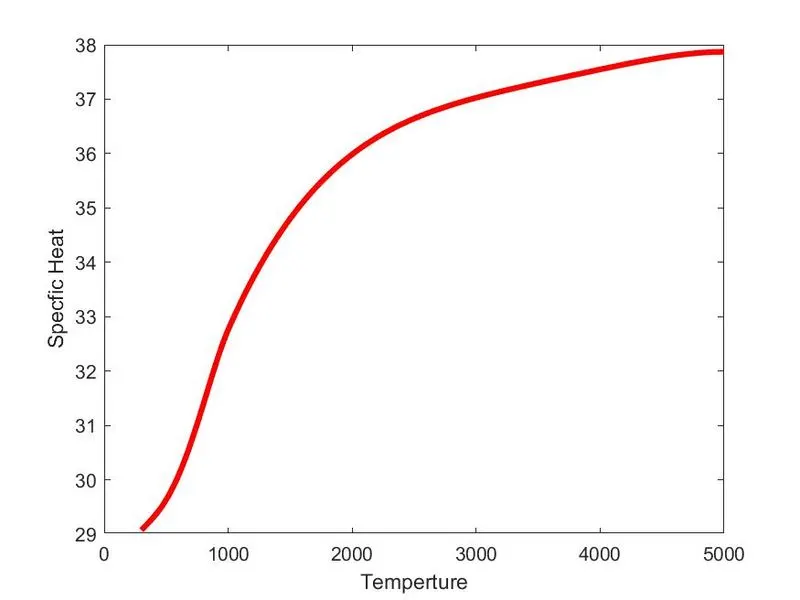
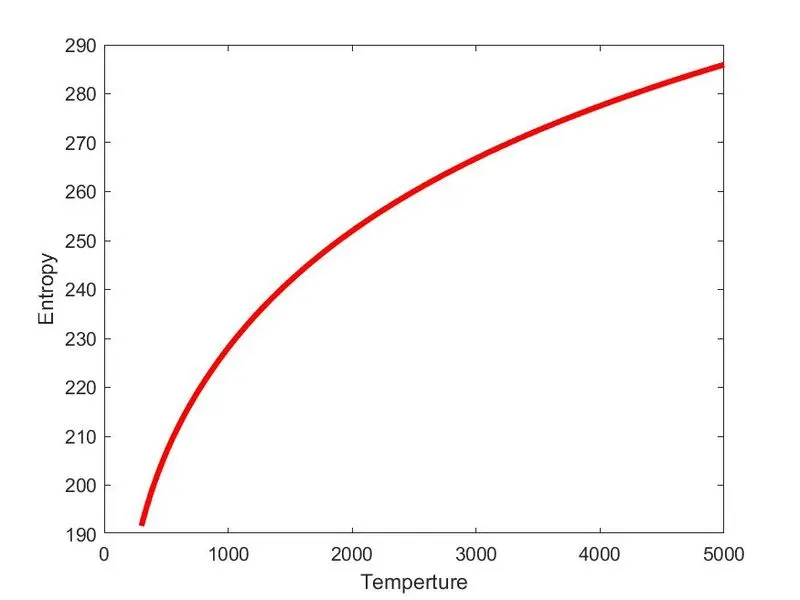
- Plot the Cp, Enthalpy and Entropy for the local temperature range (low temperature: high temperature) specific for each species.
- Save the plots as images with appropriate names and dump them in separate folders for each species with suitable name. All these should be generated automatically.
- The main program that you will submit will just take the "THERMO.dat" file as an input and generate Cp, H and S plots.
- Detailed report to describe program logic.
Governing equations:

Where:
Cp = specific heat [J/mol K]
R = Universal gas constant = 8.314
T =Temperature [K]
H = Enthalpy [J]
S = Entropy
Theory:
Parsing means dividing anything into smallest components to understand from the core. In programming parsing means breaking a program element into their smallest units to create some knowledge for a compiler to understand the syntax and semantics of any programming language. There are two types of parser.
To parse, in computer science, is where a string of commands – usually a program – is separated into more easily processed components, which are analyzed for correct syntax and then attached to tags that define each component.
STEP WISE MY CODE:
- As usual we are using close all, clear all, clc command at the beginning
- Fopen command used to read the data inside the file
- The first five line in the file “shown in below” are only for reading purpose so I have used the Fgetl to skip these five lines
- We have here in our case 53 species available, so w have used the forloop and fgetl commands to read all these species
- Then, I read the local temperature values line, split it and save it into species
- Then I convert the temperature values into double by using str2double command
- Linespace command used from the minimum to maximum local temperature
- Then Creating the function for all local temperatures
- So, I have used the if loop for T(i) > Local mid temperature and else T(i) < local mid temperature for low and high temps
- Then find out the co-efficient and position of E
- Then extract the high & low temp co-efficient and convert them from string to number format
- Then call the function and define it
- Then plot the figures for temperature vs specific heat, Temp vs enthalpy and temp vs entropy
- Create the plot saving path and change the directory
- Plots are saved in jpg format
- Calculate the molecular weight by descripting elements and it’s atomic weight
- Use for loop for species and elements to calculate the molecular weight
MY CODE:
%file parsing
%Project 1 - Parsing NASA thermodynamic data
clear all
close all
clc

f1 = fopen('THERMO.dat','r');

% header = fgetl(f1); %getting values of the first line
for i=1:5
tline_2 = fgetl(f1);  %getting values of the second line
end
 for j = 1:53
tline_1 = fgetl(f1);
%local temperture values getting from the second line of the file
linex = strsplit(tline_1,' ')
species = linex{1}
len = length(linex)
local_mintemp = str2double(linex{len-3});
local_medtemp = str2double(linex{len-1});
local_maxtemp = str2double(linex{len-2});

T = linspace(local_mintemp,local_maxtemp,200);


R = 8.314;    % UNIT = KJ/Kg-K

%CO-EFFICIENTS

a = fgetl(f1);
b = fgetl(f1);
c = fgetl(f1);

%Finding E position

d = strfind(a,'E');
e = strfind(b,'E');
f = strfind(c,'E');

%Extracting high temperture co-efficient


 a1 = a(1:d(1)+3);
 a1 = str2num(a1);

 a2 = a(d(1)+4:d(2)+3);
 a2 = str2num(a2);

a3 = a(d(2)+4:d(3)+3);
a3 = str2num(a3);

a4 =a(d(3)+4:d(4)+3);
a4 = str2num(a4);

 a5 = a(d(4)+4:d(5)+3);
 a5 = str2num(a5);

 a6 = b(1:e(1)+3);
 a6 = str2num(a6);


 a7 = b(e(1)+4:e(2)+3);
 a7 = str2num(a7);

 a8 = b(e(2)+4:e(3)+3);
 a8 = str2num(a8);

 a9 = b(e(3)+4:e(4)+3);
 a9 = str2num(a9);

 a10 = b(e(4)+4:e(5)+3);
 a10= str2num(a10);

 a11 = c(1:f(1)+3);
 a11= str2num(a11);

 a12 = c(f(1)+4:f(2)+3);
 a12= str2num(a12);

 a13 = c(f(2)+4:f(3)+3);
 a13= str2num(a13);

 a14 = c(f(3)+4:f(4)+3);
 a14= str2num(a14);

 %specfic heat, entropy, Enthalpy

for i = 1:length(T)

    %FOR Hight temperture

    if T(i) > local_medtemp
        Cp(i) = (a1 + a2*T(i) + a3*T(i)^2 + a4*T(i)^3 + a5*T(i)^4)*R;
        H(i) = (a1 + a2*(T(i)/2) + a3*(T(i)^2)/3 + a4*(T(i)^3)/4+ a5*(T(i)^4)/5+ a6/(T(i)))*R*T(i);
        S(i) = (a1*log(T(i)) + a2*T(i) + a3*(T(i)^2)/2 + a4*(T(i)^3)/3+ a5*(T(i)^4)/4 + a7)*R;

        %For low temperture

    else

        Cp(i)= (a8 + a9*T(i) + a10*T(i)^2 + a11*T(i)^3 + a12*T(i)^4)*R;
        H(i) = (a8 + a9*(T(i)/2) + a10*(T(i)^2)/3 + a11*(T(i)^3)/4+ a12*(T(i)^4)/5+ a13/T(i))*R*T(i);
        S(i) = (a8*log(T(i)) + a9*T(i) + a10*(T(i)^2)/2 + a11*(T(i)^3)/3+ a12*(T(i)^4)/4 + a14)*R;
    end
end


 %plotting
 figure (1)
 plot(T,Cp,'color','r','linewidth',3)
 xlabel('Temperture')
 ylabel('Specfic Heat')

 figure (2)
 plot(T,H,'color','r','linewidth',3)
 xlabel('Temperture')
 ylabel('Enthalpy')


 figure (3)
 plot(T,S,'color','r','linewidth',3)
 xlabel('Temperture')
 ylabel('Entropy')

 mkdir(['D:\Asmaa Private\CFD-FEA\Skill-Lync\Matlab\Challenges & Projects\6 file parsing\PLOTS\',species])

 cd(['D:\Asmaa Private\CFD-FEA\Skill-Lync\Matlab\Challenges & Projects\6 file parsing\PLOTS\', species])

 %saving data in Jpg formate

 saveas(figure(1),'Specfic Heat vs Temperture','jpg');
 saveas(figure(2),'Enthalpy vs Temperture','jpg');
 saveas(figure(3),'Entropy vs Temperture','jpg');

 %calculating molecular weight

 Elements = ['H','O','C','N','S','A'];
 Atomic_weight = [1,16,12,14,32,40];
 mw = 0;

 for i = 1:length(species)
     for j = 1:length(Elements)
    if strcmp(species(i),Elements(j))==1

    mw = Atomic_weight(j) + mw;
    Z  = Atomic_weight(j);

    end
     end

    n = str2num(species(i));

    if n>1
        mw = Atomic_weight*(n-1)+mw;

    end
 end

 disp(['Molecular weight of : ', species])
 disp(mw)


 end
Outputs:
1.screenshot where all species are saved
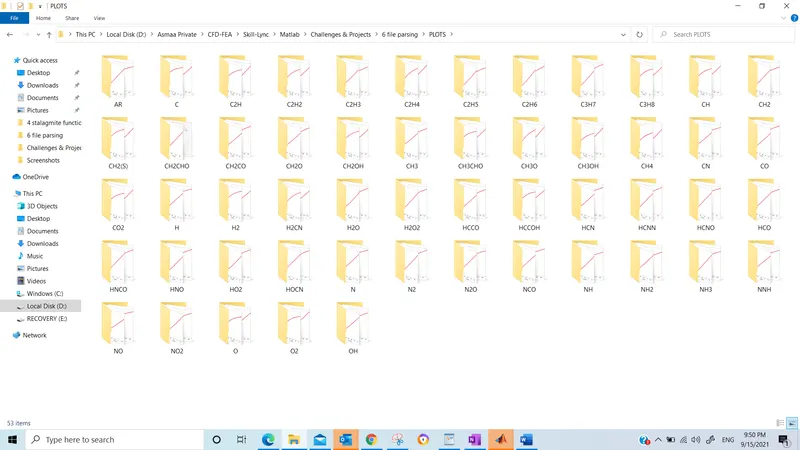
2.PLOTS O2, CO2,N2
2.1 Plots of O2
Specfic heat vs temperture
Enthalpy vs temperture 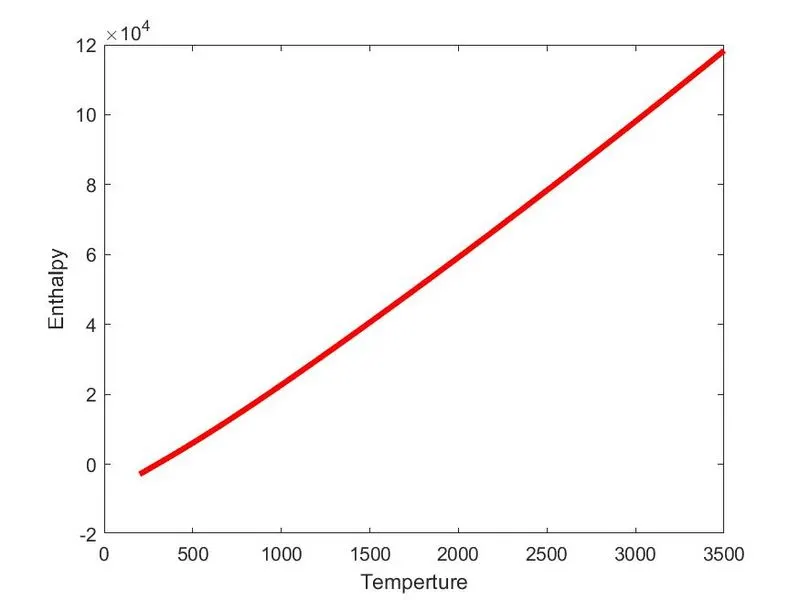
Entropy vs temperture
2.2 Plots of CO2
Specific heat vs temperture
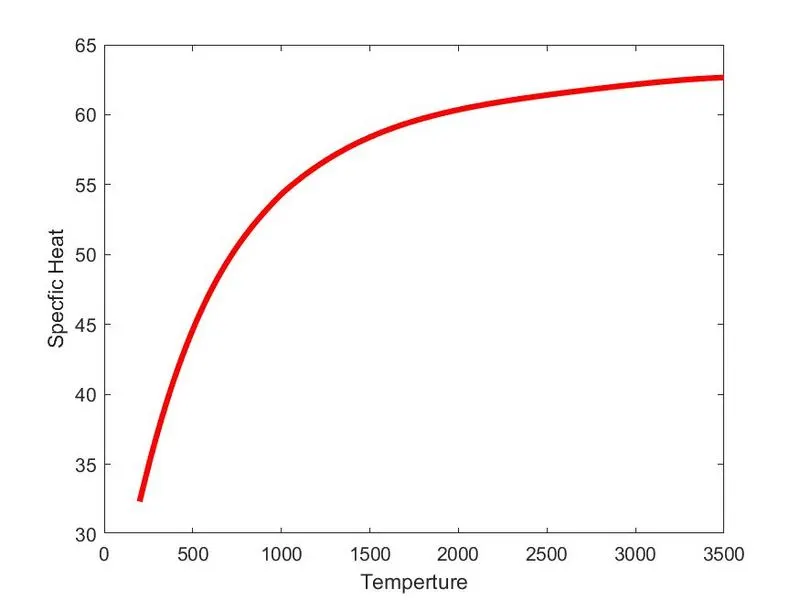
Enthalpy vs temperture
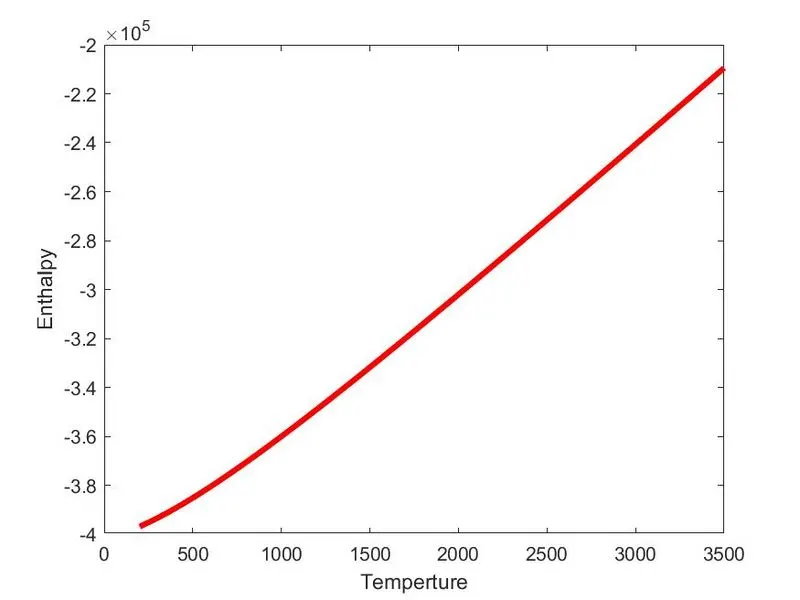
Entropy vs Temperture
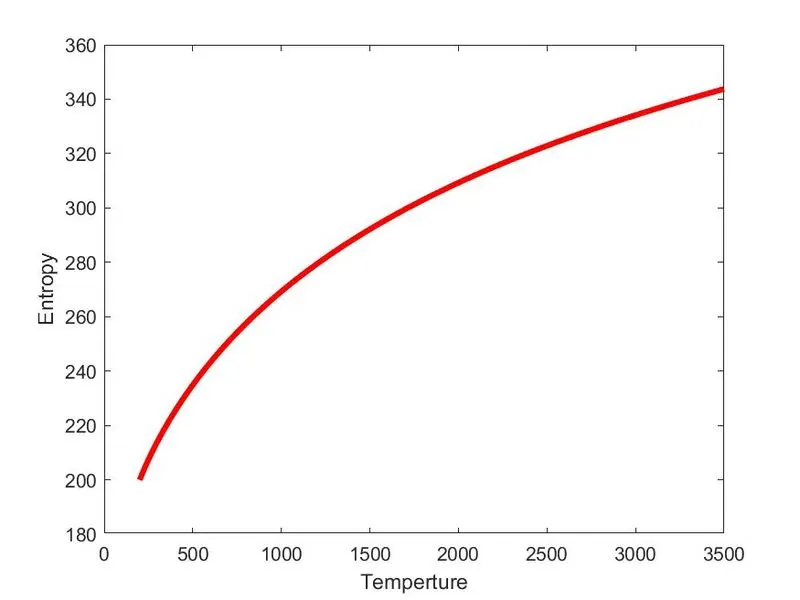
2.3 Plots of N2
specific heat vs temperture
Enthalpy VS Temperture
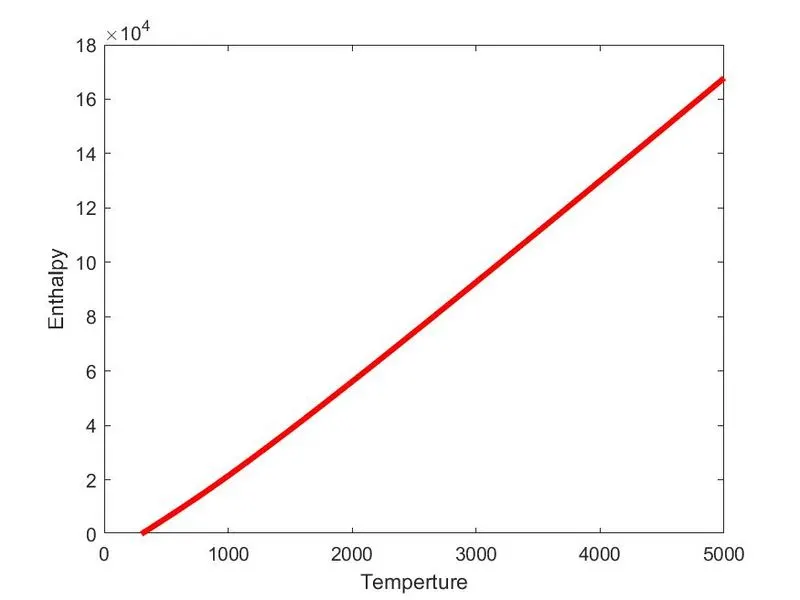
Entropy vs Temperture
3. Molecular weights of O2, Co2, N2
Molecular weight of : O2

Molecular weight of : CO2

Molecular weight of : N2

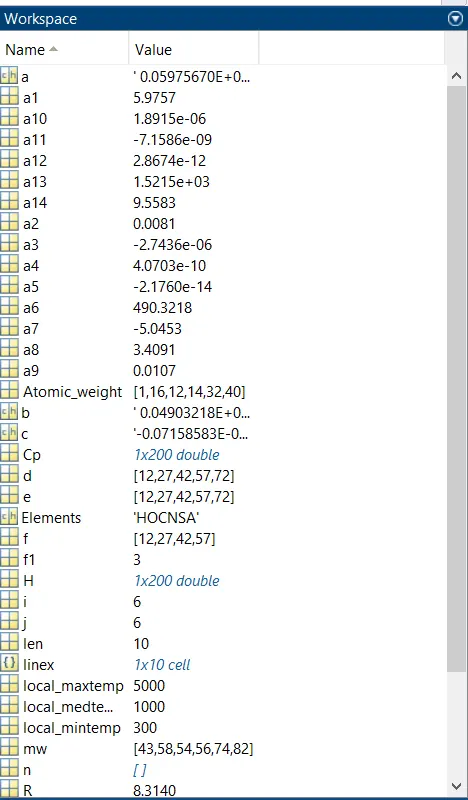
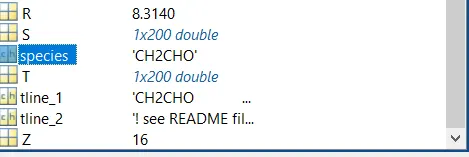
4. SCREENSHOT of workspace
References: