Project 1 - Parsing NASA thermodynamic data
Section 1:- Code
close all
clear all
clc

%Loading the data from the system
f = fopen('thermo.dat','r');

%Extracting the Global Temp from the data
fgetl(f);
t = fgetl(f);
global_T = strsplit(t,' ');

Global_low_T = str2num(global_T{2});
Global_mid_T = str2num(global_T{3});
Global_high_T = str2num(global_T{4});

%Skipping the comments
for i=1:3
    fgetl(f);
end

%Extracting Species and Local Temp of the Species
for y = 1:53
%Line 1
e1 = fgetl(f);
e1 = strsplit(e1,' ');
L = length(e1);

Element = (e1{1});
T_low = str2num(e1{L-3});
T_mid = str2num(e1{L-2});
T_high = str2num(e1{L-1});

%Extracting the Coefficients
k = 1;
for i = 1:3
    coff = fgetl(f);
    E = findstr(coff,'E');

    for j = 1:length(E)
           a(k) = str2num(coff(E(j)-11:E(j)+3));
           k = k+1;
    end
end

%Calculating the molaecular weight of the Species
Elements = ['H','C','O','N','A'];
atomic_weight = [1.0079 12.0107 15.999 14.0067 39.948];
M = 0;
for l = 1:length(Element);
    for m = 1:length(atomic_weight);
        if strcmp(Element(l),Elements(m));
            M = M + atomic_weight(m);
            position = m;
        end
    end
n = str2num(Element(l));
    if n>1
        M = M + atomic_weight(position)*(n-1);
    end
end

sprintf('Molecular weightof %s is %funits',Element,M)

%Calculating the Specific Heat, Enthaphy, and Entrophy of the species
T = linspace(T_low,T_high,100);
R = 8.314;

for z = 1:length(T)

    if T(z) > T_mid

    Cp(z) = R*(a(1) + a(2)*T(z) + a(3)*T(z)^2 +a(4)*T(z)^3 +a(5)*T(z)^4);
    H(z) = R*T(z)*(a(1) + a(2)*T(z)/2 + a(3)*T(z)^2/3 +a(4)*T(z)^3/4 +a(5)*T(z)^4/5+ a(6)/T(z));
    S(z) = R*(a(1)*log(T(z)) + a(2)*T(z) + a(3)*T(z)^2/2 +a(4)*T(z)^3/3 +a(5)*T(z)^4/4+a(7));

else
    Cp(z) = R*(a(8) + a(9)*T(z) + a(10)*T(z)^2 +a(11)*T(z)^3 +a(12)*T(z)^4);
    H(z) = R*T(z)*(a(8) + a(9)*T(z)/2 + a(10)*T(z)^2/3 +a(11)*T(z)^3/4 +a(12)*T(z)^4/5+ a(13)/T(z));
    S(z) = R*(a(8)*log(T(z)) + a(9)*T(z) + a(10)*T(z)^2/2 +a(11)*T(z)^3/3 +a(12)*T(z)^4/4+a(14));

    end
end

%ploting the curves against the Local temp
figure(1)
plot(T,Cp);
grid on
title(Element)
xlabel('Temperature')
ylabel('Specific Heat')

figure(2)
plot(T,H);
grid on
title(Element)
xlabel('Temperature')
ylabel('Enthalpy')

figure(3)
plot(T,S);
grid on
title(Element)
xlabel('Temperature')
ylabel('Entropy')

%Designating and allocating new Directory To save the plots
mkdir('C:\Users\Christin\Documents\MATLAB\Project_1\Element\',Element);
cd(['C:\Users\Christin\Documents\MATLAB\Project_1\Element\',Element]);

saveas(figure(1),'Specific_Heat','jpg');
saveas(figure(2),'Enthalphy','jpg');
saveas(figure(3),'Entropy','jpg');

cd(['C:\Users\Christin\Documents\MATLAB\Project_1\']);

end
Section 2:- Explanation
1) Using the "fopen" command we read the file that has the data containing the coefficients for different spices.
2) Then using the "fgetl" we read the line from the data which we then use the "strsplit" we break the line depending on the position of " " and read the values and the using "str2num" we converted the character value to a number. we extracted the Global temperature.
3) Using the same method as point 2 we extracted the Species and the local temp of the Species.
4) we read the next line of the data using"fgetl" and then using the "findstr" command we locate the position of 'E' and using the location of 'E' we then create an Equation to locate the Coefficient and using the "for loop" command we locate the rest of the coefficient.
5) Using the "for loop' we repeat process 4 for 3 more times to extract the 14 coefficients needed in this process.
6) We then provide the species and their atomic weight and build an expression to calculate the molecular weight of the species by comparing the elements using "strcmp" to compare the species element to the element we provided and to calculate the molecular weight of the species.
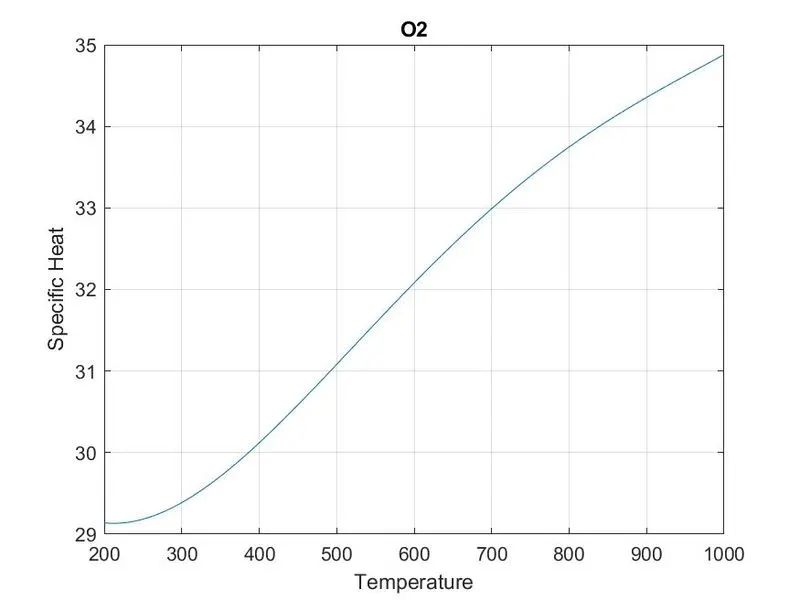
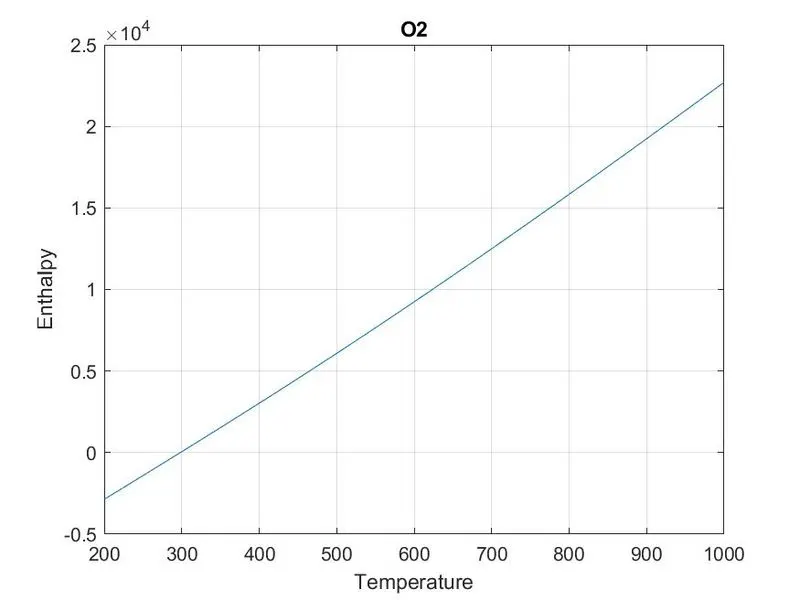
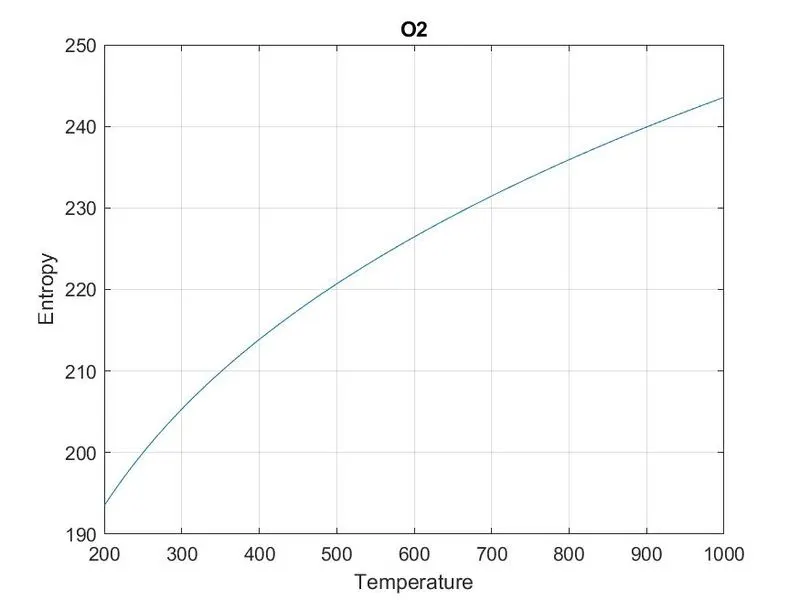
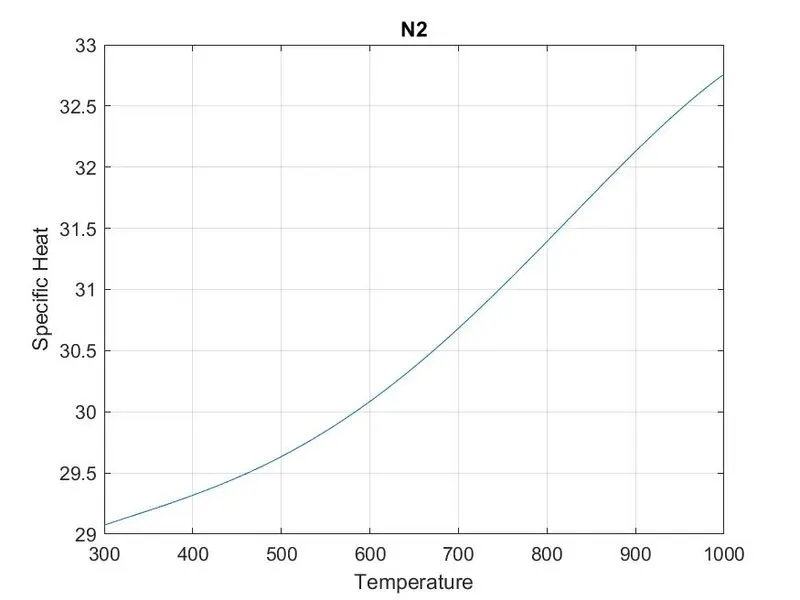
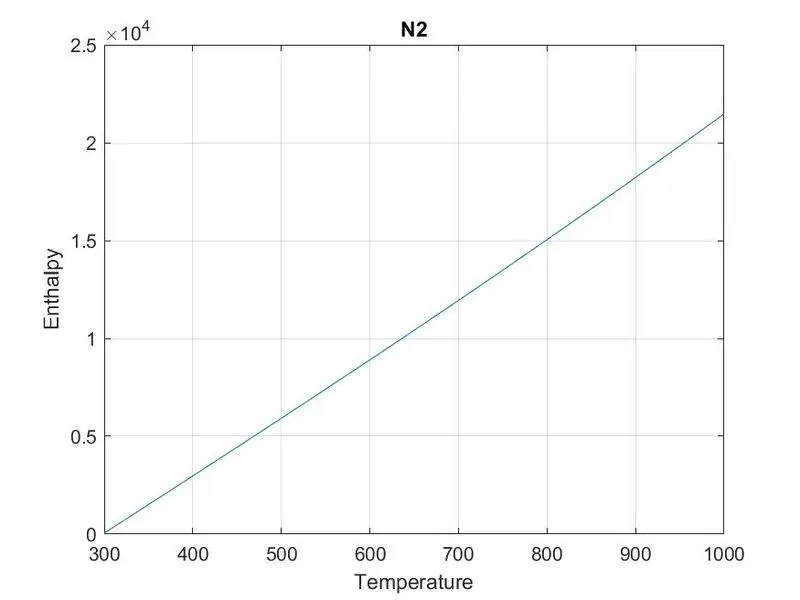
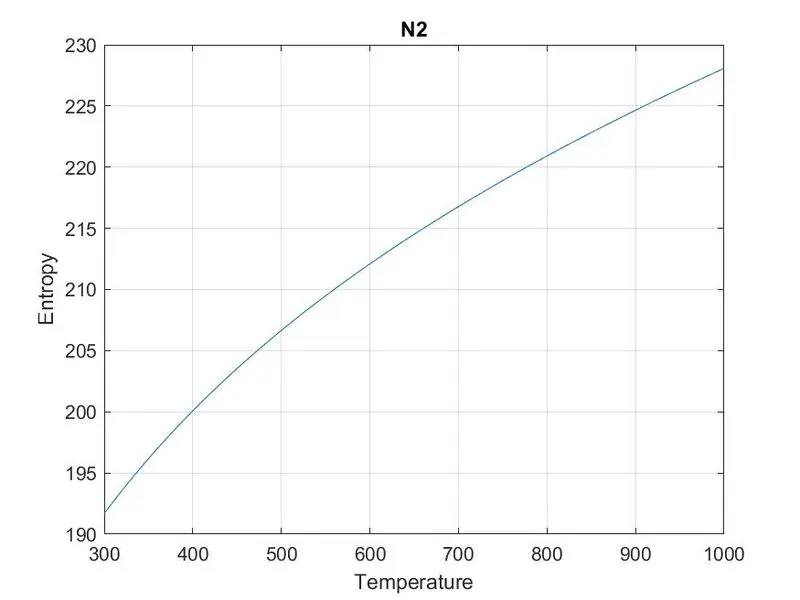
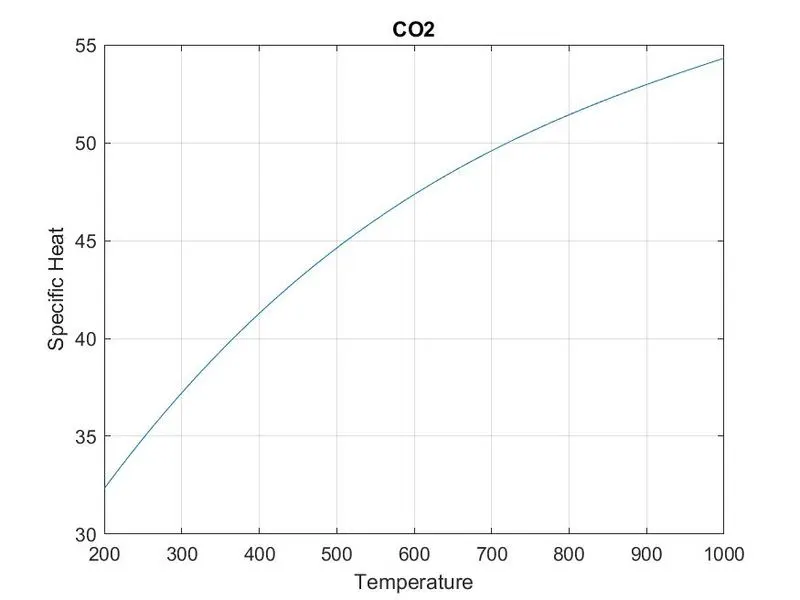
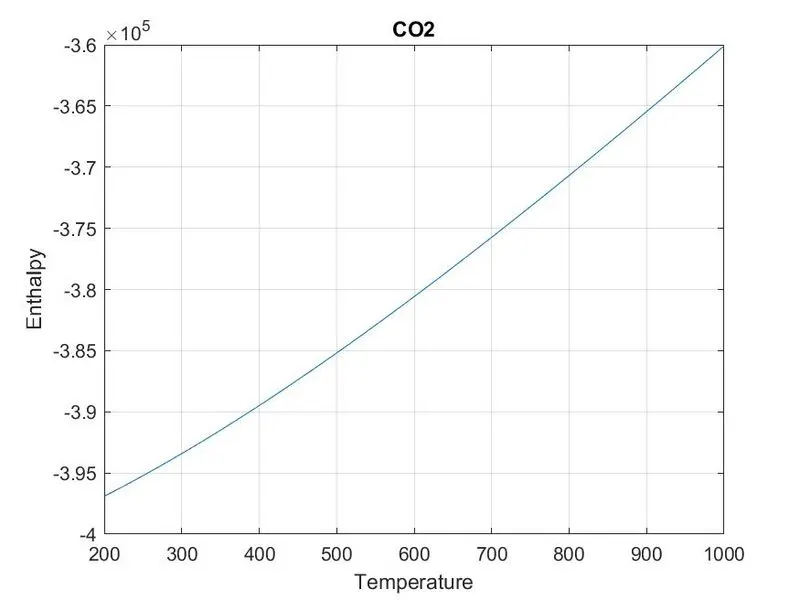
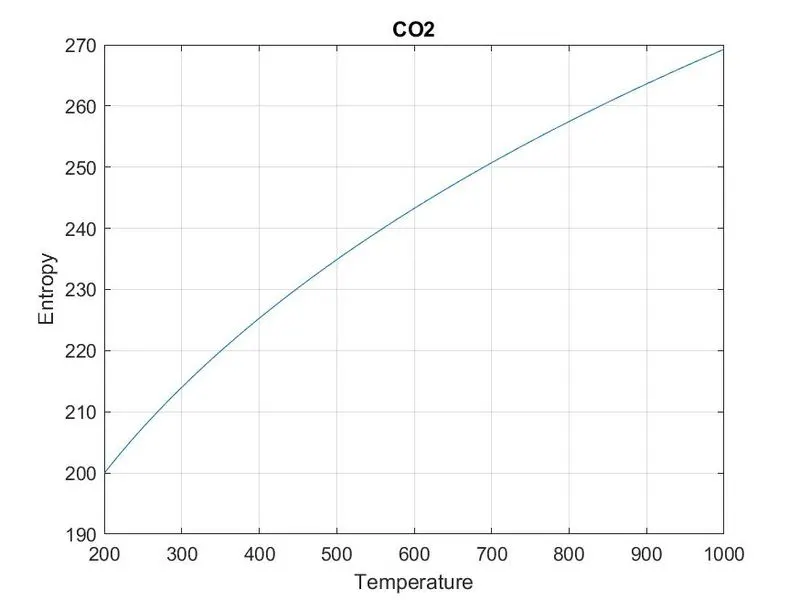
7) Then we build a function to calculate the Specific heat, enthalpy, and entropy of the species at a given temp and plot the calculated data against the temp value.
8) Then we create a directory to save the plots at an individual folder named after the Species from which it has been calculated.
9)We repeat the process 3-8 53 more times using the "for loop" command to solve the rest of the species and calculating the molecular weight
Section 3:- Screenshots

-Screenshot of the folder where it's saved
Section 4:- Plots
O2
Specific Heat
Enthalpy
Entropy
N2
Specific Heat
Enthalpy
Entropy
CO2
Specific Heat
Enthalpy
Entropy
Section 4:- Result
Hence the Cp, Enthalpy, Entropy and the molecular weight of the species has been calculated and been plotted