Project 1 - Parsing NASA thermodynamic data
1. MAIN CODE
clear all
close all
clc


%INPUTS REQUIRED
species_name1 = input('Enter the name of the Species','s')
comp = upper(species_name1);
%OPENING THE DATA FILE
f1 = fopen('THERMO.dat','r');

header = fgetl(f1);

%READING THE VALUES OF GLOBAL TEMPERATURE

global_temperature = fgetl(f1);

x = strsplit(global_temperature);

global_low_temperature = str2double(x{2});
global_mid_temperature = str2double(x{3});
global_high_temperature = str2double(x{4});

fgetl(f1)
fgetl(f1)
fgetl(f1)

for i = 1:53

    line1 = fgetl(f1);
    species_name = line1(1:6);

    %READING THE VALUES OF LOCAL TEMPERATURE
    local_temperature1 = line1(49:55);
    low_temperature = str2double(local_temperature1);

    local_temperature2 = line1(58:65);
    mid_temperature = str2double(local_temperature2);

    local_temperature3 = line1(68:75);
    high_temperature = str2double(local_temperature3);

    %CO-EFFICIENT EXTRACTION FROM THE READ VALUES
    line2 = fgetl(f1);
    line3 = fgetl(f1);
    line4 = fgetl(f1);

    a = strfind(line2, 'E');
    b = strfind(line3, 'E');
    c = strfind(line4, 'E');

    a1 = str2double(line2(1:a(1)+3));
    a2 = str2double(line2(a(1)+4:a(2)+3));
    a3 = str2double(line2(a(2)+4:a(3)+3));
    a4 = str2double(line2(a(3)+4:a(4)+3));
    a5 = str2double(line2(a(4)+4:a(5)+3));
    a6 = str2double(line3(1:b(1)+3));
    a7 = str2double(line3(b(1)+4:b(2)+3));
    a8 = str2double(line3(b(2)+4:b(3)+3));
    a9 = str2double(line3(b(3)+4:b(4)+3));
    a10 = str2double(line3(b(4)+4:b(5)+3));
    a11 = str2double(line4(1:c(1)+3));
    a12 = str2double(line4(c(1)+4:c(2)+3));
    a13 = str2double(line4(c(2)+4:c(3)+3));
    a14 = str2double(line4(c(3)+4:c(4)+3));


    %UNIVERSAL GAS CONSTANT
    R = 8.314;
    t = linspace(low_temperature,high_temperature,500);

    %CALCULATING SPECIFIC HEAT
    c_p = ((a1 + a2*t + a3*t.^2 + a4*t.^3 + a5*t.^4)*R);

    %CALCULATING ENTHALPY
    H = ((a1 + a2*(t/2) + a3*((t.^2)/3) + a4*((t.^3)/4) + a5*((t.^4)/5) + (a6./t)))*R.*t;

    %CALCULATING ENTROPY
    S = ((a1*log(t) + a2*t + a3*((t.^2)/2) + a4*((t.^3)/3) + a5*((t.^4)/4) + a7)*R);


    %CREATING DIRECTORY
    data = strcat('properties of ....', species_name);
    mkdir(data);
    file = pwd;


    %PLOTTING
    %TEMPERATURE VS SPECIFIC HEAT
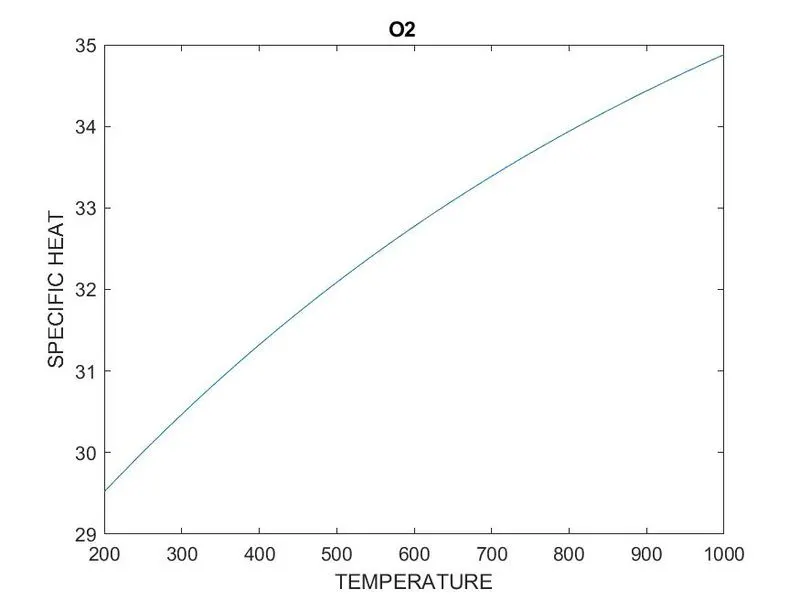
    figure(1)
    plot(t,c_p)
    data1 = strcat(species_name, 'TEMPERATURE VS SPECIFIC HEAT');
    xlabel('TEMPERATURE')
    ylabel('SPECIFIC HEAT')
    title(species_name)
    f = fullfile(data);
    cd(f)
    saveas(gcf,[pwd '/TEMPERATURE VS SPECIFIC HEAT.jpg'])
    cd(file)

    %TEMPERATURE VS ENTHALPY
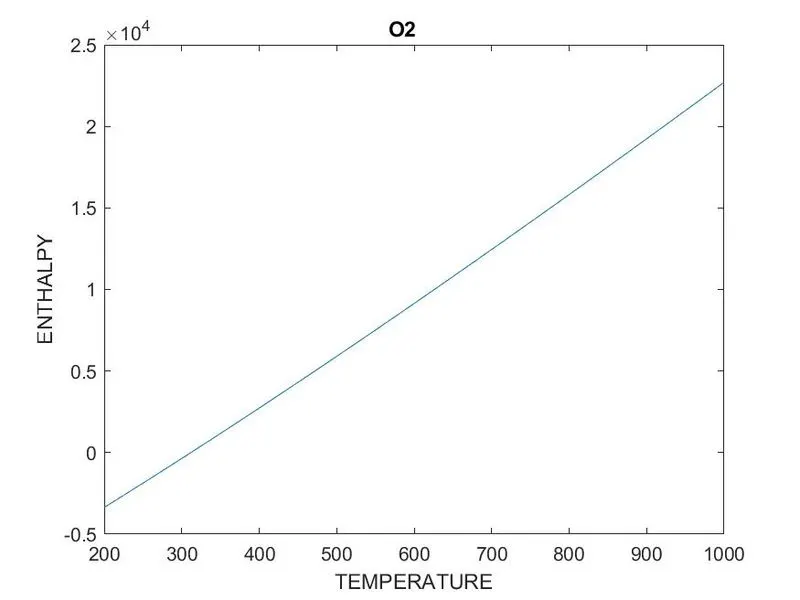
    figure(2)
    plot(t,H)
    data2 = strcat(species_name, 'TEMPERATURE VS ENTHALPY');
    xlabel('TEMPERATURE')
    ylabel('ENTHALPY')
    title(species_name)
    cd(f)
    saveas(gcf,[pwd '/TEMPERATURE VS ENTHALPY.jpg'])
    cd(file)

    %TEMPERATURE VS ENTROPY
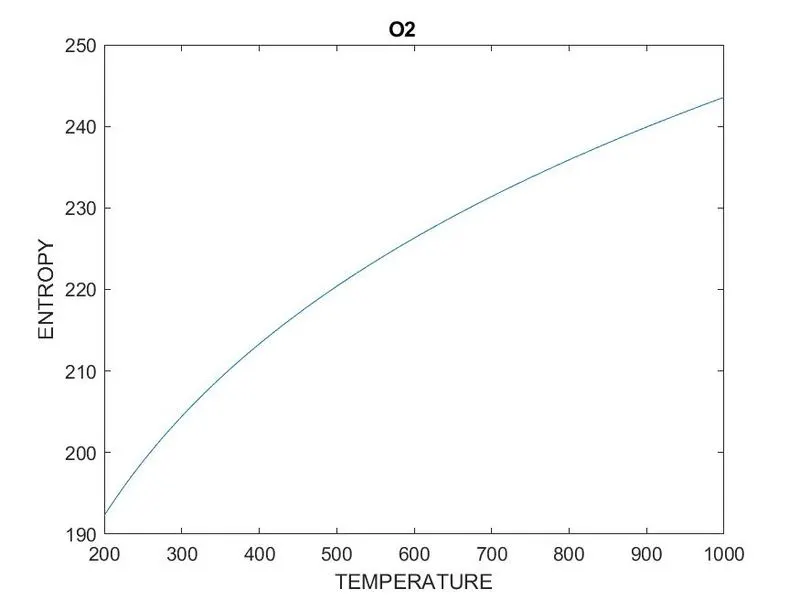
    figure(3)
    plot(t,S)
    data3 = strcat(species_name, 'TEMPERATURE VS ENTROPY');
    xlabel('TEMPERATURE')
    ylabel('ENTROPY')
    title(species_name)
    cd(f)
    saveas(gcf,[pwd '/TEMPERATURE VS ENTROPY.jpg'])
    cd(file)

    %MOLECULAR WEIGHT OF SPECIES
    mol_wt = molecular_mass(comp);


end
fprintf('Molecular Mass of Species Entered (%s) is %d',species_name1,mol_wt)

fclose(f1);
2. CODE FOR MOLECULAR WEIGHT CALCULATION USING SEPARATE FUNCTION
function [mol_wt] = molecular_mass(comp)

%INITIALISING VALUES
mol_wt = 0;
elements = ['C','O','H','N','A'];
atm_wt = [12,16,1,14,40];

%CALCULATING THE MOLECULAR WEIGHT OF EACH SPECIES USING FOR LOOPS
for i = 1:length(comp)
    for j = 1:length(elements)
        if strcmp(comp(i),elements(j))==1
            m(i) = atm_wt(j);
        end
        if str2num(comp(i))>1
            num = str2num(comp(i));
            m(i) = m(i-1)*(num-1);
        end
    end
end

for i = 1:length(m)
    mol_wt = mol_wt+m(i);
end
3. OUTPUTS OBTAINED

O2 PLOTS ARE BELOW
REPORT:
STEP 1: Clearing the screen for previous outputs and getting the inputs required for the Calculation of Molecular Weight of specific species.
- using clr all command screen is cleared
- using input command getting the required species name for calculating the Molecular weight
STEP 2: Opening the data file and reading the header data
- using fopen command open the data file required
- using fget command read data into header variable
STEP 3: Reading the values of Global Temperature range
STEP 4: Reading the Values of Local Temperature range
- using for loop 3 different values of local temperature are stored in variables
STEP 5: Extracting the values of Co-efficients from the read values
- using strfind & str2double the co-efficients are read into different variables
STEP 6: Defining the universal Gas Constant and calculating the values of ENTHALPY, ENTROPY & SPECIFIC HEAT using the given formula.
- using the linspace command temperature range is created
- using the given formula ENTHALPY,ENTROPY & Cp Values are calculated
STEP 7: Creating the directory and storing the Plot images in the same
- In order to store the images of the Plots to be made, a directory is created using the mkdir command
- strcat command is used to concatenate strings
STEP 8: Plotting
- using plot command plots are made between TEMPERATURE & Cp, ENTHALPY, ENTROPY
- using xlabel,ylabel and title commands - the Labels for the axes and the Title are given
STEP 9: Calculating molecular weight of a required species using Function
- using a separate function in which for loops are used to calculate the Molecular Weight of each species
- The strcmp command is used to compare the given 2 strings
- The str2num command is used to convert the string to number and check the condition in the if statement
- another separate for loop is used to add the molecular weight to the initialised value 0
STEP 10: Closing the data file
- the fclose command is used to close the data file