Project 1 - Parsing NASA thermodynamic data
AIM: -
To write a MATLAB code for parsing the NASA thermodynamic data file and to extract 14 coefficients thermodynamic properties like Cp, H and S, for all the species in the data file.
To find out the molecular mass of each species and finally to plot a graph of enthalpy, entropy and Specific heat with respect to temperature.
CODE EXPLANATION: -
The first step is to open the given THERMO.dat file using fopen command and then we will extract all the information provided in the file using fgetl command.
The global temperature is extracted by using strsplit command and then we skip some lines using the fget command.
For loop command is used to get all temperature and coefficients that are present in the file.
For getting temperature and coefficients we use findstr command to know the accurate spot and specifying it so that the data is collected.
The data’s which are obtained from the file will be of string format which we need to convert into numbers by using str2num command. The temperature and coefficient of all the species are obtained.
Now the specific heat, enthalpy, entropy is calculated using the data and for loop.
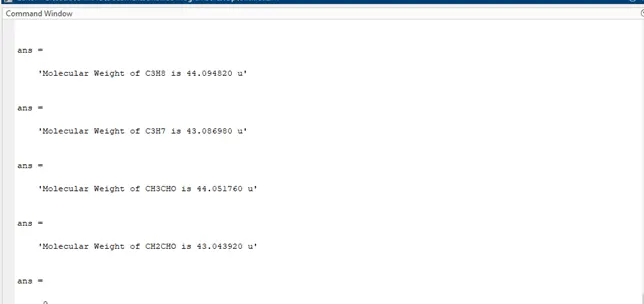
The molecular weight calculation is done by specifying the atomic weight of specific element and then we use for loop. The strcmp is used to compare the element to species name and molecular weight is calculated.
Now we make use of mkdir command to create file for saving species data, in case if the folder exist it will simply save as plot or else it will create a folder to save the plot. The directory is changed using cd command.
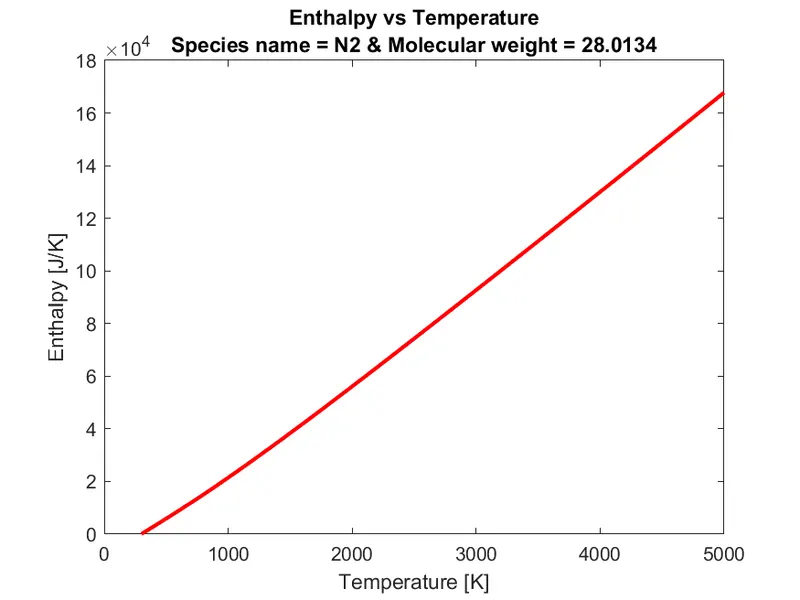
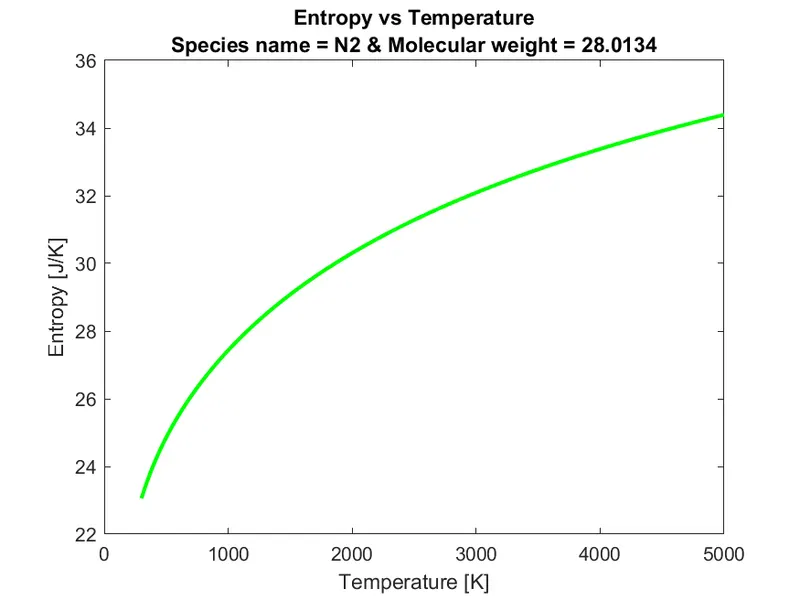
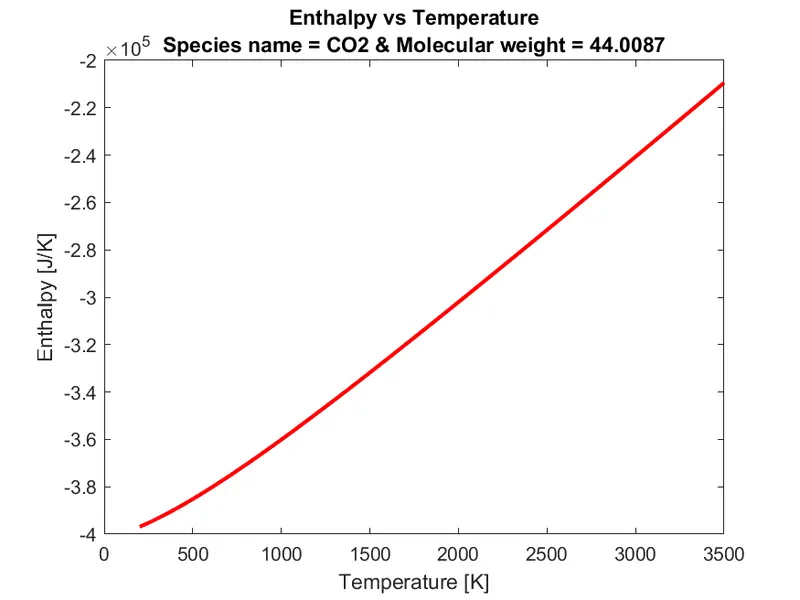
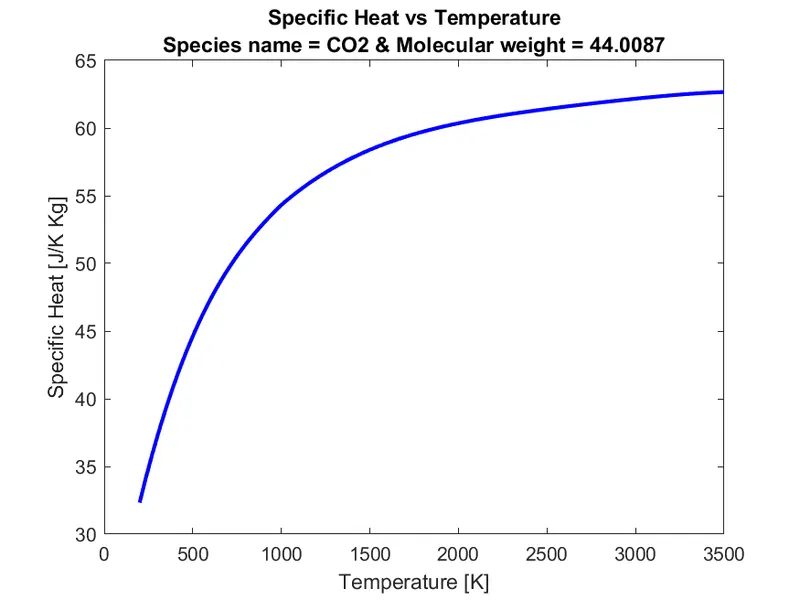
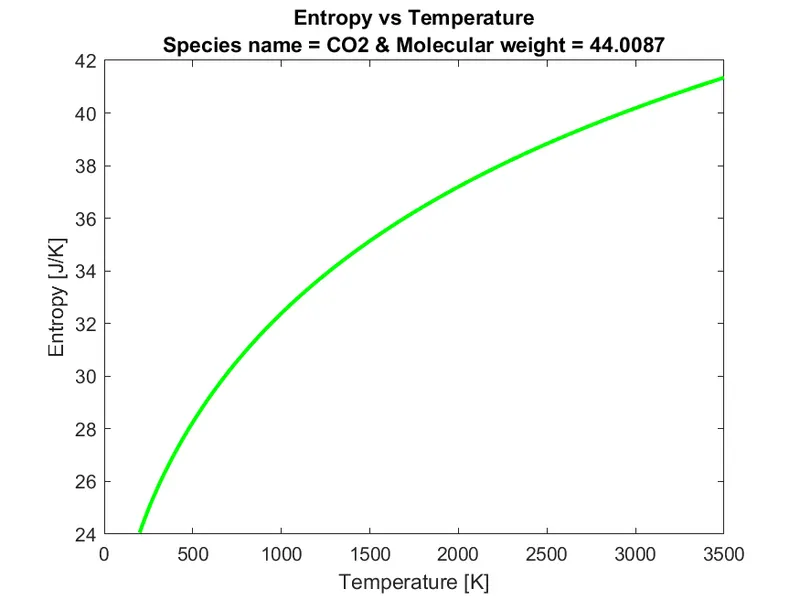
The specific heat, enthalpy, entropy function is calculated and plotted. The three figures are plotted using plot command and each species name is displayed using title command. Xlabel and Ylabel command is used to label the plots then we will save the plots as our images using save command.
In the end we close the file using fclose command.
clear all
close all
clc

f1=fopen('THERMO.dat','r');
fgetl(f1);
tline=fgetl(f1);
A=strsplit(tline,' ');
Global_low_temp= str2num(A{2})
Global_mid_temp=str2num(A{3})
Global_high_temp=str2num(A{4})


for i=3:5
    b=fgetl(f1);
end

for i = 1:53
    % Extract the name of gas species
    A = fgetl(f1);
    % Spliting the string
    z = strsplit(A,' ');
    % Reading the names of species
    species_name= z{1};
    % Extracting local temperatures of gas species
    a = findstr(A,'.');
    t1 = A((a(1)-3):a(1)+3);
    % Assigning variable
    t1 = str2num(t1);
    % Converting string to number
    t2 = A(a(3)-4:a(3)+3);
    t2 = str2num(t2);
    t3 = A(a(2)-4:a(2)+3);
    t3 = str2num(t3);
    % t1 = Low Temperature
    % t2 = Mid Temperature
    % t3 = High Temperature
    % Extracting co-efficient of gas species
    B = fgetl(f1);
    b = findstr(B,'E');
    % Assigning 'a' variable for the temperature co-efficients
    a1 = B(1:b(1)+3);
    a1 = str2num(a1);
    a2 = B(b(1)+4:b(2)+3);
    a2 = str2num(a2);
    a3 = B(b(2)+4:b(3)+3);
    a3 = str2num(a3);
    a4 = B(b(3)+4:b(4)+3);
    a4 = str2num(a4);
    a5 = B(b(4)+4:b(5)+3);
    a5 = str2num(a5);
    C = fgetl(f1);
    c = findstr(C,'E');
    a6 = C(1:c(1)+3);
    a6 = str2num(a6);
    a7= C(c(1)+4:c(2)+3);
    a7 = str2num(a7);
    a8 = C(c(2)+4:c(3)+3);
    a8 = str2num(a8);
    a9 = C(c(3)+4:c(4)+3);
    a9 = str2num(a9);
    a10 = C(c(4)+4:c(5)+3);
    a10 = str2num(a10);
    D = fgetl(f1);
    d = findstr(D,'E');
    a11 = D(1:d(1)+3);
    a11 = str2num(a11);
    a12 = D(d(1)+4:d(2)+3);
    a12 = str2num(a12);
    a13 = D(d(2)+4:d(3)+3);
    a13 = str2num(a13);
    a14 = D(d(3)+4:d(4)+3);
    a14 = str2num(a14);

% First 7 from a1 to a7 are high temperature co-efficients
% Second 7 from a8 to a14 are low temperature co-efficients

% Creating local temperatures values

T = linspace(t1,t3,1000);
R = 8.314;

% Universal gas constant in j/mol.k

% Calculation for Specific heat, Enthalpy and Entropy

for i = 1:length(T)
    if T(i)>t2
        Cp(i) = (a1 + a2.*T(i) + a3.*T(i).^2 + a4.*T(i).^3 + a5.*T(i).^4)*R;
        H(i) = (a1 + (a2.*T(i))/2 + (a3.*T(i)^2)/3 + (a4.*T(i).^3)/4 + (a5.*T(i).^4)/5 + (a6./T(i)))*R.*T(i);
        S(i) = a1.*log(T(i)) + a2.*T(i) + (a3.*T(i)^2)/2 + (a4.*T(i)^3)/3 + (a5.*T(i).^4)/4 + a7;
    else
        Cp(i) = (a8 + a9.*T(i) + a10.*T(i).^2 + a11.*T(i).^3 + a12*T(i).^4)*R;
        H(i) = (a8 + (a9.*T(i))/2 + (a10.*T(i).^2)/3 + (a11.*T(i).^3)/4 + (a12.*T(i).^4)/5 + (a13./T(i)))*R.*T(i);
        S(i) = a8.*log(T(i)) + a9.*T(i) + (a10.*T(i)^2)/2 + (a11.*T(i)^3)/3 + (a12.*T(i).^4)/4 + a14;
    end
end

    % Molecular weight calculation
elements = ['A','C','H','O','N','S'];
% Declaring species elements
atomic_weight = [39.948 12.0107 1.00784 15.999 14.0067 32.065];
% Declaring the atomic weight value
mol_mass = 0;
% Declaring molecular weight to be '0' in initial stage
for l = 1:length(species_name)
    for m = 1:length(elements)
        if strcmp(species_name(l), elements(m))
            mol_mass = mol_mass + atomic_weight(m);
            position=m;
        end
    end
    n=str2double(species_name(l));
    if n>1
      mol_mass = mol_mass + atomic_weight(position)*(n-1);
    end
end

% Printing the molecular weight of the gas species in the command window
sprintf('Molecular Weight of %s is %f u',species_name,mol_mass)
% Creating a folder to save the plots
mkdir('C:\Users\CHIRAG\Documents\Matllab Programs\Test\fp\Species',species_name)
% Creating a folder inside the species folder
program = (['C:\Users\CHIRAG\Documents\Matllab Programs\Test\fp\Species\',species_name]);
cd(program)
% Changing the directory to the folder of the species name
% Plotting specific heat vs temperature
figure(1)
plot (T,Cp, 'color','b','linewidth',2)
xlabel('Temperature [K]')
ylabel('Specific Heat [J/K Kg]')
title({'Specific Heat vs Temperature',['Species name = ',species_name,' & Molecular weight = ',num2str(mol_mass)]});
saveas(figure(1),'Cp vs Temp.png')
% Plotting enthalpy vs temperature
figure(2)
plot (T,H, 'color', 'r','linewidth',2)
xlabel('Temperature [K]')
ylabel('Enthalpy [J/K]')
title({'Enthalpy vs Temperature',['Species name = ',species_name,' & Molecular weight = ',num2str(mol_mass)]});
saveas(figure(2),'Enthalpy vs Temp.png')
% Plotting entropy vs temperature
figure(3)
plot (T,S, 'color', 'g','linewidth',2)
xlabel('Temperature [K]')
ylabel('Entropy [J/K]')
title({'Entropy vs Temperature',['Species name = ',species_name,' & Molecular weight = ',num2str(mol_mass)]});
saveas(figure(3),'Entropy vs Temp.png')
end
fclose(f1)
ERROR FACED
Typo mistakes.
Using normal brackets in place of curly brackets.
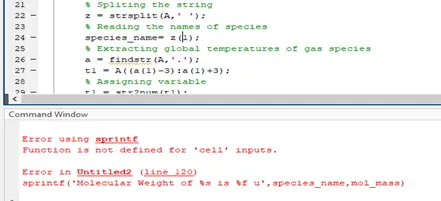
Missing \ while specifying folder location.
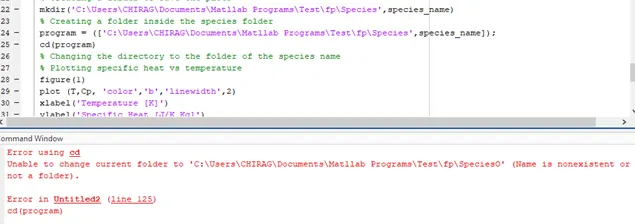
Steps taken to overcome error
Typing mistakes were corrected.
Curly brackets used correctly.
Location mentioned correctly.
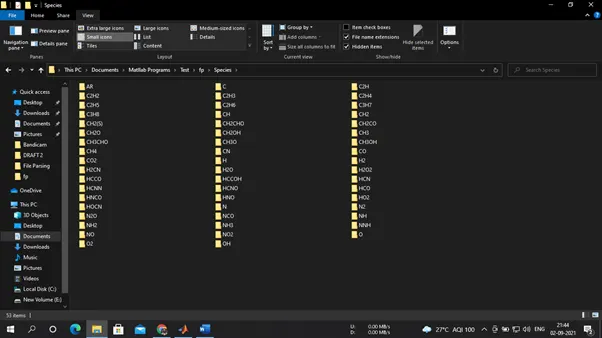
Saved location of all the species.
O2 plot:
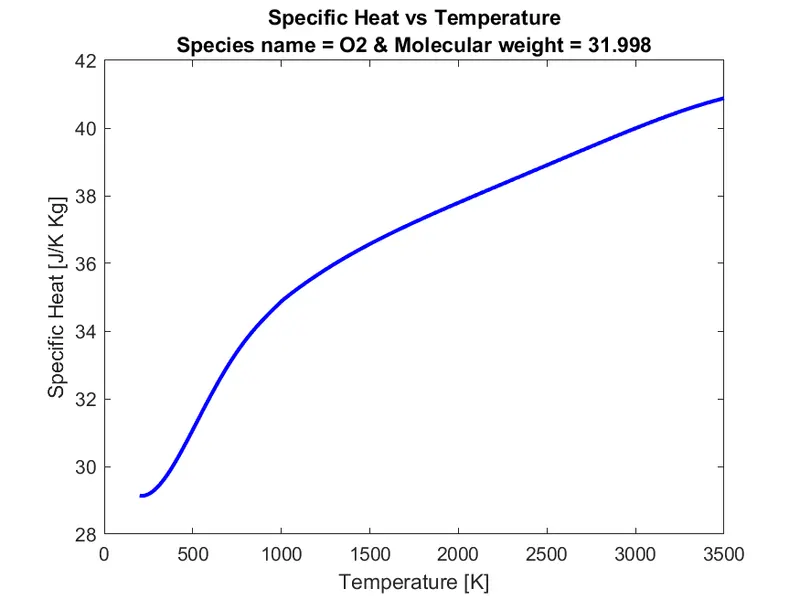
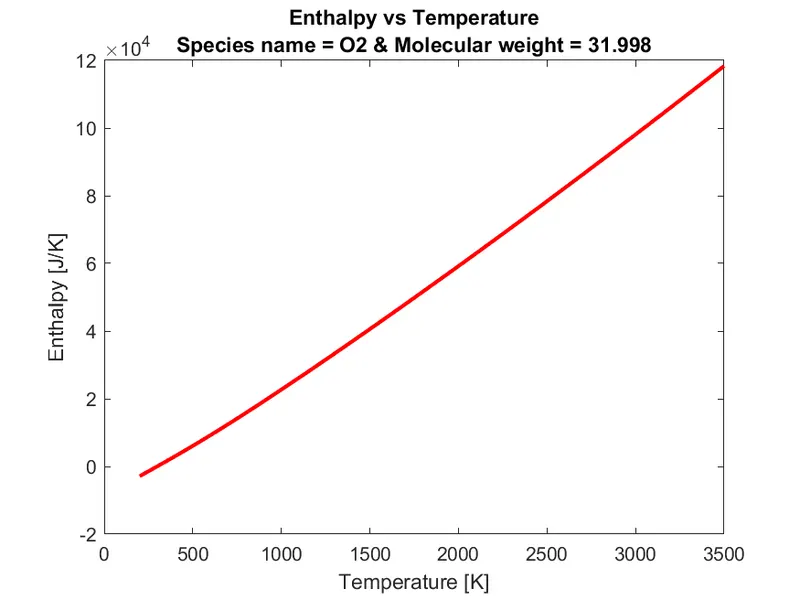
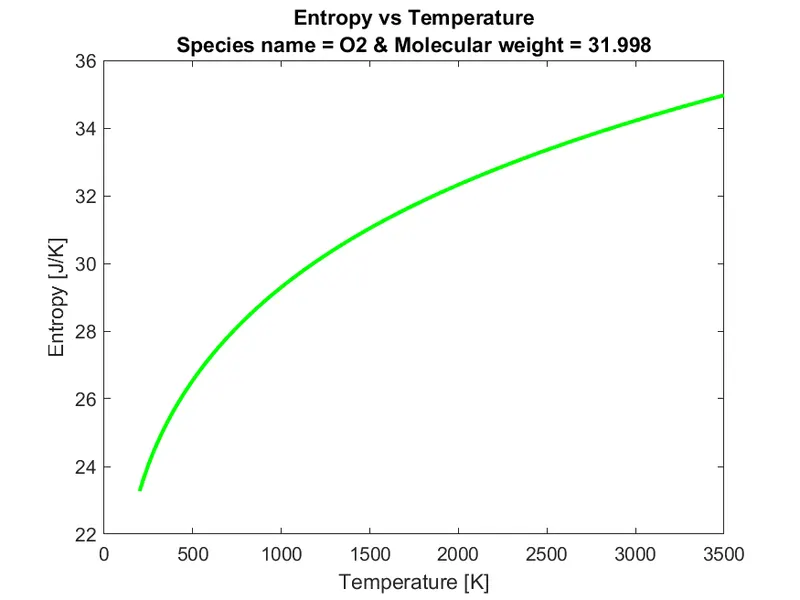
N2 plot:
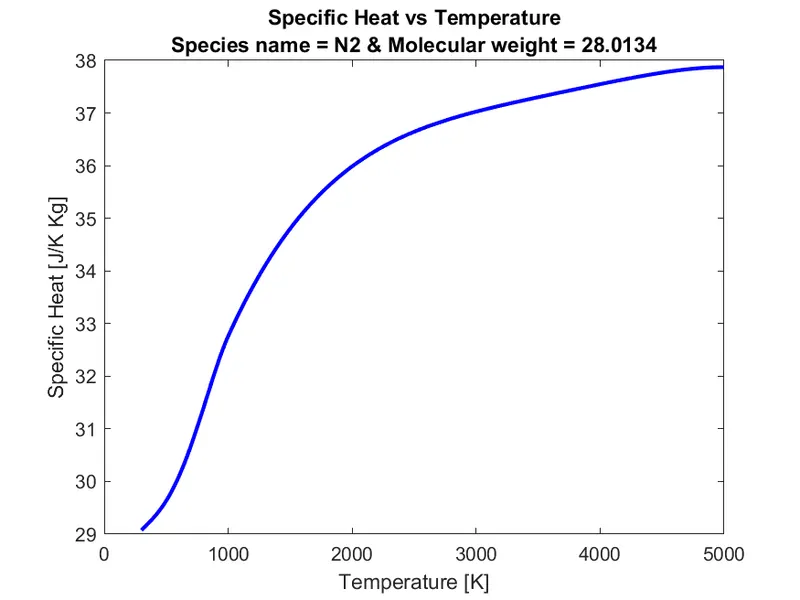
Co2 plot:
Molecular weight of species in command