Project 1 - Parsing NASA thermodynamic data
AIM- To write a function that extracts the 14 co-efficients and calculates the enthalpy, entropy and specific heats for all the species in the given NASA data file.
INTRODUCTION- NASA came up with polynomials that can be used to evaluate thermodynamic properties such as Cp, H and S. They have also documented the co-efficients that are required to evaluate these polynomials for 1000+ species. So in this project we are going to extract all those given coefficients for each specie, and use them to make formulas and plots.

In the above given formula of specific heat, enthalpy and entropy the variable 'a' defines the coefficient in the given (https://drive.google.com/file/d/1AikCHDlz9s_fu8whE81qee_GD4AyYpCP/view?usp=sharing) NASA file that we have to extract.
OBJECTIVE-
- To calculate the molecular weight of each species and display it in the command window.
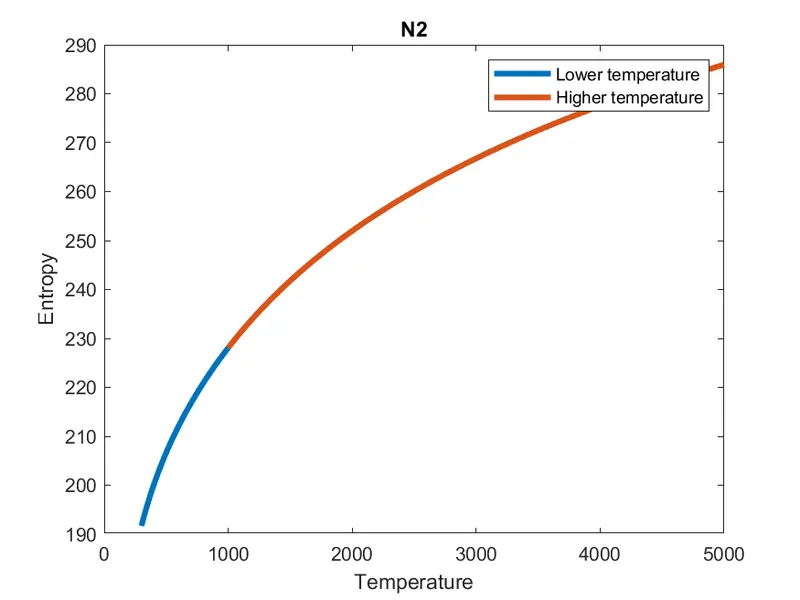
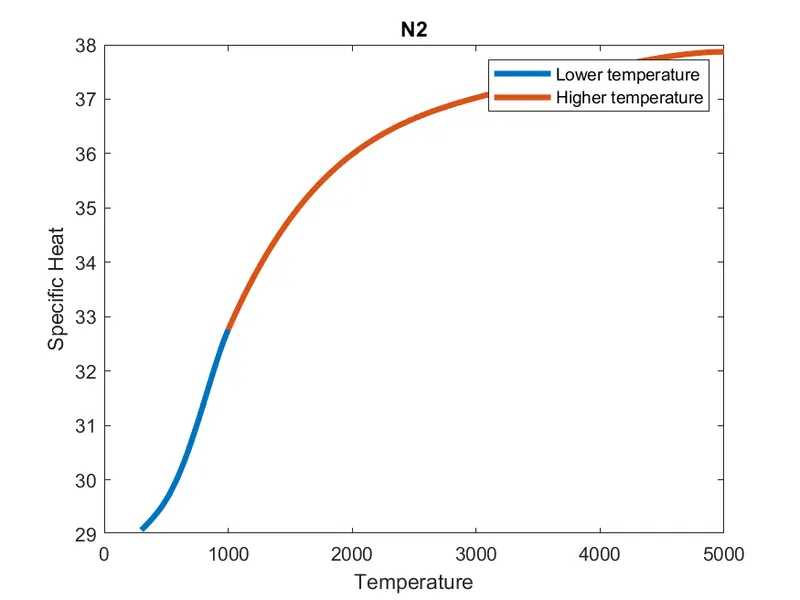
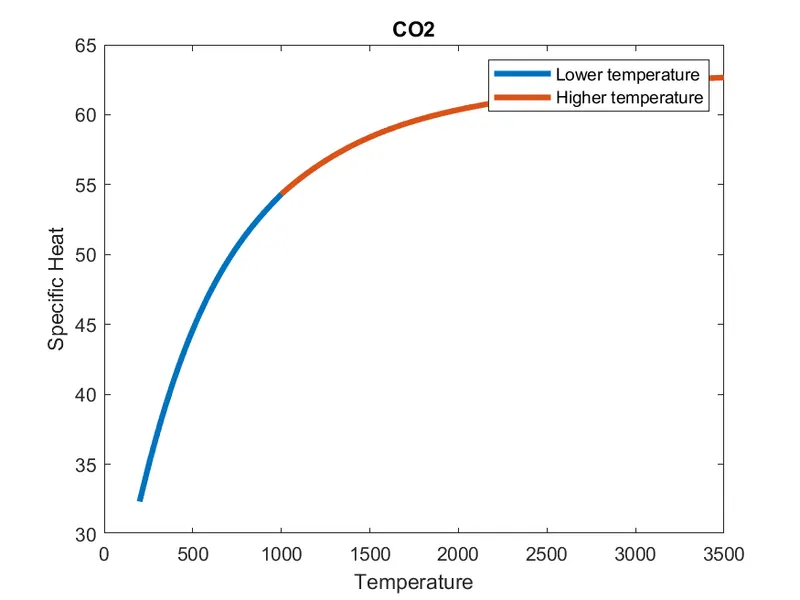
- To plot the Cp, Enthalpy and Entropy for the local temperature range (low temperature : high temperature) specific for each species.
- To save the plots as images with appropriate names and dump them in separate folders for each species with suitable name generating automatically.
- To write a detailed report to describe the logic.
- To attach the screenshot of the window where all the folders are saved.
- To plot for o2, N2 and Co2 species.
SAMPLE CODE-
clear all
close all
clc

%First of all click on the link that is given in the challenge then
%download it.
%Then use the following command to make read it to matlab with the same
%name of the downloaded one
f1=fopen('THERMO.dat','r')
%To skip the line
fgetl(f1)
A=fgetl(f1)
%To split the each word or number with 'space' in order to easily identify
%their position
a=strsplit(A,' ')
%assigning the global temperature values to the variables
global_low_temp=str2num(a{2})
global_mid_temp=str2num(a{3})
global_high_temp=str2num(a{4})
%performing loop to skip the next 3 comments
for i=1:3
    fgetl(f1)
end
%Again performing the loop for all the species as it will save much time
for i=1:100
%entering the first specie
B=fgetl(f1)
b=strsplit(B,' ')
%assigning the value for each given specie
species_name=b{1}
%assigning the values for given local temperature of each specie and also
%converting them to number format
local_low_temp=str2num(b{end-3})
local_mid_temp=str2num(b{end-1})
local_high_temp=str2num(b{end-2})
%Now coming to line 1
line1=fgetl(f1)
%this command is used to find out the position of E in the form of numbers
%in order to calculate the postions of every coefficient
a1=findstr(line1,'E')
%since we found the pattern of every coefficient, we are simultaneously
%converting them to number format
c1=str2double(line1(1:a1(1)+3))
c2=str2double(line1(a1(1)+4:a1(2)+3))
c3=str2double(line1(a1(2)+4:a1(3)+3))
c4=str2double(line1(a1(3)+4:a1(4)+3))
c5=str2double(line1(a1(4)+4:a1(5)+3))
%coming to line 2
line2=fgetl(f1)
a2=findstr(line2,'E')
c6=str2double(line2(1:a2(1)+3))
c7=str2double(line2(a2(1)+4:a2(2)+3))
c8=str2double(line2(a2(2)+4:a2(3)+3))
c9=str2double(line2(a2(3)+4:a2(4)+3))
c10=str2double(line2(a2(4)+4:a2(5)+3))
%coming to line 3
line3=fgetl(f1)
a3=findstr(line3,'E')
c11=str2double(line3(1:a3(1)+3))
c12=str2double(line3(a3(1)+4:a3(2)+3))
c13=str2double(line3(a3(2)+4:a3(3)+3))
c14=str2double(line3(a3(3)+4:a3(4)+3))
%now creating the lower temperature range and higher temperature range
%resp. to calculate the formula
t=linspace(local_low_temp,local_mid_temp,100)
T=linspace(local_mid_temp,local_high_temp,100)
%Assuming the Universal Gas Constant value as standard value that is
%considered universally
R=8.314

%Again performing loop to calculate the formula for each specie with first
%7 coefficients with higher temperature
for j=1:100
    CP1(j)=(c1+c2*T(j)+c3*T(j).^2+c4*T(j).^3+c5*T(j).^4)*R
    H1(j)=(c1+((c2*T(j))/2)+ ((c3*T(j).^2)/3) + ((c4*T(j).^3)/4) + (c5*T(j).^4)/5 + c6/T(j))*R*T(j)
    S1(j)=(c1*log(T(j))+c2*T(j)+((c3*T(j).^2)/2)+((c4*T(j).^3)/3)+((c5*T(j).^4)/4)+c7)*R
end
%performing loop to calculate the formula for each specie with last
%7 coefficients with lower temperature
for k=1:100
   CP2(k)=(c8+c9*t(k)+c10*t(k).^2+c11*t(k).^3+c12*t(k).^4)*R
    H2(k)=(c8+((c9*t(k))/2)+ ((c10*t(k).^2)/3) + ((c11*t(k).^3)/4) + (c12*t(k).^4)/5 + c13/t(k))*R*t(k)
    S2(k)=(c8*log(t(k))+c9*t(k)+((c10*t(k).^2)/2)+((c11*t(k).^3)/3)+((c12*t(k).^4)/4)+c14)*R
end

NASA_parsing=species_name;
%making the seperate folder to save all the species graphs into new folder
mkdir(NASA_parsing);
current_dir=pwd;
%changing the directory to this new folder
cd(NASA_parsing);

%Now plotting occurs
%Temp. vs specific heat with lower temperature and higher temperature
figure(1)
plot(t,CP2,'linewidth',3)
hold on
plot(T,CP1,'linewidth',3)
hold off
%assigning the plots' title as their species name
title(species_name)
xlabel('Temperature')
ylabel('Specific Heat')
legend('Lower temperature','Higher temperature')
fig=sprintf('Specific heat of %s.png',species_name)
%to save the images
saveas(gca,fig)

%Temp vs Enthalpy with lower temperature and higher temperature
figure(2)
plot(t,H2,'linewidth',3)
hold on
plot(T,H1,'linewidth',3)
hold off
%assigning the plots' title as their species name
title(species_name)
xlabel('Temperature')
ylabel('Enthalpy')
legend('Lower temperature','Higher temperature')
fig=sprintf('Enthalpy of %s.png',species_name)
%to save the images
saveas(gca,fig)

%Temp vs Entropy with lower temperature and higher temperature
figure(3)
plot(t,S2,'linewidth',3)
hold on
plot(T,S1,'linewidth',3)
hold off
%assigning the plots' title as their species name
title(species_name)
xlabel('Temperature')
ylabel('Entropy')
legend('Lower temperature','Higher temperature')
fig=sprintf('Entropy of %s.png',species_name)
%to save the images
saveas(gca,fig)
%now changing back the directory to its previous one
cd(current_dir)
mol_wt= molecular_weight(species_name);
end
FUNCTION FOR mol_wt-
function mol_wt= molecular_weight(species_name)
atoms=['H','C','O','N','R','S']
atomic_wt=[1 12.01 16 14 39.94 32.06]
mol_wt=0
mol_sp=char(species_name);
for i=1:length(mol_sp)
    for j=1:length(atoms)
        if strcmp(mol_sp(i),atoms(j))
            mol_wt=mol_wt+atomic_wt(j)
            position=j
        end
    end
    n=str2double(mol_sp(i))
    if n>1
        mol_wt=mol_wt+atomic_wt(position)*(n-1)
    end
    fprintf('Molecular weight of %s = %f',species_name,mol_wt)
end
OUTPUTS-
1. Screenshots where all the folders saved-

PLOTS FOR O2-
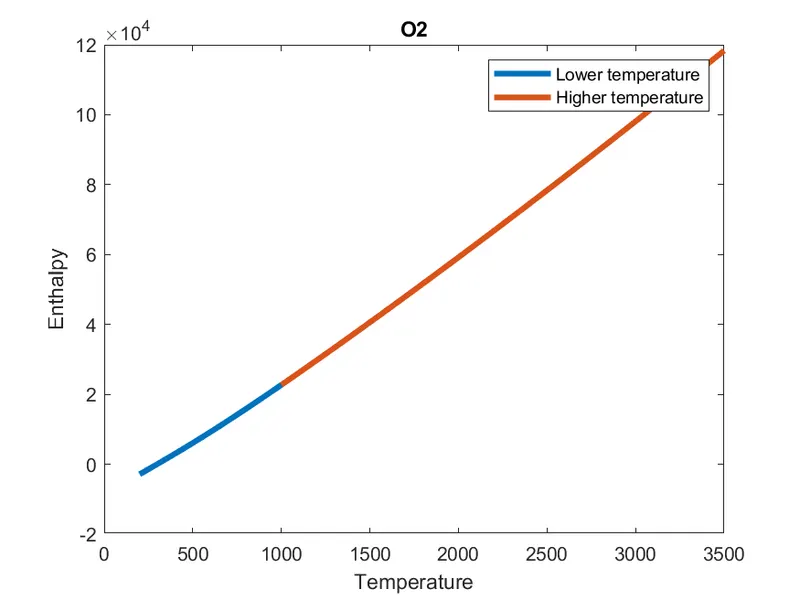
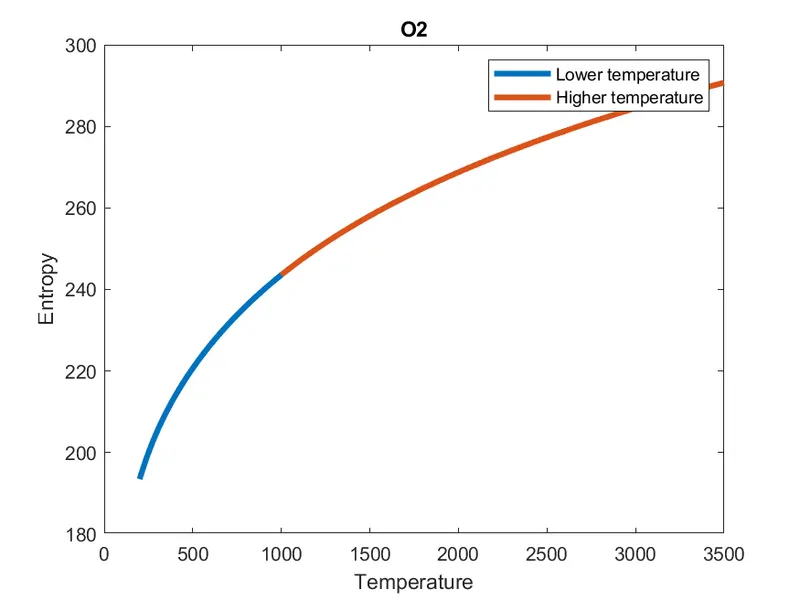
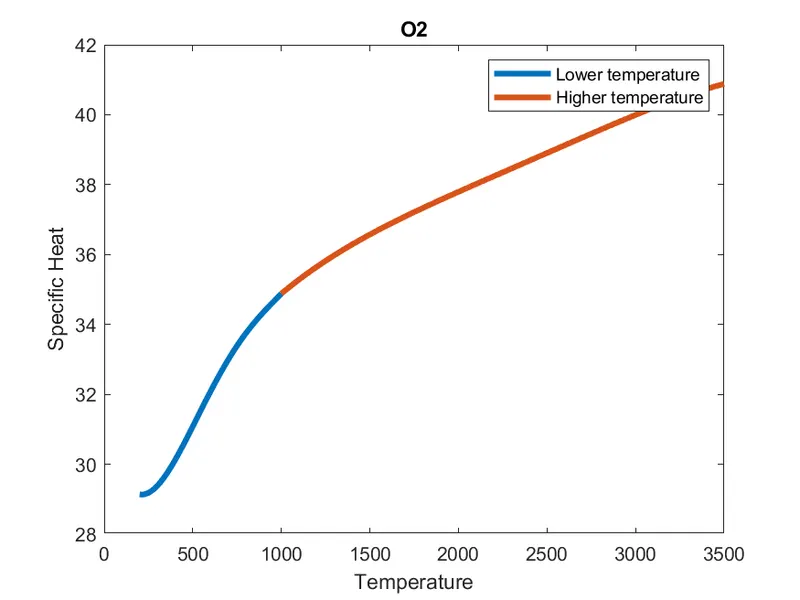
PLOTS FOR N2 -
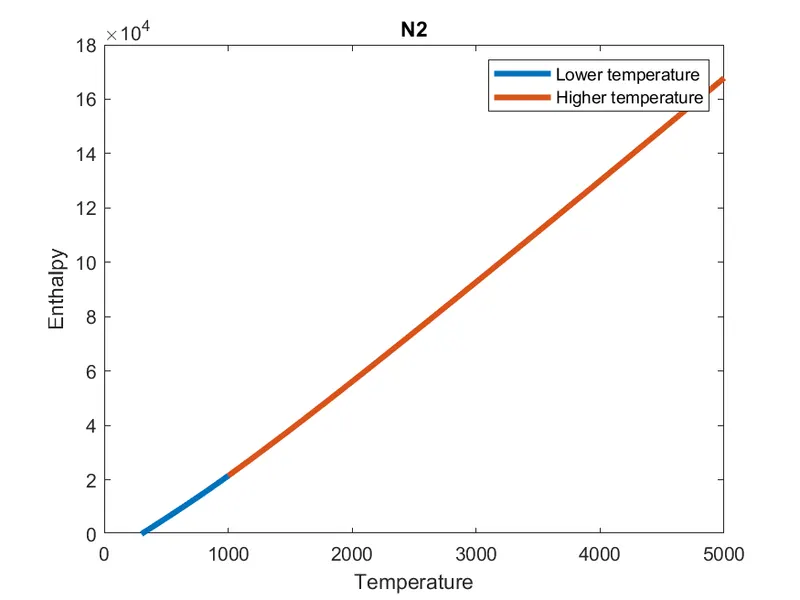
PLOTS FOR Co2 -
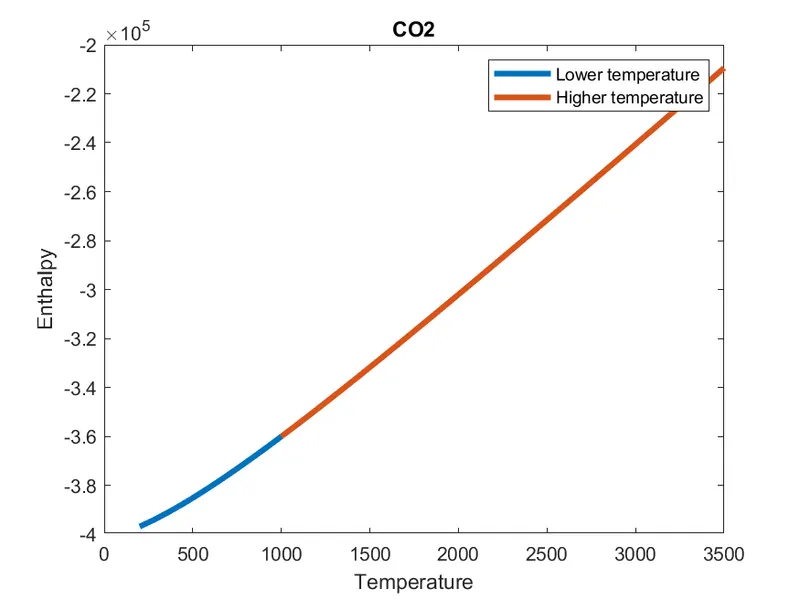
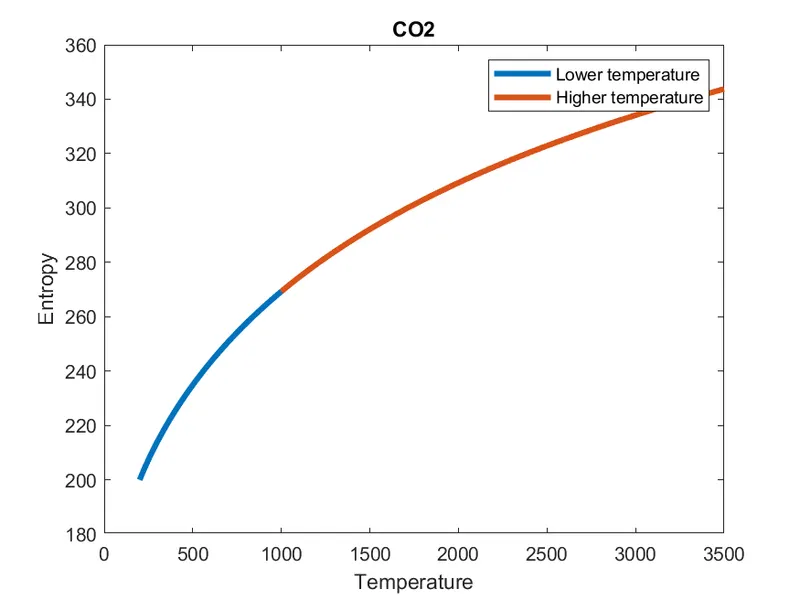
Errors faced while coding- There was no such major errors faced, only minor errors faced all during coding due to silly mistakes.
REFERENCES-
- https://in.mathworks.com/
- youtube.com
- wikipedia.com