Project 1 - Parsing NASA thermodynamic data
Aim :
- Write a function that extracts the 14 co-efficients and calculates the enthalpy, entropy and specific heats for all the species in the data file
Objective :
- Calculate the molecular weight of each species and display it in the command window.
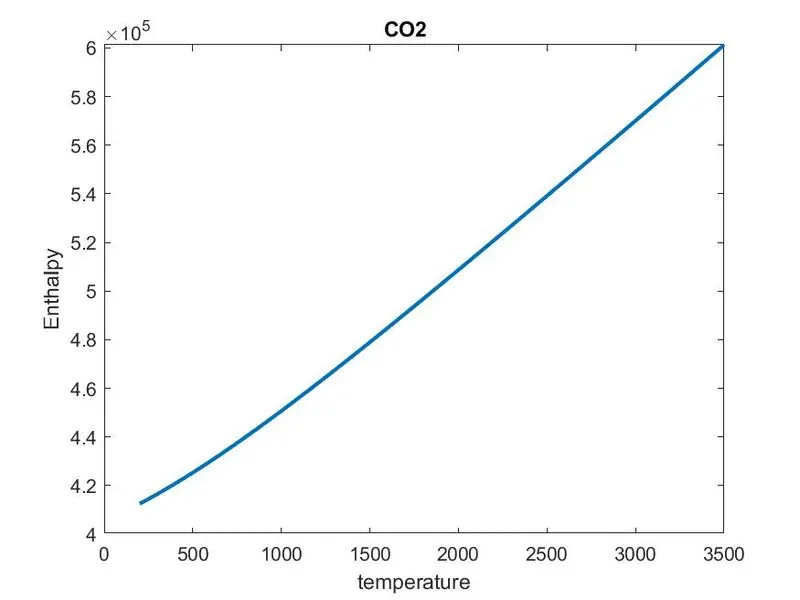
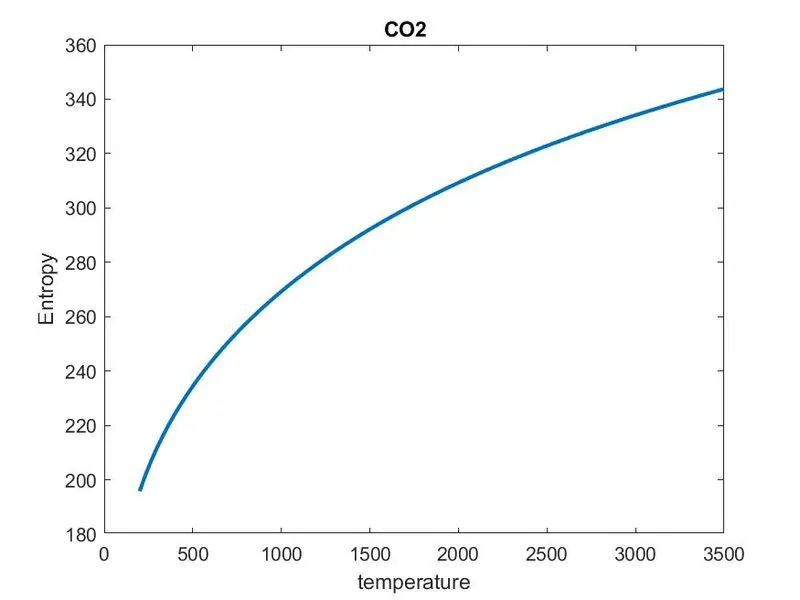
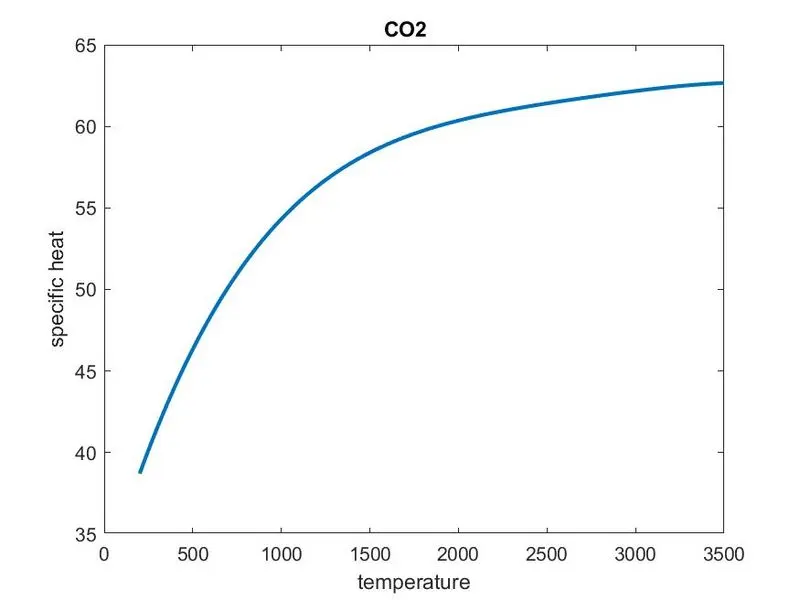
- Plot the Cp, Enthalpy and Entropy for the local temperature range (low temperature : high temperature) specific for each species.
- Save the plots as images with appropriate names and dump them in separate folders for each species with suitable name.
- All these should be generated automatically.The main program that you will submit will just take the "THERMO.dat" file as an input and generate Cp, H and S plots.
File Parsing in computer languages refers to syntactic analysis of the input data normally from a file into its components parts in order to facilitate the writing of compilers and interpreters. It can be used to describe split or separation.
formulae:
specific heat
`Cp = (cf1 + cf2.*T + cf3.*T.^2 + cf4.*T.^3 + cf5.*T.^4).*R`
enthalpy
`H = (cf1 + ((cf2.*T)./2)+ ((cf3.*T.^2)./3) + ((cf4.*T.^3)./4) + ((cf5.*T.^4)./5) + ((cf6)./T)).*(R.*T)`
entropy
`S = (cf1.*log(T) + cf2.*T + ((cf3.*T.^2)./2) + ((cf4.*T.^3)./3) + ((cf5.*T.^4)./4) + cf7).*R`
Where,
Cp = specific heat (j)
cf1,cf2,cf2....cf14 = numerical coefficients
R = Universal gas constant (8.314 j/mol k)
T = temperature
H = Enthalpy (j/kg)
S = Entropy (j/kg k)
way of using these numerical coefficients is The FIRST 7 coefficients are HIGH-temperature coefficients and the SECOND 7 coefficients are LOW-temperature coefficients.
#Enthaply ,Entropy and Specific heat calculation function :
function [Cp,H,S]= solve_equation_01(T,R,tm,cf1,cf2,cf3,cf4,cf5,cf6,cf7,cf8,cf9,cf10,cf11,cf12,cf13,cf14)

for i = 1:length(T)
    if T(i) > tm
        % specific heat
        Cp = (cf1 + cf2.*T + cf3.*T.^2 + cf4.*T.^3 + cf5.*T.^4).*R;
        % enthalpy
         H = (cf1 + ((cf2.*T)./2)+ ((cf3.*T.^2)./3) + ((cf4.*T.^3)./4) + ((cf5.*T.^4)./5) + ((cf6)./T)).*(R.*T);
        % entropy
         S = (cf1.*log(T) + cf2.*T + ((cf3.*T.^2)./2) + ((cf4.*T.^3)./3) + ((cf5.*T.^4)./4) + cf7).*R;

    else
        % specific heat
        Cp = (cf8 + cf9.*T + cf10.*T.^2 + cf11.*T.^3 + cf12.*T.^4).*R;
        % enthalpy
         H = (cf8 + ((cf9.*T)./2) + ((cf10.*T.^2)./3) + ((cf11.*T.^3)./4) + ((cf12.*T.^4)./5) + ((cf13)./T)).*(R.*T);
        % entropy
         S = (cf8.*log(T) + cf9.*T + ((cf10.*T.^2)./2) + ((cf11.*T.^3)./3) + ((cf12.*T.^4)./4) + cf14).*R;
    end
end
Explaination of code :
in above code we created the function to calculate the ehtalpy,entropy and specific heat .
in above function required some input as T (ranges between high local temp to low local temp ),tm (middle local temp) and cf1,cf2,cf3,cf4....cf14 (numwrical coefficients).
by using for it goes throught the temp range ,if temp greater than middle temp calculate the Cp,H,S for first 7 numerical coefficients cf1,cf2...cf7.else it calculate for next 7 coefficients cf8,...cf14.
#molecular weight calculation function :
function molecular_weight = molecular_weight_calculation(s_name)
species = s_name;
element = ['H','c','O','N','A','S'];
atomic_weight = [1.00794,12.0107,15.999,14.0067,39.948,32];
molecular_weight = 0;
for i = 1:length(species)
    for j = 1:length(element)
        if strcmp(species(i),element(j))
            molecular_weight = molecular_weight + atomic_weight(j);
            a=j;
         end
    end
 n=str2double(species(i));
 if n>1
     molecular_weight = molecular_weight + atomic_weight(a)*(n-1);

 end
end
end
Explaination of code :
therotical process of calculating the molecular weight is get the atomic weight of single atom and add them that gives the molecular weight.
in above code ,created the molecular weight calculation function which take species name as input and gives output as molecular weight.
store single elements and there atomic weight.
using for loop limit upto the length of species it run the loop and goes to j loop run upto length element. then we comapre both element and element using strcmp function if both are same code executed in if block.
then execute the second if block where n>1 it run that block and gives the ouput as molecular weight.
#Main program:
clear all
close all
clc

%%getting global temp

f1 = fopen('THERMO.dat','r');
fgetl(f1);
line02 = fgetl(f1);
temp = strsplit(line02,' ');
global_low_tmp = str2num(temp{2});
global_mid_tmp = str2num(temp{3});
global_high_tmp= str2num(temp{4});

%comments which are started with !
for i=3:5
    l = fgetl(f1);
end


for i = 1:3
% getting temp from line or local temperature
  disp(i)
  tline=fgetl(f1);
  % variable for getting species name
  s_name = tline(1:6);
  pos = strfind(tline,'.');
  %local low temp
  tl = tline(pos(1)-3:pos(1)-1);
  tl = str2num(tl);
  %local high temp
  th = tline(pos(2)-4:pos(2)-1);
  th = str2num(th);
  %local mid temp
  tm = tline(pos(3)-4:pos(3)-1);
  tm = str2num(tm);

%coefficients from species
%line 2
  tline2 = fgetl(f1);
  pos2 = strfind(tline2,'E');
  cf1 = tline2(2:pos2(1)+3);
  cf1 = str2num(cf1);
  cf2 = tline2(pos2(1)+4:pos2(2)+3);
  cf2 = str2num(cf2);
  cf3 = tline2(pos2(2)+4:pos2(3)+3);
  cf3 = str2num(cf3);
  cf4 = tline2(pos2(3)+4:pos2(4)+3);
  cf4 = str2num(cf4);
  cf5 = tline2(pos2(4)+4:pos2(5)+3);
  cf5 = str2num(cf5);
%line3
  tline3 = fgetl(f1);
  pos3 = strfind(tline3,'E');
  cf6 = tline3(2:pos3(1)+3);
  cf6 = str2num(cf6);
  cf7 = tline3(pos3(1)+4:pos3(2)+3);
  cf7 = str2num(cf7);
  cf8 = tline3(pos3(2)+4:pos3(3)+3);
  cf8 = str2num(cf8);
  cf9 = tline3(pos3(3)+4:pos3(4)+3);
  cf9 = str2num(cf9);
  cf10 = tline3(pos3(4)+4:pos3(5)+3);
  cf10 = str2num(cf10);
%line4
  tline4 = fgetl(f1);
  pos4 = strfind(tline4,'E');
  cf11 = tline4(1:pos4(1)+3);
  cf11 = str2num(cf11);
  cf12 = tline4(pos4(1)+4:pos4(2)+3);
  cf12 = str2num(cf12);
  cf13 = tline4(pos4(2)+4:pos4(3)+3);
  cf13 = str2num(cf13);
  cf14 = tline4(pos4(3)+4:pos4(4)+3);
  cf14 = str2num(cf14);

  % calculating the specific heat(Cp),enthalpy(H),entropy(S)
  T = linspace(tl,th,100);
  R = 8.314;
 [Cp,H,S] = solve_equation_01(T,R,tm,cf1,cf2,cf3,cf4,cf5,cf6,cf7,cf8,cf9,cf10,cf11,cf12,cf13,cf14);

 % making a folder named as species
  mkdir('E:\skill lync\MATLAB\PROJECT 1\species',s_name)

 % ploting

  figure(1)
  plot(T,Cp,'linewidth',2,'g');
  xlabel('temperature');
  ylabel('specific heat');
  title(s_name);

  figure(2)
  plot(T,H,'linewidth',2,'b');
  xlabel('temperature');
  ylabel('Enthalpy');
  title(s_name);

  figure(3)
  plot(T,S,'linewidth',2,'m');
  xlabel('temperature');
  ylabel('Entropy');
  title(s_name);

  program = (['E:\skill lync\MATLAB\PROJECT 1\species\',s_name]);
  % cd goes into the file
  cd(program)
  % save figures in file s_name
  saveas(figure(1),'specific heat.jpg');
  saveas(figure(2),'enthalpy.jpg');
  saveas(figure(3),'entropy.jpg');
  % change the location
  cd('E:\skill lync\MATLAB\PROJECT 1')

  %calculate molecular weight
  molecular_weight = molecular_weight_calculation(s_name)
end

fclose(f1)
Explaination of code :
- open the file using the function fopen and read the data from the THERMO.dat file.
- fgetl function ,it read and dispaly the file of fielID.m one line at a time
- we want second line data again use fgetl with variable as line02 to acess the data on that line.using strplit split the data with dilimiter of spces in number.fetch the temp number with respect to their position str2num convert into string to number or intiger.
- using the for loop run fgetl 3 times which are the commment lines.
- for loop execute loop 53 times because we have 53 species and each species contains 4 line of data.
- in that loop using fgetl fetch to first line get local temp data and species name.again run the second line get cf (numerical coeifficient data).
- executing fgetl we fetch we next 2 line and get the cf data.
- made temp range in between low and high temp as variable T.
- call the solve_equation function
- species named folder is made using mkdir
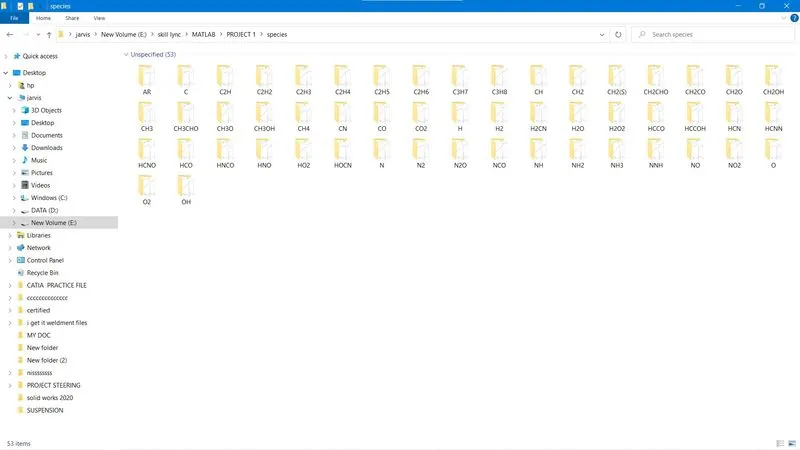
- in the made the file name of species,in that file figures are ploted.figures are saved using saveas function
- change the file location
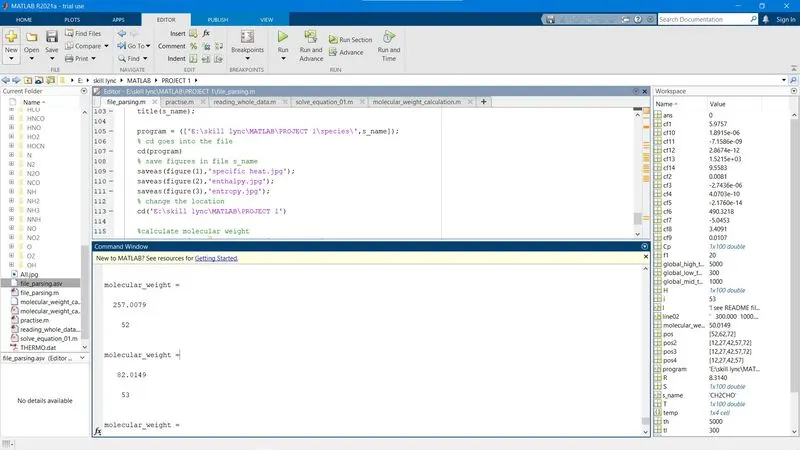
- then call the molecular weight function.
- close the file outside the for loop using fclose
screenshot of all folder:
molecular weight screenshot:
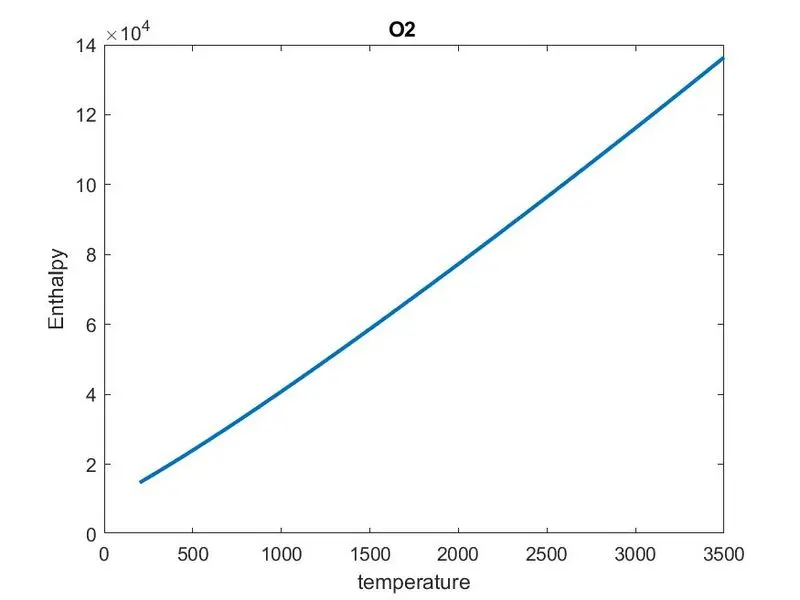
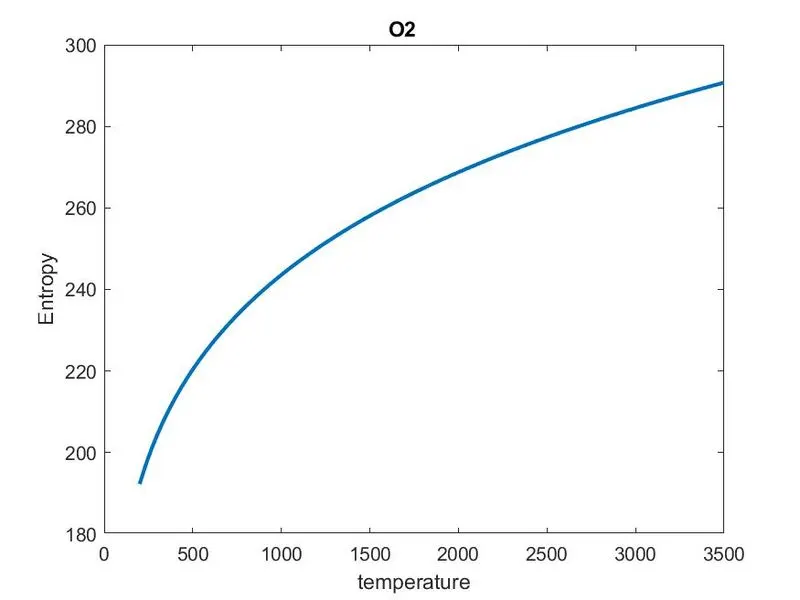
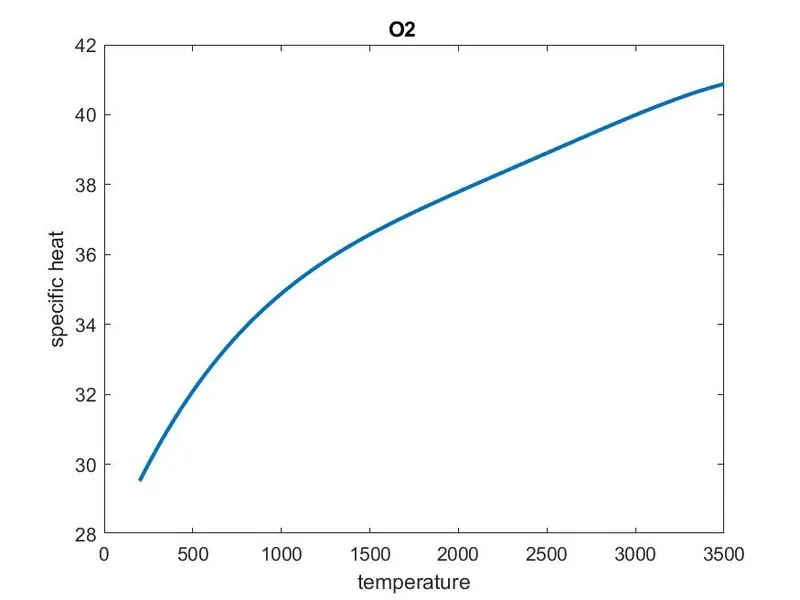
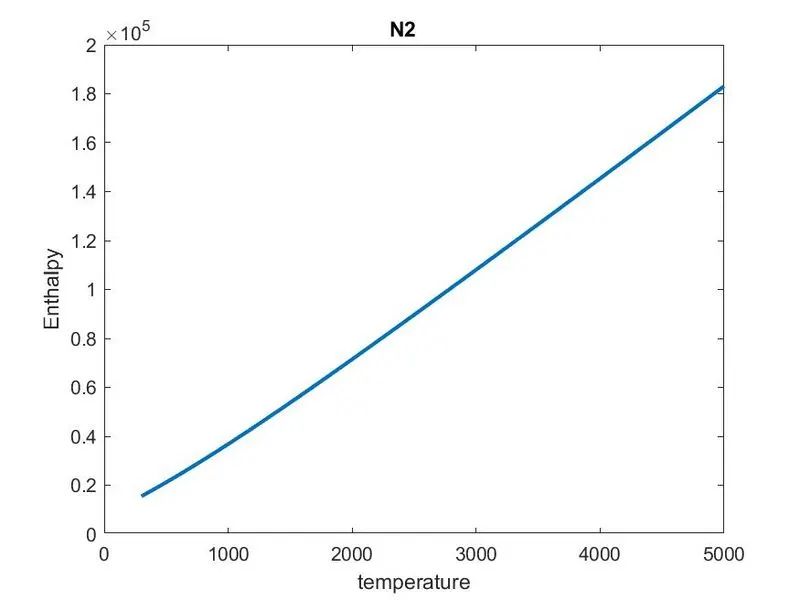
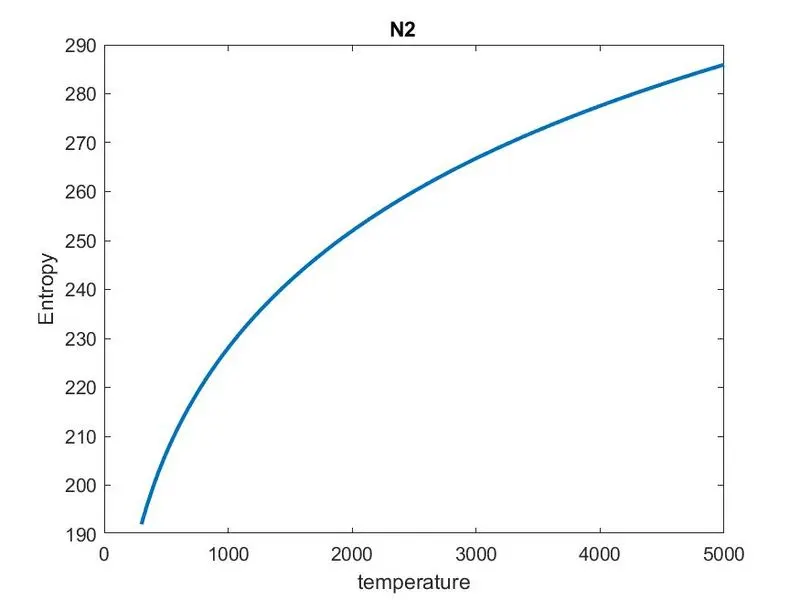
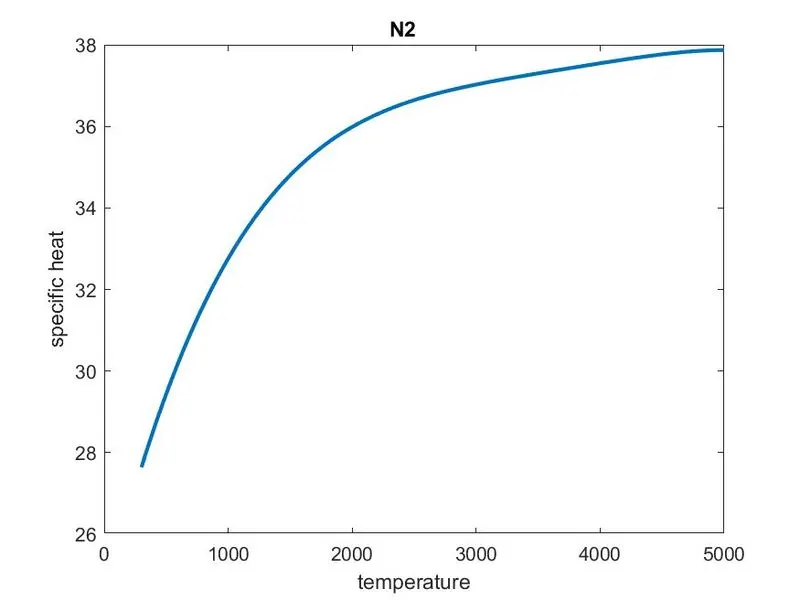
Plots for o2, N2 and Co2 species :
o2 :
N2 :
co2 :
Conclusion :
We can extracting or reading any type of data and execute any opration on that data as we our need.