Project 1 - Parsing NASA thermodynamic data
AIM : To Write a code in matlab to parse the NASA Thermodynamic data file and then calculate thermodynamic properties of various gas species.
OBJECTIVE :
1. Write a function that extracts the 14 co-efficients and calculates the enthalpy, entropy and specific heats for all the species in the data file.
2. Calculate the molecular weight of each species and display it in the command window.
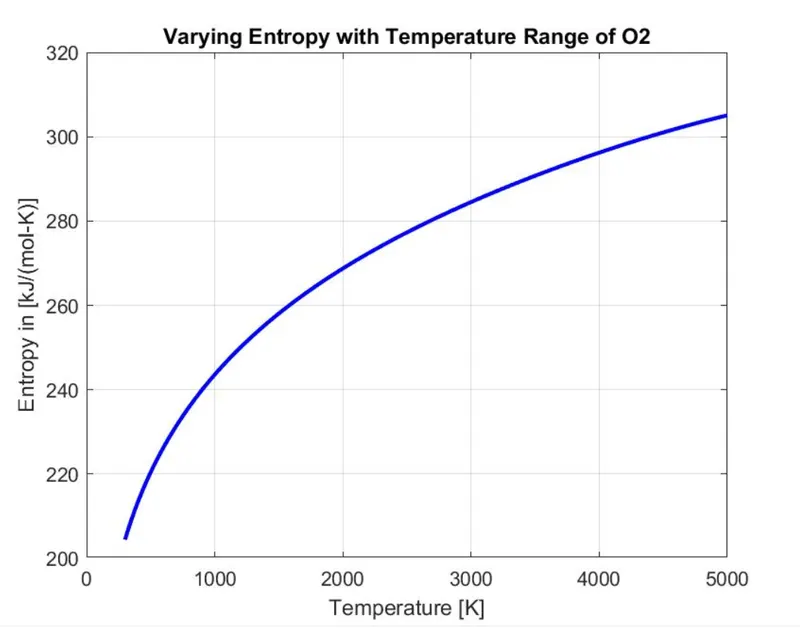
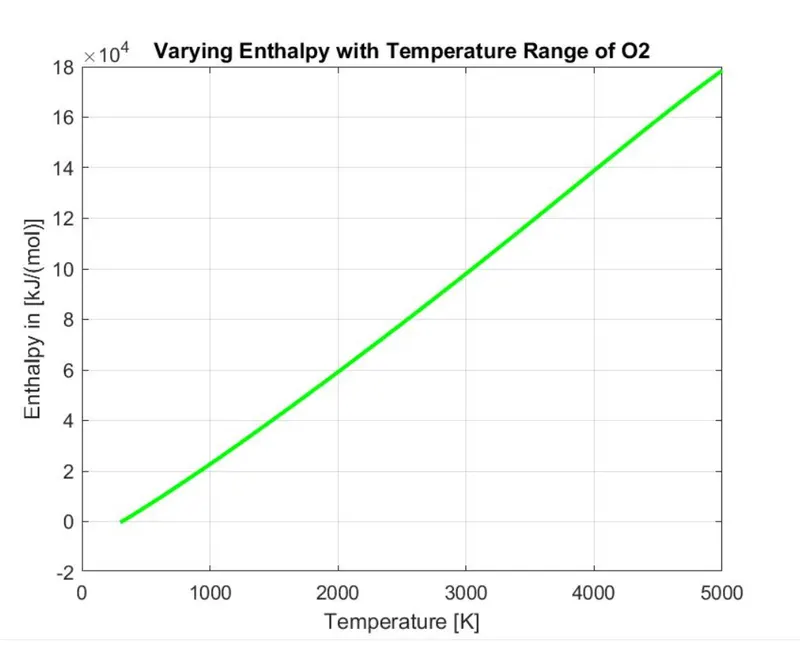
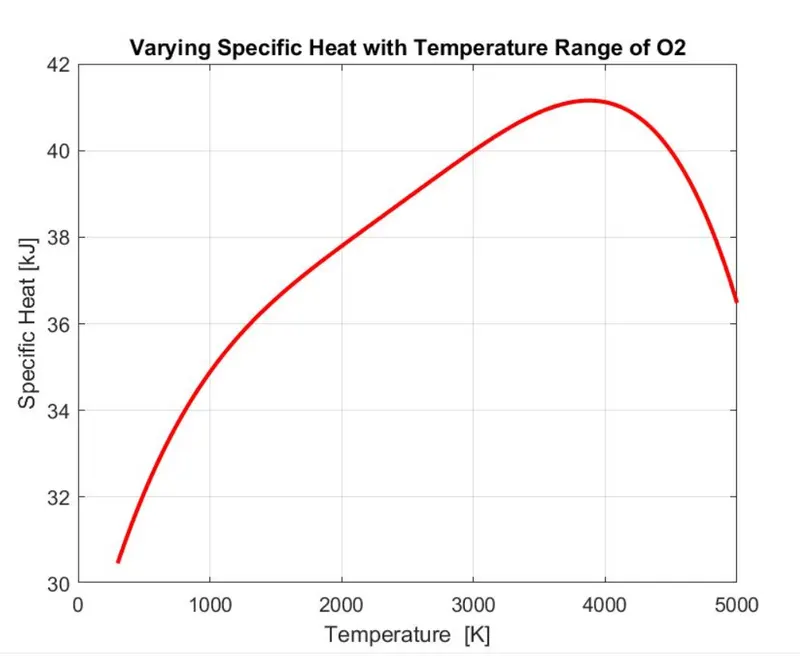
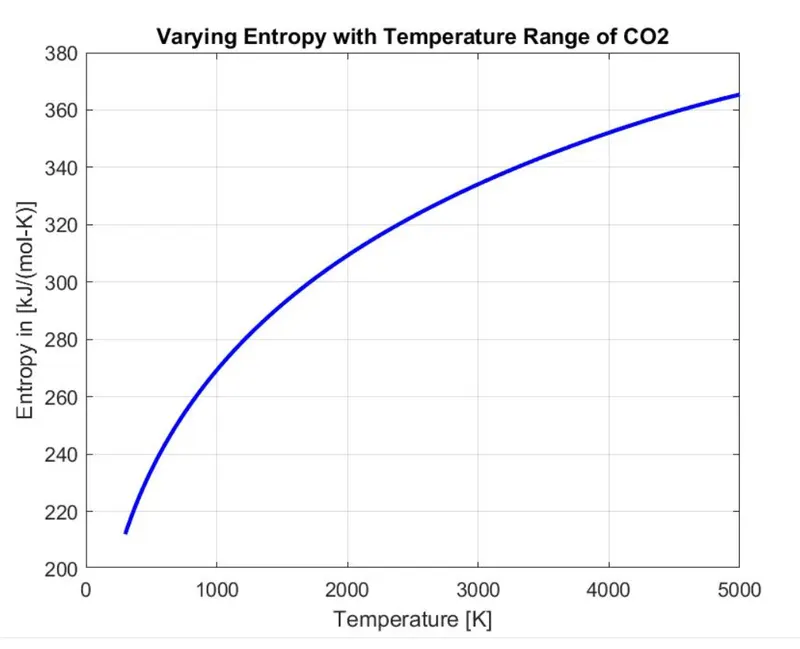
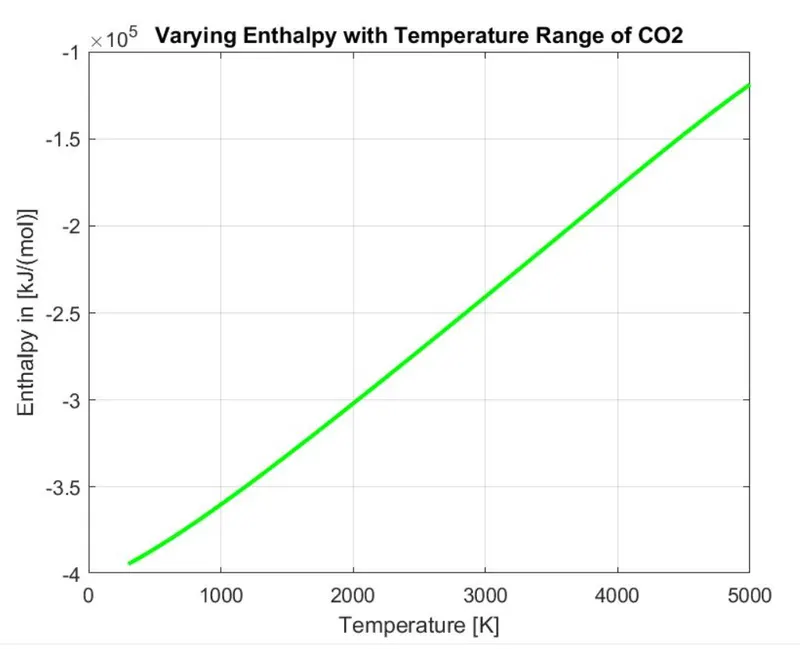
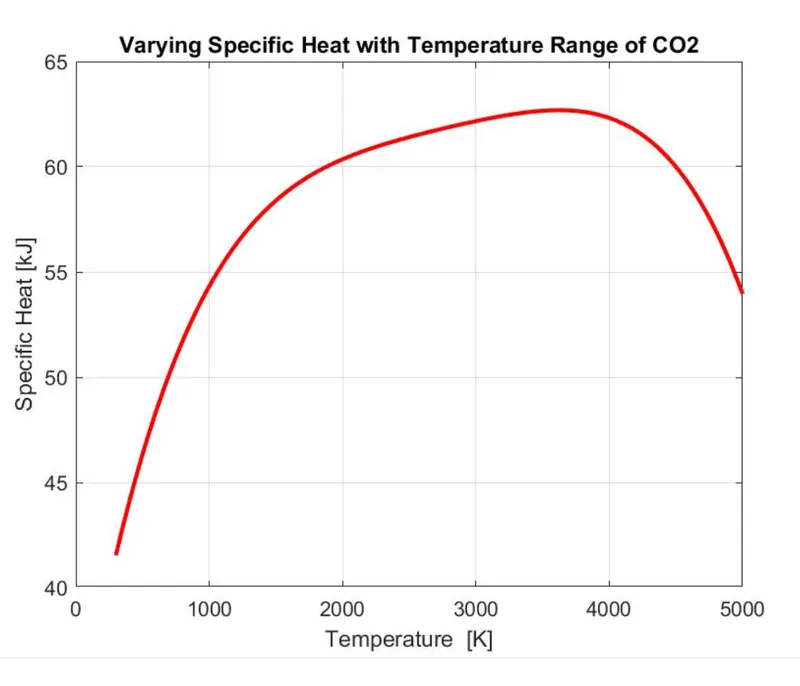
3. Plot the Cp, Enthalpy and Entropy for the local temperature range (low temperature : high temperature) specific for each species.
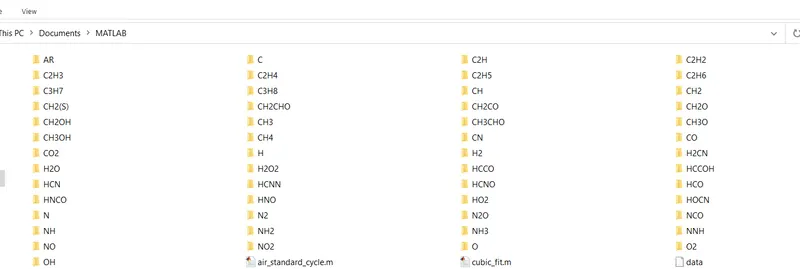
4. Save the plots as images with appropriate names and dump them in separate folders for each species with suitable name. All these should be generated automatically.
5. The main program that you will submit will just take the "THERMO.dat" file as an input and generate Cp, H and S plots.
THEORY :
Specific heat: The ratio of the amount of heat needed to raise the temperature of a unit mass of substance by a unit degree to the amount of heat needed to raise that of the same mass of water by the same amount.
Enthalpy: Enthalpy is the measurement of energy in a thermodynamic system. The quantity of enthalpy equals to the total content of heat of a system, equivalent to the system’s internal energy plus the product of volume and pressure.
Entropy: A thermodynamic quantity representing the unavailability of a system's thermal energy for conversion into mechanical work, often interpreted as the degree of disorder or randomness in the system.
FILE PARSING : File parsing means extracting the useful information from a file and utilising the information for the program.
MOLECULAR WEIGHT: The Average molecule of a compound to 1/12 the mass of carbon 12 and calculated as the sum of atomic weights of constituent atoms.
EQUATIONS :
Where,
Cp = Specific heat(j/(K kg))
R = Universal gas constant(mol:k)
H = Enthalpy(j)
S = Entropy(j/k)
T = Temperature(k)
EXPLANATION OF THE PROGRAM)1) The program begins with clear all, close all and clc command to free up the command window and the workspace.
2) To read the external NASA thermodynamic file using fopen (To open file) and fgetl (To read the file line by line) command is used.
3) Then by splitting the temperatures and values are defined it as global temperatures limits.
4) Then to extract the individual species data of all the species present in the file using fgetl command to read the file line by line and skipping the line not containing any of the useful data.
5) The data that is to be extracted for all the 53 species mentioned in the file are 14 coefficients, species name and the local temperature limits.
6) For loop is used to carry the process.
7) Calculation of specific heat, enthalpy, entropy, and molecular weight is done in seperate program and will be called to the main program.
8) Then the plots for specific heat v/s temperature, enthalpy v/s temperature and entropy v/s temperature for all the species and these 3 plots will be saved in seperate folders for each species.
9) After this the display the molecular weight of all the species in the command window.
MAIN PROGRAM
clear all
close all
clc

%  Reading Data file - NASA Thermodynamic
% Open a file & 'r' Open the file for reading
f1=fopen('THERMO.dat','r')
gt=fgetl(f1);

% Obtaing Temperatures - by Reading Header Information
global_temp=fgetl(f1);

% Spliting
t=strsplit(global_temp);

% Converting string cells to numbers using str2num,
global_low_temp=str2num(t{2});
global_medium_temp=str2num(t{3});
global_high_temp=str2num(t{4});

% Temperature range & Gas Constant
    % Temperature Range assumed
Temp=linspace(global_low_temp,global_high_temp,1000);
% Universal Gas Constant J/(mol-K)
    R = 8.314;

% skipping three comment lines in the file
for i = 1:3
    gt=fgetl(f1);
end

 for i = 1:53
gt=fgetl(f1);
A=strsplit(gt,' ');
Species_SP=(A{1})


line_1=fgetl(f1)  ;
a=strfind(line_1,'E');

% Extracting higher and lower temperature coefficients

% % Extracting FIRST 7 coefficients i.e HIGH-temperature coefficients
a1=line_1(1:a(1)+3);
a1=str2num(a1);              %1
a2=line_1(a(1)+4:a(2)+3);
a2=str2num(a2) ;             %2
a3=line_1(a(2)+4:a(3)+3);
a3=str2num(a3)  ;            %3
a4=line_1(a(3)+4:a(4)+3);
a4=str2num(a4);              %4
a5=line_1(a(4)+4:a(5)+3);
a5=str2num(a5)  ;            %5

line_2=fgetl(f1);
b=strfind(line_1,'E');;
a6=line_2(1:b(1)+3);
a6=str2num(a6)  ;            %6
a7=line_2(a(1)+4:b(2)+3);
a7=str2num(a7);              %7

 % Extracting SECOND 7 coefficients - LOW-temperature coefficients
a8=line_2(b(2)+4:b(3)+3);
a8=str2num(a8);              %8
a9=line_2(b(3)+4:b(4)+3);
a9=str2num(a9) ;             %9
a10=line_2(b(4)+4:b(5)+3);
a10=str2num(a10) ;           %10


line_3=fgetl(f1);
c=strfind(line_1,'E');

a11=line_3(1:c(1)+3);
a11=str2num(a11);               %11
a12=line_3(c(1)+4:c(2)+3);
a12=str2num(a12);               %12
a13=line_3(c(2)+4:c(3)+3);
a13=str2num(a13);               %13
a14=line_3(c(3)+4:c(4)+3);
a14=str2num(a14);               %14

% Specific heat calculation
    Cp = Specificheat(a1,a2,a3,a4,a5,a8,a9,a10,a11,a12,Temp,R,global_medium_temp);

    % Enthalpy calculation
    H = Enthalpy(a1,a2,a3,a4,a5,a6,a8,a9,a10,a11,a12,a13,Temp,R,global_medium_temp);

    % Entropy calculation
    S = Entropy_calc(a1,a2,a3,a4,a5,a7,a8,a9,a10,a11,a12,a14,Temp,R,global_medium_temp);

    % Calculating molecular weight of species
    Molecularweight(i) = Molecular_weight(Species_SP);

    % Read & Write Molecular list
     Molecular_list = fopen('Molecular weight.txt','a+');
         fprintf( Molecular_list,'Molecular weight of %s is %d \n',Species_SP,Molecularweight);
         fclose(Molecular_list);

     % plotting(CP,H,S,Temp,Species_SP)
        % Saving as a folder

           cur_dir=pwd;
           mkdir(Species_SP);
           cd(Species_SP);

        % Plot 1, Specific heat (CP) vs Temperature Range (Temp)

        figure(1)
        plot(Temp,Cp,'linewidth',2,'color','r');
        xlabel('Temperature  [K]');
        ylabel('Specific Heat [kJ]');
        title(sprintf('Varying Specific Heat with Temperature Range of %s',Species_SP));
        grid on
        saveas(figure(1),'Specific Heat.jpg');

        % Plot 2, Enthalpy (H) vs Temperature Range (Temp)

        figure(2)
        plot(Temp,H,'linewidth',2,'color','g');
        xlabel('Temperature [K]');
        ylabel('Enthalpy in [kJ/(mol)]');
        title(sprintf('Varying Enthalpy with Temperature Range of %s',Species_SP));
        grid on
        saveas(figure(2),'Ethalpy.jpg');

        % Plot 3, Entropy (S) vs Temperature Range (Temp)

        figure(3)
        plot(Temp,S,'linewidth',2,'color','b');
        xlabel('Temperature [K]');
        ylabel('Entropy in [kJ/(mol-K)]');
        title(sprintf('Varying Entropy with Temperature Range of %s',Species_SP));
        grid on
        saveas(figure(3),'Entropy.jpg');

        cd(cur_dir);

        % Molecular weight

        M = Molecular_weight(Species_SP)
        f2 = fopen('molecular mass','w');
        fprintf('%s n %s n %f n','species','Molecular mass',M)
        fclose(f2)
end
SPECIFIC HEAT
% Specific heat calculation function

function Cp = Specificheat(a1,a2,a3,a4,a5,a8,a9,a10,a11,a12,Temp,R,global_medium_temp)
% Comparing with global temperature
% If less than global temperature - minimum coefficients are taken
if  Temp <= global_medium_temp
Cp = R*(a8 + (a9*Temp) + (a10*(Temp).^2) + (a11*(Temp).^3) + (a12*(Temp).^4));
else
Cp = R*(a1 + (a2*Temp) + (a3*(Temp).^2) + (a4*(Temp).^3) + (a5*(Temp).^4));
% Else maximum coefficients are taken
end
ENTHALPY
% Enthalpy Calculation function

function H = Enthalpy(a1,a2,a3,a4,a5,a6,a8,a9,a10,a11,a12,a13,Temp,R,global_medium_temp)
% Comparing with global temperature
% If less than global temperature - minimum coefficients are taken

       if Temp <= global_medium_temp
        H = R*Temp.*(a8 + ((a9*Temp)/2) + ((a10*(Temp).^2)/3) + ((a11*(Temp).^3)/4) + ((a12*(Temp).^4)/5) +((a13./Temp)));
       else
% Else maximum coefficients are taken

        H = R*Temp.*(a1 + ((a2*Temp)/2) + ((a3*(Temp).^2)/3) + ((a4*(Temp).^3)/4) + ((a5*(Temp).^4)/5) +((a6./Temp)));
end
ENTROPY
% Entropy Calculatin function

function S = Entropy_calc(a1,a2,a3,a4,a5,a7,a8,a9,a10,a11,a12,a14,Temp,R,global_medium_temp)
% Comparing with global temperature
% If less than global temperature - minimum coefficients are taken

    if Temp <= global_medium_temp
        S = R.*(a8.*log(Temp) + (a9.*Temp) + (a10*((Temp).^2)/2) + (a11*((Temp).^3)/3) + (a12*((Temp).^4)/4) + a14);
    else

% Else - maximum coefficients are taken
        S = R.*(a1.*log(Temp) + (a2.*Temp) + (a3*((Temp).^2)/2) + (a4*((Temp).^3)/3) + (a5*((Temp).^4)/4) + a7);
end
MOLECULAR WEIGHT
% Molecular Weight Calculation function

function Molecularweight = Molecular_weight(Species_SP)
         % Standard - Atomic Name
         atomic_name = ['H','C','O','N','A'];
         % Hydrogen, Carbon, Oxygen, Nitrogen, Argon

         fprintf('Molecular Weight of ');
         fprintf(Species_SP);
         fprintf(' : ');
         % Standard Atomic Number
         Atomic_Weight = [1.008 12.011 15.999 14.007 39.948];
         % Starting Range of Molecule
         Molecularweight = 0;

         % Adding Atomic number to obtain particular value
        for i = 1:length(Species_SP)
            for j = 1:length(atomic_name)
                if strcmpi(Species_SP(i),atomic_name(j))
                        Molecularweight = Molecularweight +Atomic_Weight(j);
                    position = j;
                end
            end
            n = str2num(Species_SP(i));

            if n>1

                Molecularweight = Molecularweight + Atomic_Weight(position)*(n-1);

            end
        end
            fprintf('molecular weight %s :',Species_SP);
            fprintf('%d',Molecularweight);
            disp(' ');
end
OUTPUTS :
Output of command window
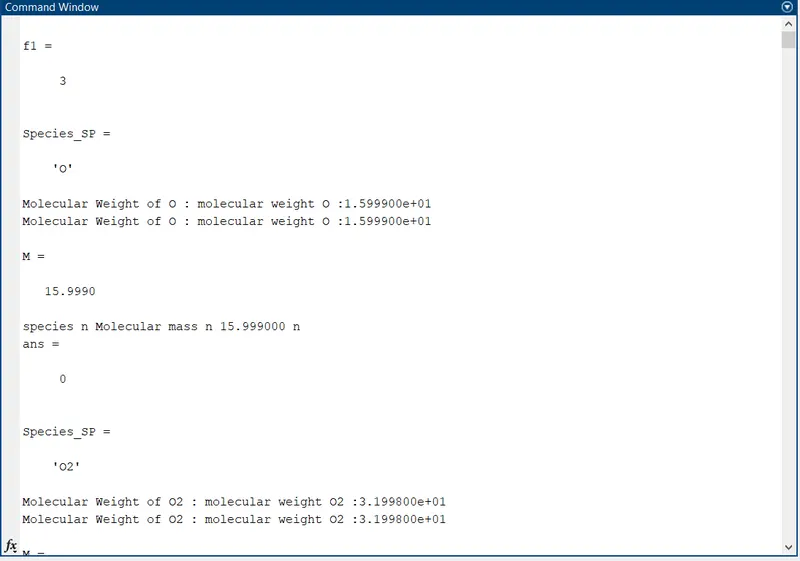
In the same way molecular weight of all the species is displayed in the command window.
Screen shots showing location of folders
PLOTS OF O2, N2 AND CO2 :
1) PLOTS OF O2 :
2) PLOTS OF N2 :
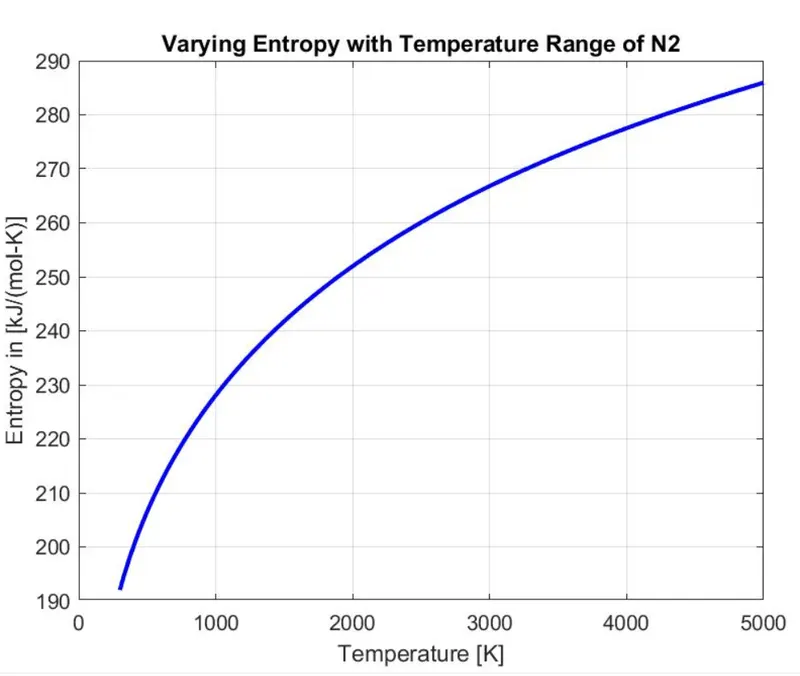
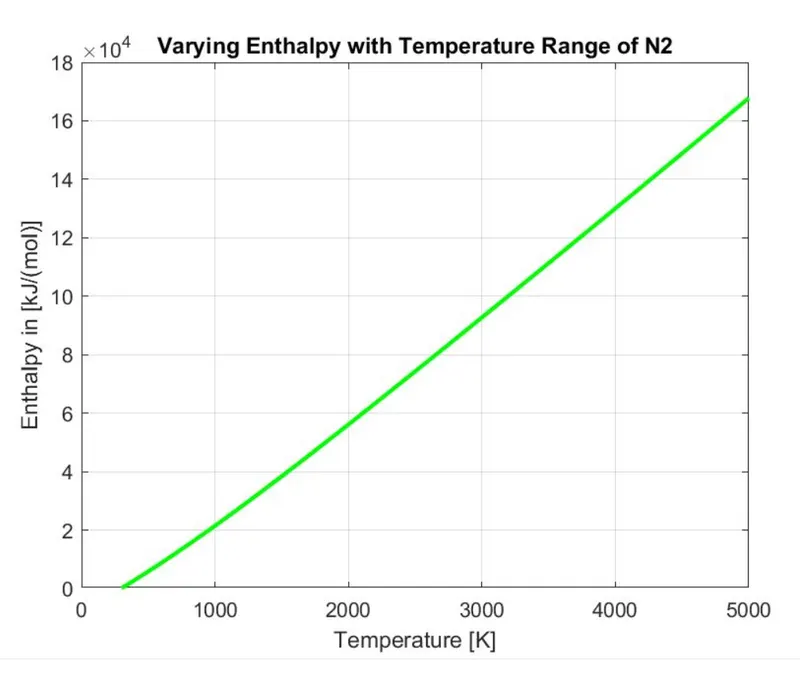
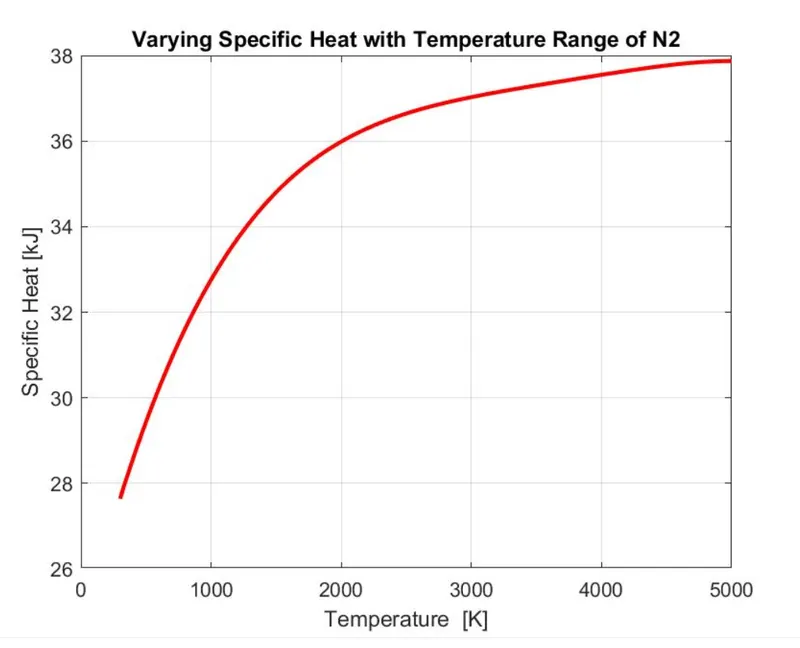
3) PLOTS OF CO2 :
NO ERRORS
REFERENCES :