Project 1 - Parsing NASA thermodynamic data
Objective:
Writing a function that extracts the 14 co-efficients and calculates the enthalpy, entropy and specific heats for all the species in the data file. You will be reading this file NASA thermodynamic data(Tip: use fopen and fgetl). The formulae are shown below.
The FIRST 7 coefficients are HIGH-temperature coefficients and the SECOND 7 coefficients are LOW-temperature coefficients.
Also use the LOCAL TEMPERATURE RANGES which is unique for each individual species, not the GLOBAL TEMPERATURE RANGE.
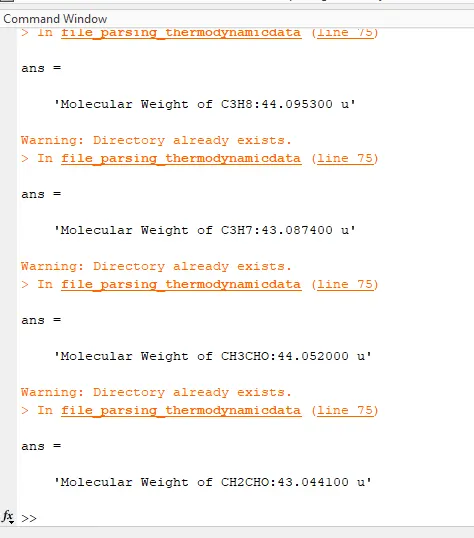
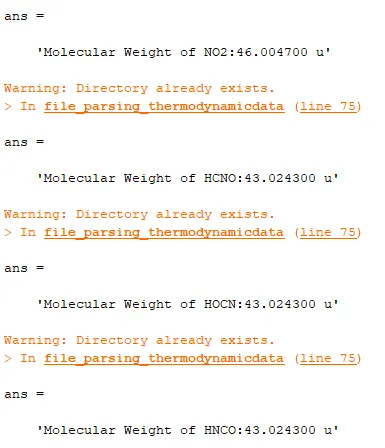
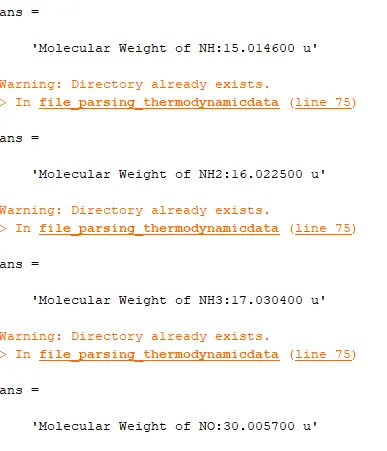
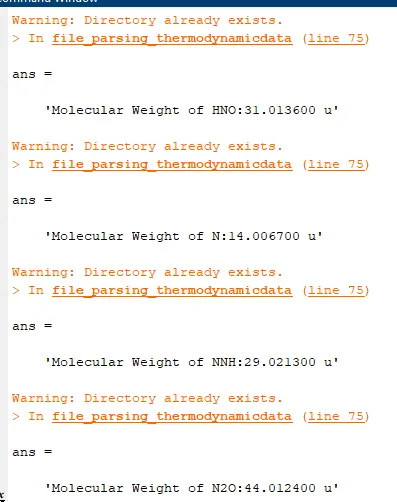
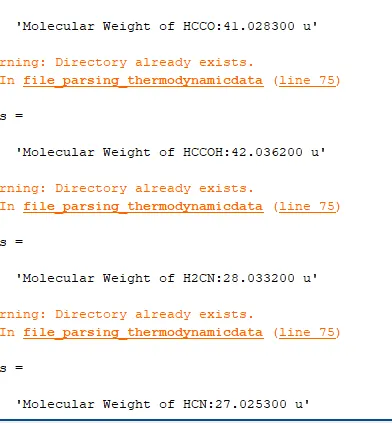
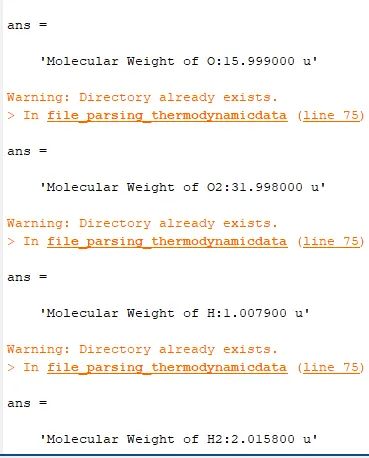
2. Calculate the molecular weight of each species and display it in the command window.
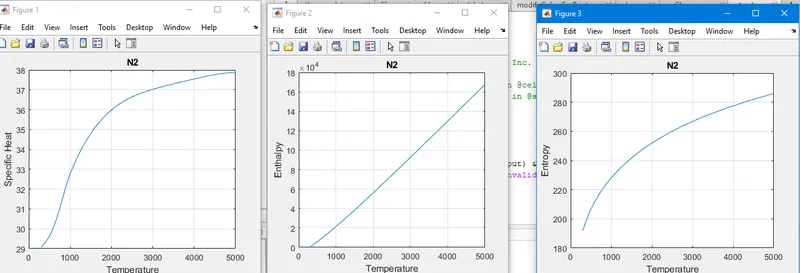
3. Plot the Cp, Enthalpy and Entropy for the local temperature range (low temperature : high temperature) specific for each species.
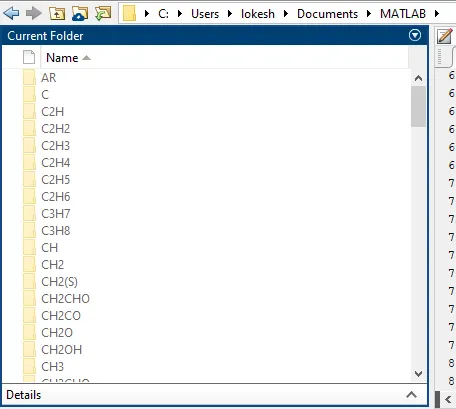
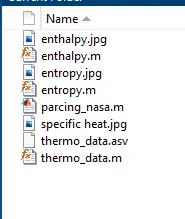
4. Save the plots as images with appropriate names and dump them in separate folders for each species with suitable name. All these should be generated automatically.
5. The main program that you will submit will just take the "THERMO.dat" file as an input and generate Cp, H and S plots.
6. Please write a detailed report to describe your logic.
theory:
Here R is the universal gas constant, T is the temeprature
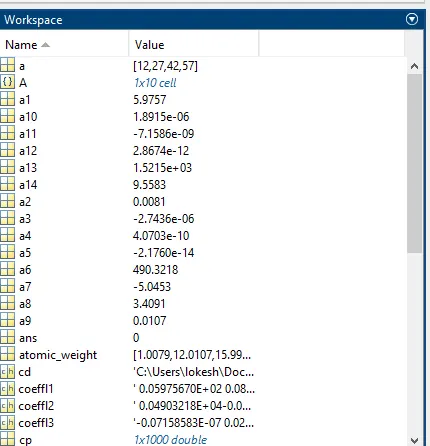
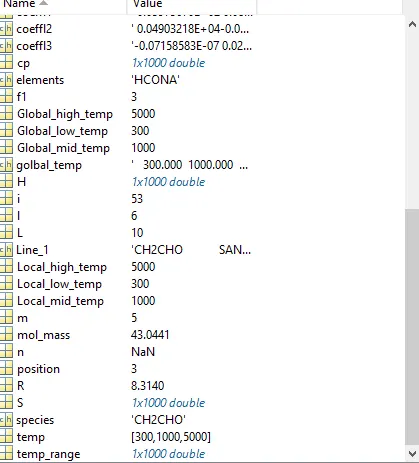
Matlab program to extract the 14 co-efficients for all species from data file given.
Program with step by step explanation :
% file parsing thermodynamic data
clear all
close all
clc
f1= fopen('THERMO.dat','r');            % open the file "THERMO.dat"
fgetl(f1);                              % go to next line
golbal_temp =fgetl(f1);                 % next line saving in a variable as a string
A= strsplit(golbal_temp,' ');           % splitiing the string with space & save it in a variable
L= length(A);                           % length of the variable
Global_high_temp = str2double(A(end));  % converting string to number from the end
Global_mid_temp  = str2double(A(end-1));% converting string to number from the end-1
Global_low_temp  = str2double(A(end-2));% converting string to number from the end-2

fgetl(f1);                     % go to next line
fgetl(f1);                     % go to next line
fgetl(f1);                     % go to next line

    for i =1:53                % 53 iterations/cycles

    Line_1=fgetl(f1);          % go to next line

    A= strsplit(Line_1,' ');   % splitiing the string with space & save it in a variable
    L=length(A);               % length of the variable
    species=deblank(A{1});     % deblank command use for blanking the spaces around the character/number
    Local_mid_temp=str2double(A(end-1)); % converting string to number from the end-1
    Local_high_temp=str2double(A(end-2));% converting string to number from the end-2
    Local_low_temp=str2double(A(end-3)); % converting string to number from the end-3

    temp=[Local_low_temp Local_mid_temp Local_high_temp];%matrices of Local low mid and high temperatures

    coeffl1=fgetl(f1);     % go to next line & store it in a variable coeffl1
    a=findstr(coeffl1,'E');% finding the string called E

    a1=coeffl1(1:a(1)+3);     % storing 1 to a(1) or E +3 numbers in al variable
    a1=str2double(a1);        % converting a1 - string to number
    a2=coeffl1(a(1)+4:a(2)+3);% storing a(1)+4  to a(2) or E +3 numbers in a2 variable
    a2=str2double(a2);        % converting a2 - string to number
    a3=coeffl1(a(2)+4:a(3)+3);% storing a(2)+4  to a(3) or E +3 numbers in a3 variable
    a3=str2double(a3);        % converting a3 - string to number
    a4=coeffl1(a(3)+4:a(4)+3);% storing a(3)+4  to a(4) or E +3 numbers in a4 variable
    a4=str2double(a4);        % converting a4 - string to number
    a5=coeffl1(a(4)+4:a(5)+3);% storing a(4)+4  to a(5) or E +3 numbers in a5 variable
    a5=str2double(a5);        % converting a5 - string to number


    coeffl2=fgetl(f1);        % go to next line & store it in a varaible coeffl2
    a=findstr(coeffl2,'E');   % finding the string called E

    a6=coeffl2(1:a(1)+3);     % storing 1 to a(1) or E +3 numbers in a6 vaiable
    a6=str2double(a6);        % converting a6 - string to number
    a7=coeffl2(a(1)+4:a(2)+3);% storing a(1)+4  to a(2) or E +3 numbers in a7 variable
    a7=str2double(a7);        % converting a7 - string to number
    a8=coeffl2(a(2)+4:a(3)+3);% storing a(2)+4  to a(3) or E +3 numbers in a8 variable
    a8=str2double(a8);        % converting a8 - string to number
    a9=coeffl2(a(3)+4:a(4)+3);  % storing a(3)+4  to a(4) or E +3 numbers in a9 variable
    a9=str2double(a9);          % converting a9 - string to number
    a10=coeffl2(a(4)+4:a(5)+3); % storing a(4)+4  to a(5) or E +3 numbers in a10 variable
    a10=str2double(a10);        % converting a10 - string to number


    coeffl3=fgetl(f1);          % go to next line & store it in a varaible coeffl3
    a=strfind(coeffl3,'E');     % finding the string called E

    a11=coeffl3(1:a(1)+3);      % storing 1 to a(1) or E +3 numbers in a11 vaiable
    a11=str2double(a11);        % converting a11 - string to number
    a12=coeffl3(a(1)+4:a(2)+3); % storing a(1)+4  to a(2) or E +3 numbers in a12 variable
    a12=str2double(a12);        % converting a12 - string to number
    a13=coeffl3(a(2)+4:a(3)+3); % storing a(2)+4  to a(3) or E +3 numbers in a13 variable
    a13=str2double(a13);        % converting a13 - string to number
    a14=coeffl3(a(3)+4:a(4)+3); % storing a(3)+4  to a(4) or E +3 numbers in a14 variable
    a14=str2double(a14);        % converting a14 - string to number


    %creating folder
    mkdir(['C:\Users\lokesh\Documents\MATLAB\',species]); % create directory as per file path called species
    temp_range=linspace(Local_low_temp,Local_high_temp,1000);% local low to high temp 1000 nos. taking by using linspace command
    R=8.314; % universal  gas constant
    %specific heat|%enthalpy|%entropy function

    [cp,H,S]=thermo_data(a1,a2,a3,a4,a5,a6,a7,a8,a9,a10,a11,a12,a13,a14,temp,temp_range,R);

    figure(1);                       % image 1
            plot(temp_range,cp);     % temp_range vs cp graph
            grid on ;                % grids on
            title(species);          % name species
            xlabel('Temperature');   % x - axis :temperature
            ylabel('Specific Heat'); % y- axis  :specific heat

    figure(2);                       % image 2
            plot(temp_range,H);      % temp_range vs H graph
            grid on ;                % grids on
            title(species);          % name species
            xlabel('Temperature');   % x - axis :temperature
            ylabel('Enthalpy');      % y- axis  :Enthalpy

    figure(3);                       % image 3
            plot(temp_range,S);      % temp_range vs S graph
            grid on ;                % grids on
            title(species);          % name species
            xlabel('Temperature');   % x - axis :temperature
            ylabel('Entropy');       % y- axis  :Entropy

            %changing the directory and saving the file
cd=(['C:\Users\lokesh\Documents\MATLAB\images',species]);% chnange directory as per file path called species

saveas(1,'specific heat','jpg');     % save the image as specific heat.jpg
saveas(2,'enthalpy','jpg');          % save the image as enthalpy.jpg
saveas(3,'entropy','jpg');           % save the image as entropy.jpg

%molecular_masscalculation
elements=['H','C','O','N','A'];       %elements strings in a matrice
atomic_weight=[1.0079 12.0107 15.999 14.0067 39.948];% elements  atomic weights
mol_mass=0;                            %consider molicular mass 0
for l=1:length(species)                % for loop 1 to length of the species
    for m=1:length(atomic_weight)      % for loop 1 to length of atomic weight
        if strcmp(species(l),elements(m))% str comparision species vs elements
            mol_mass=mol_mass+atomic_weight(m);% molicular mass
            position=m;                 % position1
        end
    end

n=str2double(species(l));              % string to number conversion of species 1& store in n
if n>1                                 % if  n is >1
    mol_mass=mol_mass+atomic_weight(position)*(n-1);% molicular mass is

end
end
sprintf('Molecular Weight of %s:%f u',species,mol_mass);% print molecular weight.

    end
    fclose(f1);                        % close the file.
results:
function program of specific heat ,entrophy and enthalpy calculation:
Explanation:
step1: thermo data function with all 14 coefficients ,temp, temp_range and R.
step2:for loop from 1 to length of temp_range
step3: if consition : if temp_range is < or = temp(2) ie., mid temparature then
step4:cp(i) =cp(i)=R*(a8+(a9*temp_range(i))+(a10*(temp_range(i).^2))+(a11*(temp_range(i).^3))+(a12*(temp_range(i).^4)));
H(i)=R*(a8*temp_range(i)+(a9*(temp_range(i).^2))/2+(a10*(temp_range(i).^3)/3)+(a11*(temp_range(i).^4)/4)+(a12*(temp_range(i).^5)/5)+a13);
S(i)=R*((a8*log(temp_range(i)))+(a9*(temp_range(i)))+(a10*(temp_range(i).^2)/2)+(a11*(temp_range(i).^3)/3)+(a12*(temp_range(i).^4)/4)+a14);
step5: else(other wise)
cp(i)=R*(a1+(a2*temp_range(i))+(a3*(temp_range(i).^2))+(a4*(temp_range(i).^3))+(a5*(temp_range(i).^4)));
H(i)=R*(a1*temp_range(i)+(a2*(temp_range(i).^2)/2)+(a3*(temp_range(i).^3))/3+(a4*(temp_range(i).^4))/4+(a5*(temp_range(i).^5)/5)+a6);
S(i)=R*((a1*log(temp_range(i)))+(a2*(temp_range(i)))+(a3*(temp_range(i).^2)/2)+(a4*(temp_range(i).^3)/3)+(a5*(temp_range(i).^4)/4)+a7);
step6:end end
function[cp,H,S]=thermo_data(a1,a2,a3,a4,a5,a6,a7,a8,a9,a10,a11,a12,a13,a14,temp,temp_range,R)

for i=1:length(temp_range)

    if temp_range(i)<=temp(2)
        cp(i)=R*(a8+(a9*temp_range(i))+(a10*(temp_range(i).^2))+(a11*(temp_range(i).^3))+(a12*(temp_range(i).^4)));
        H(i)=R*(a8*temp_range(i)+(a9*(temp_range(i).^2))/2+(a10*(temp_range(i).^3)/3)+(a11*(temp_range(i).^4)/4)+(a12*(temp_range(i).^5)/5)+a13);
        S(i)=R*((a8*log(temp_range(i)))+(a9*(temp_range(i)))+(a10*(temp_range(i).^2)/2)+(a11*(temp_range(i).^3)/3)+(a12*(temp_range(i).^4)/4)+a14);
    else
        cp(i)=R*(a1+(a2*temp_range(i))+(a3*(temp_range(i).^2))+(a4*(temp_range(i).^3))+(a5*(temp_range(i).^4)));
        H(i)=R*(a1*temp_range(i)+(a2*(temp_range(i).^2)/2)+(a3*(temp_range(i).^3))/3+(a4*(temp_range(i).^4))/4+(a5*(temp_range(i).^5)/5)+a6);
        S(i)=R*((a1*log(temp_range(i)))+(a2*(temp_range(i)))+(a3*(temp_range(i).^2)/2)+(a4*(temp_range(i).^3)/3)+(a5*(temp_range(i).^4)/4)+a7);
    end


end
Errors:

Solution for error:
previous:

extra paranthasis is there.
present:

removed the paranthasis .
_______________________________________
2. molecular weight of species:
.____________________________________________________
3. Ploting Cp H and S with respect to temparature:
for CH2CH0
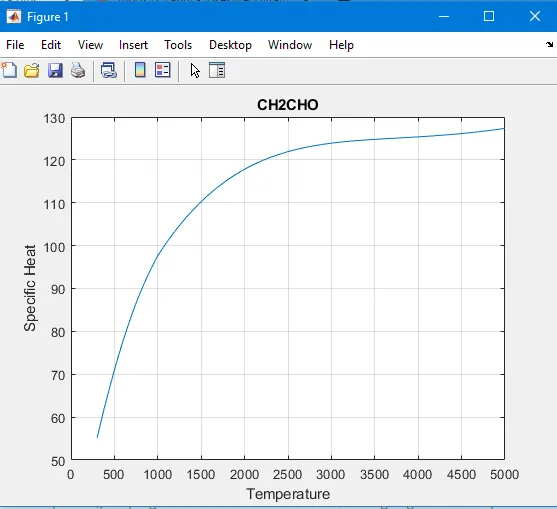
CP VS TEMPARATURE
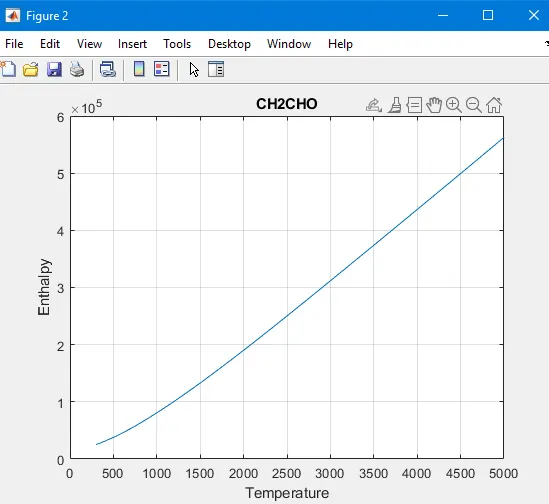
ENTHALPHY VS TEMPARATURE
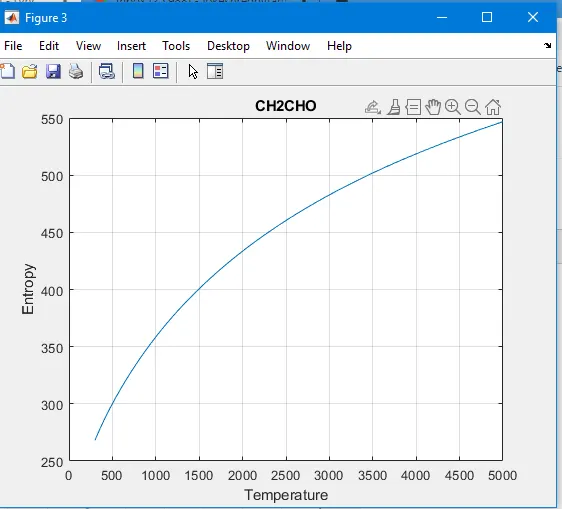
ENTROPHY VS TEMPARATURE
___________________________________________________
4.CREATING THE FOLDERS WITH SPECIES NAMES AND SAVE THE IMAGES

RESULT:
IMAGES OF CP H AND S :
_____________________________________________________
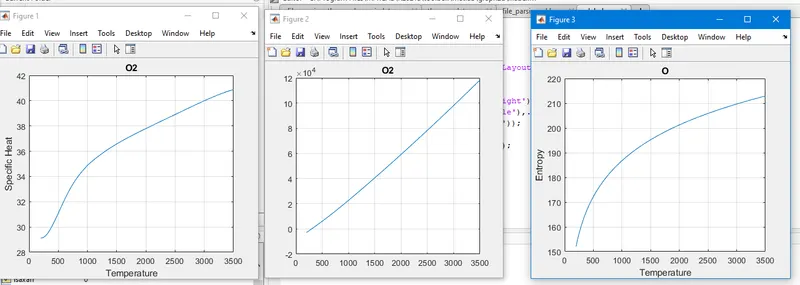
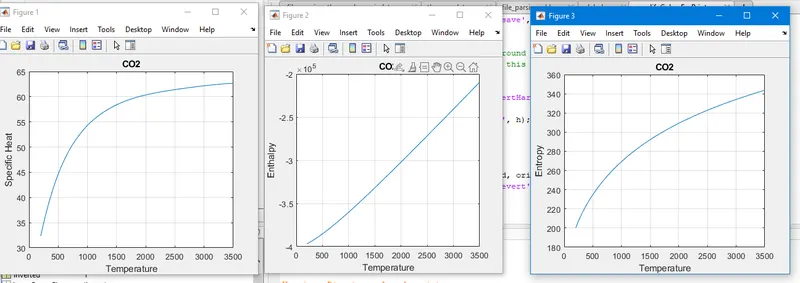
ATTACHMENTS O2, N2 ,CO2:
o2:
co2:
N2: