Project 1 - Parsing NASA thermodynamic data
Aim – Creating a MATLAB program which can execute following points in a single time run.
- Parsing the file provided for NASA thermodynamic study.
- Extracting 14 coefficients required for calculation of Specific Heat, Enthalpy, Entropy & Molecular weight also displaying weight of each (53) species in command window.
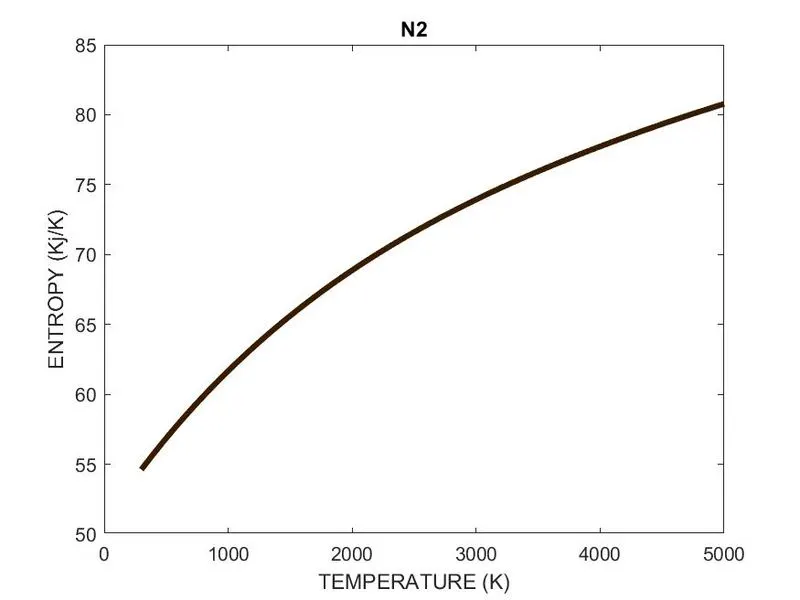
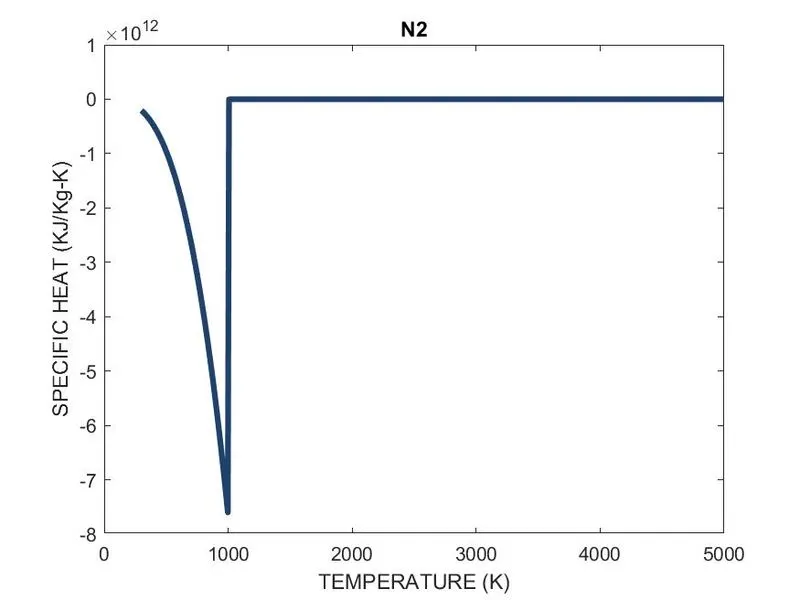
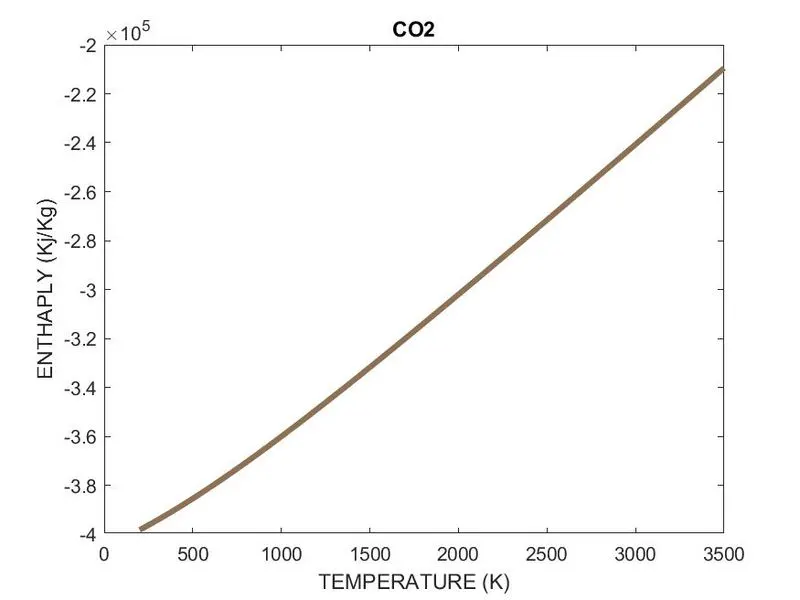
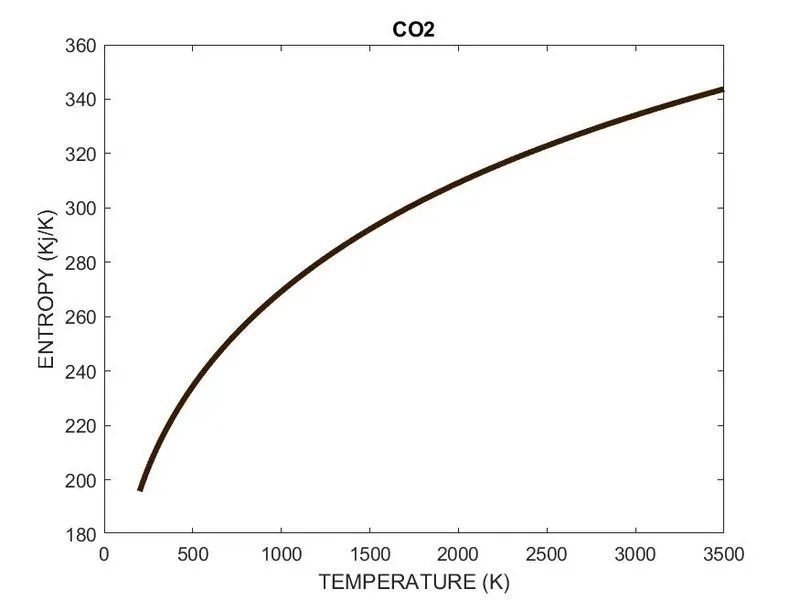
- Plotting the Graph of Specific Heat, Enthalpy, & Entropy for Local Temperature range (low Temp: high Temp)
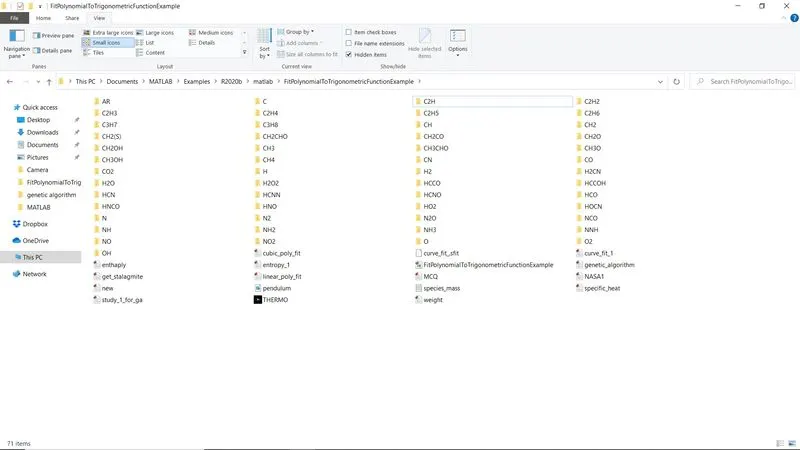
- Saving all the plots for each species with appropriate names in jpeg format in a separate folder for each species with proper names given to each folder.
Objective - To understand how to parse the data in MATLAB, Creating Folder, saving graph as jpeg file.
Background Knowledge – NASA came up with polynomials that can be used to evaluate thermodynamic properties such as Specific Heat (Cp), Enthalpy (H) & Entropy (S). They have also documented the co-efficient that are required to evaluate these polynomials for 1000+ Species.
Equations –
Where,
a1,a2,a3,a4,a5,a6,a7 are coefficients
R = Universal Gas Constant =
T = Temperature
Inputs – R = 8.314.
Specific Heat - The heat required to rise the temperature of the unit mass of a given substance by a given amount (Usually one Degree).
Enthaply - The sum of the internal energy and the product of the pressure and volume of a thermodynamic system.
Entropy – A measure of system’s thrmal energy per unit temperature that is unavailable for doing useful work. Because work is obtained from ordered molecular motion, the amount of entropy is also measure of molecular disorder, or randomness of a system. The concept of entropy provides the deep insight into the direction of spontageneous change for many everyday phenomena.
The meaning of file Parsing is to extracting the data from the file in to the MATLAB
PROGRAM CODE EXPLANATION –
- clear all – It is used to clear all the variables inserted from the workspace.
- close all – It is used to clear or close opened figures or images.
- clc – It is used to command window.
- Here we used the fopen command to open the fille provided by NASA and in that we used fgetl command to get specific lines and after that decided whether that line is useful or not for extracting the data required for calculations.
- The important temperatures found that is extracted and saved that global temperature values.
- Then again, we started to extract the species data and skipped the data which is not useful and kept the data which is useful and started collecting the coefficients provided in the data file line by line.
- The data for all the 53 species is to be collected for calculation and the coefficients (first 7 coefficients are HIGH TEMPERATURE coefficients and Other 7 are LOW TEMPERATURE coefficients), also names of all the Species, and local temperature limits for all species.
- This process is carried-out with for-loop in which the format of data fitted in the file provided is understood and then collected all the data directly.
- The local temperature range is also extracted, and the low, mid, and high temperature also set form that.
- Then after that extracted the coefficients as explained above as first 7 are hight temp coefficients and next 7 are low temp coefficients.
- After collecting all the data its time for calculation so we created the different functions for the calculating the values for Cp, H, & S and called the functions in the main program.
- In those functions we used the equations shown above in the equation section.
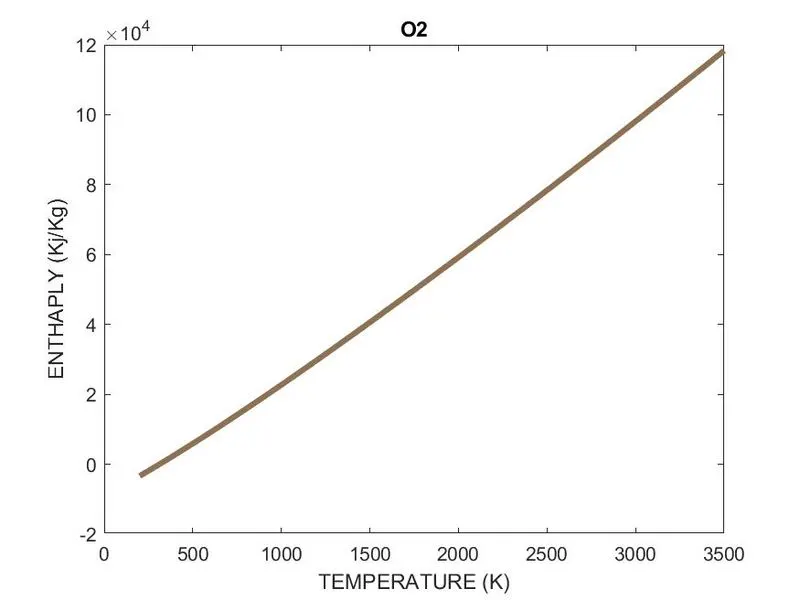
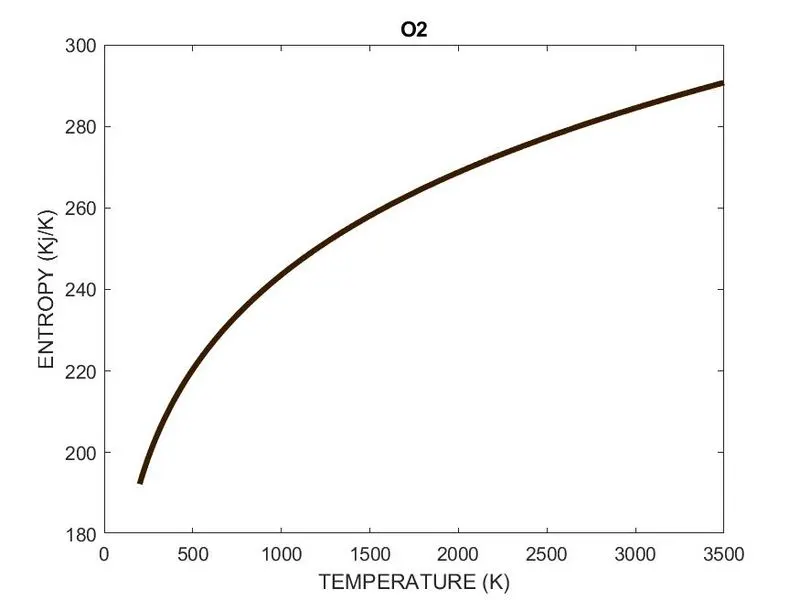
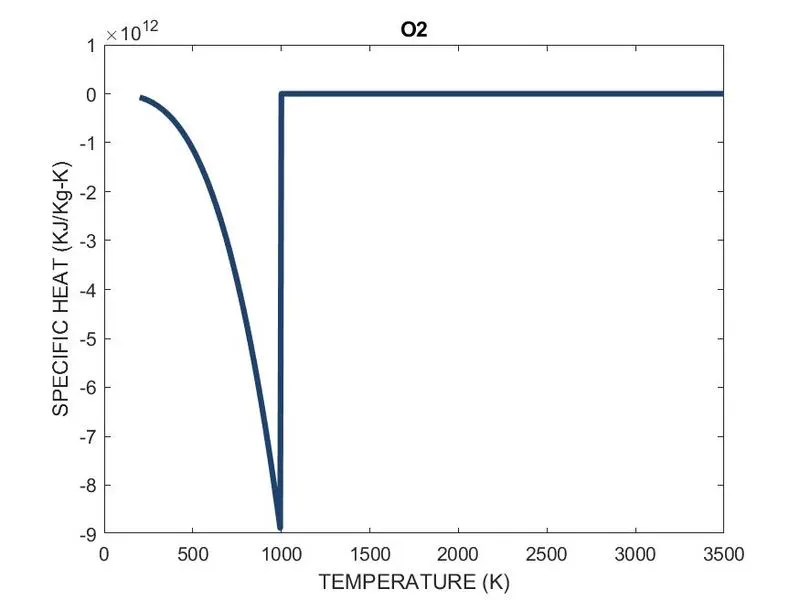
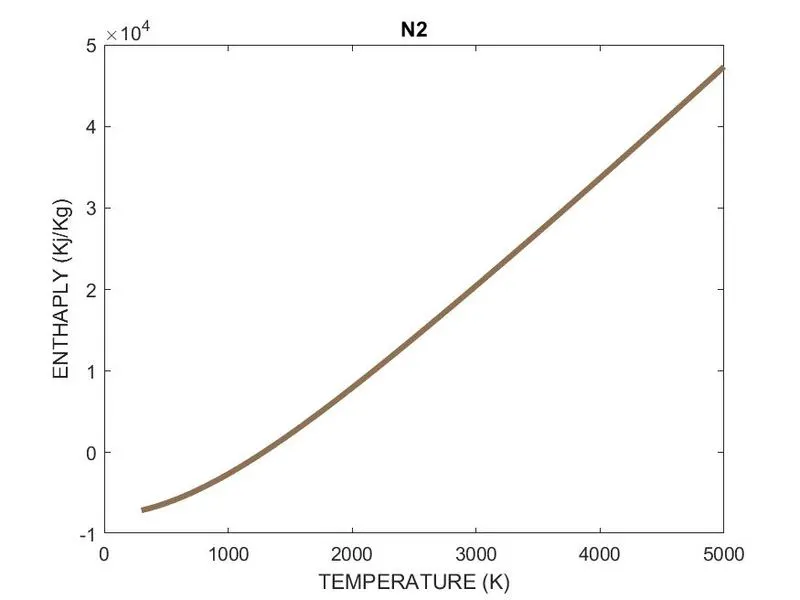
- Then we plotted the graphs of Specific Heat (Cp) Vs. Temperature (T), Enthalpy (H) Vs. Temperature (T), Entropy (s) Vs. Temperature (T) for all 53 species and all 3 graphs of each species are saved in separate folders for each species.
- Similarly created the function for calculation of molecular weight of all species and displayed in command window.
Everything mentioned above is done in a single run.
Main Program.
clear all
close all
clc
%Opening Extrernal File
f1 = fopen('THERMO.dat','r');
line_1 = fgetl(f1);
line_2 = fgetl(f1);

%Obtaining Global Temperature values
%Storing them as numbers in seperate values

global_values = strsplit(line_2,' ');
global_low_temp = str2num(global_values{2});
global_mid_temp = str2num(global_values{3});
global_high_temp = str2num(global_values{4});

line_3 = fgetl(f1);
line_4 = fgetl(f1);
%skipped above 2 lines
line_5 = fgetl(f1);

%Defining Universal gas constant in KJ/Kmol-K
R = 8.314;
for i = 1:53
    T = fgetl(f1);

    %extracting the species names
    species_name = T(1:9);
    species_name = deblank(species_name);
    %removing blank spaces

    %Extracting local Temperatures
    species_temp = T(49:75);
    local_values = strsplit (species_temp,' ');
    l_low_temp = str2num(local_values{1});
    l_mid_temp = str2num(local_values{3});
    l_high_temp = str2num(local_values{2});
    %Storing local temperature in a variable
    temp = [l_low_temp l_mid_temp l_high_temp];
    temp_range = linspace(l_low_temp,l_high_temp,500);

    coeff = fgetl(f1);
    coeff1 = findstr(coeff,'E');
    %Extracting the coefficients
    A1 = coeff(1:coeff1(1)+2);
    A1 = str2num(A1);
    A2 = coeff(coeff1(1)+4:coeff1(2)+3);
    A2 = str2num(A2);
    A3 = coeff(coeff1(2)+4:coeff1(3)+3);
    A3 = str2num(A3);
    A4 = coeff(coeff1(3)+4:coeff1(4)+3);
    A4 = str2num(A4);
    A5 = coeff(coeff1(4)+4:coeff1(5)+3);
    A5 = str2num(A5);

    new_line = fgetl(f1);
    coeff2 = findstr(new_line,'E');
    A6 = new_line(1:coeff2(1)+3);
    A6 = str2num(A6);
    A7 = new_line(coeff2(1)+4:coeff2(2)+3);
    A7 = str2num(A7);
    A8 = new_line(coeff2(2)+4:coeff2(3)+3);
    A8 = str2num(A8);
    A9 = new_line(coeff2(3)+4:coeff2(4)+3);
    A9 = str2num(A9);
    A10 = new_line(coeff2(4)+4:coeff2(5)+3);
    A10 = str2num(A10);

    new_line1 = fgetl(f1);

    coeff3 = findstr(new_line1,'E');
    A11 = new_line(1:coeff3(1)+3);
    A11 = str2num(A11);
    A12 = new_line1(coeff3(1)+4:coeff3(2)+3);
    A12 = str2num(A12);
    A13 = new_line1(coeff3(2)+4:coeff3(3)+3);
    A13 = str2num(A13);
    A14 = new_line1(coeff3(3)+4:coeff3(4)+3);
    A14 = str2num(A14);

    %Spoecific Heat Calculation
    Cp = specific_heat(A1,A2,A3,A4,A5,A8,A9,A10,A11,A12,temp,temp_range,R);

    %Enthaply Calculation
    H= enthaply(A1,A2,A3,A4,A5,A6,A8,A9,A10,A11,A12,A13,temp,temp_range,R);

    %Entropy Calculation
    S= entropy_1(A1,A2,A3,A4,A5,A7,A8,A9,A10,A11,A12,A14,temp,temp_range,R);

    %Molecular Weight Calculation
    m_weight = weight(species_name)

    %saving molecular weight

    species_w = fopen('species_mass.txt','w');
    fprintf(species_w,'molecular mass of %s is %f',species_name,m_weight);
    fclose(species_w);

    %Plotting and saving Data Created
    cur_dir =pwd;

    %Making a new folder for each species
    mkdir(species_name);
    cd(species_name);

    figure(1),
    plot(temp_range,Cp,'linewidth',3,'color',[0.1235 0.2536 0.4325])
    xlabel('TEMPERATURE (K)');
    ylabel('SPECIFIC HEAT (KJ/Kg-K)');
    title(species_name);

    figure(2),
    plot(temp_range,H,'linewidth',3,'color',[0.5554 0.4443 0.3332])
    xlabel('TEMPERATURE (K)');
    ylabel('ENTHAPLY (Kj/Kg)');
    title(species_name);

    figure(3),
    plot(temp_range,S,'linewidth',3,'color',[0.2221 0.1110 0.0001])
    xlabel('TEMPERATURE (K)');
    ylabel('ENTROPY (Kj/K)');
    title(species_name);

    %Saving the plots in Seperate folder for each species
    saveas(1,'specific heat.jpg');
    saveas(2,'Enthalpy.jpg');
    saveas(3,'Entropy.jpg');

    cd(cur_dir);

    %Printing the molecular weight of the species

    sprintf('molecular weight of %s = %f',species_name,m_weight)

end

%closing the file
fclose(f1);
Function FOR CALCULATION OF SPECIFIC HEAT (Cp)
function[Cp]= specific_heat(A1,A2,A3,A4,A5,A8,A9,A10,A11,A12,temp,temp_range,R)

%A1,A2,A3,A4,A5 are high temperature coefficients
%A8,A9,A10,A11,A12 are low tempertaure coefficients

for i = 1:length(temp_range)
    if temp_range(i)<=temp(2)
        Cp(i)= R*(A8 + (A9*temp_range(i)) + (A10*(temp_range(i).^2)) + (A11*(temp_range(i).^3)) + (A12*(temp_range(i).^4)));
    else
        Cp(i)= R*(A1 + (A2*temp_range(i)) + (A3*(temp_range(i).^2)) + (A4*(temp_range(i).^3)) + (A5*(temp_range(i).^4)));
    end
end
Function FOR CALCULATION OF ENTHALPY (H)
function [H] = enthaply(A1,A2,A3,A4,A5,A6,A8,A9,A10,A11,A12,A13,temp,temp_range,R)

%A1,A2,A3,A4,A5,A6 are high temperature coefficients
%A9,A10,A11,A12,A13 are low temperature coefficients

for i = 1:length(temp_range)
    if temp_range <= temp(2)
        H(i) = R*(A8*temp_range(i)+(A9*((temp_range(i).^2)/2))+(A10*((temp_range(i).^3)/3))+(A11*((temp_range(i).^4)/4))+(A12*(temp_range(i).^5)/5)+A13);

    else
        H(i) = R*(((A1*temp_range(i))+(A2*((temp_range(i).^2)/2))+(A3*(temp_range(i).^3)/3))+(A4*((temp_range(i).^4)/4))+(A5*((temp_range(i).^5)/5))+A6);

    end
end
Function FOR CALCULATION OF ENTROPY (S)
function [S] = entropy_1(A1,A2,A3,A4,A5,A7,A8,A9,A10,A11,A12,A14,temp,temp_range,R)

%A1,A2,A3,A4,A5,A7 are high temperature coefficients
%A9,A10,A11,A12,A14 are low temperature coefficients

for i = 1:length(temp_range)
    if temp_range <= temp(2)
        S(i) = R*(A8*log(temp_range(i))+(A9*(temp_range(i)))+(A10*((temp_range(i).^2)/2))+(A11*((temp_range(i).^3)/3))+(A12*(temp_range(i).^4)/4)+A14);

    else
        S(i) = R*((A1*log(temp_range(i)))+(A2*(temp_range(i)))+(A3*((temp_range(i).^2)/2))+(A4*((temp_range(i).^3)/3))+(A5*(temp_range(i).^4)/4)+A7);

    end
end
Function FOR CALCULATION OF MOLECULAR WEIGHT (m)
function[m_weight] = weight(species_name)

element = {'H','O','N','Ar','C','S'};
atomic_mass = [1.008, 15.999, 14.007, 39.948, 12.011, 32.065];

m_weight = 0;
for i = 1: length(species_name)
    for j = 1:length(element)
        if strcmp(species_name(i),element(j))
            m_weight = m_weight + atomic_mass(j);
            a = j;
        end
    end

  b = str2num(species_name(i));
         if b > 1

            m_weight = m_weight + atomic_mass(a)*(b-1)
         end
end
end
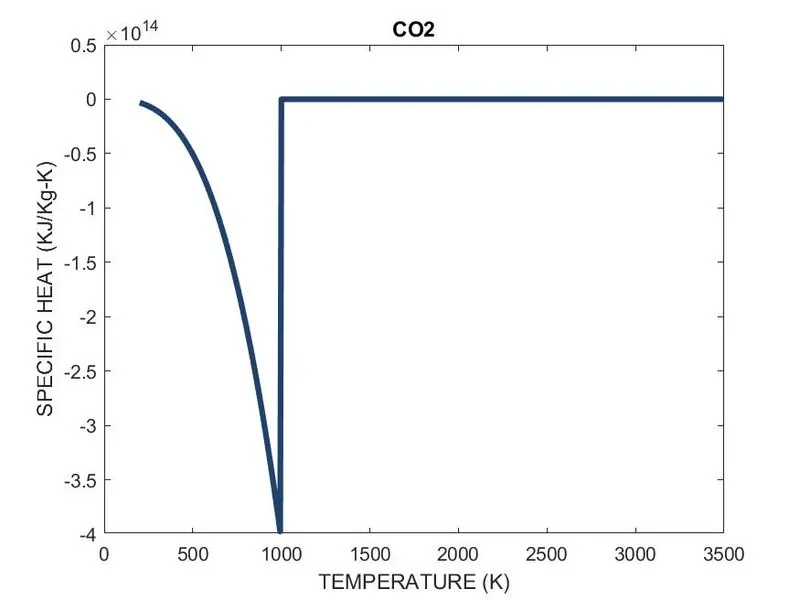
Error Faced
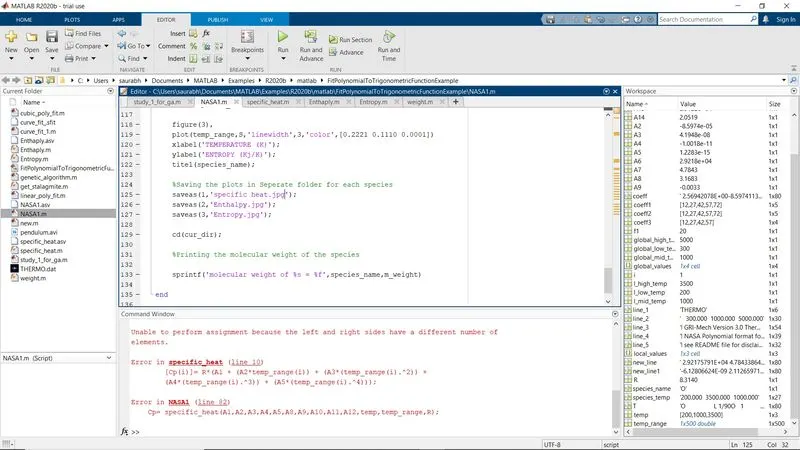
My arrays of coefficients are not correct thats why I was getting this error one coefficient is 1X2 hence the matrix is not same on Bothe side corrected the coefficient and the error is resolved.
Location of the file where all the folders are created and saved.
Molecular weight Displayed in command Window.
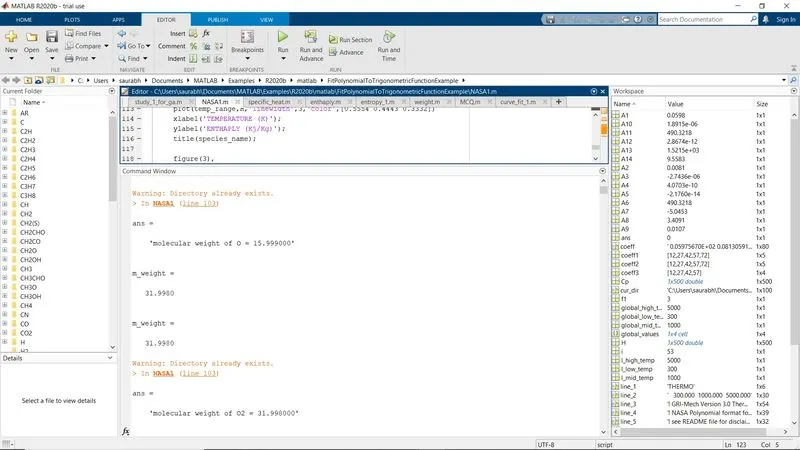
Similarly molecular weight for all the 53 species is displayed in command window.