Project 1 - Parsing NASA thermodynamic data
AIM:MATLAB program to fullfill the following objectives:
- Writing a code in MATLAB to parse the NASA thermodynamic datat file
- Wriitng a function that extracts the 14 coefficients and calculate the enthalpy,entropy,specific heats for all the data file.
- Calculating the molecular weight of each species and displaying it in the command window.
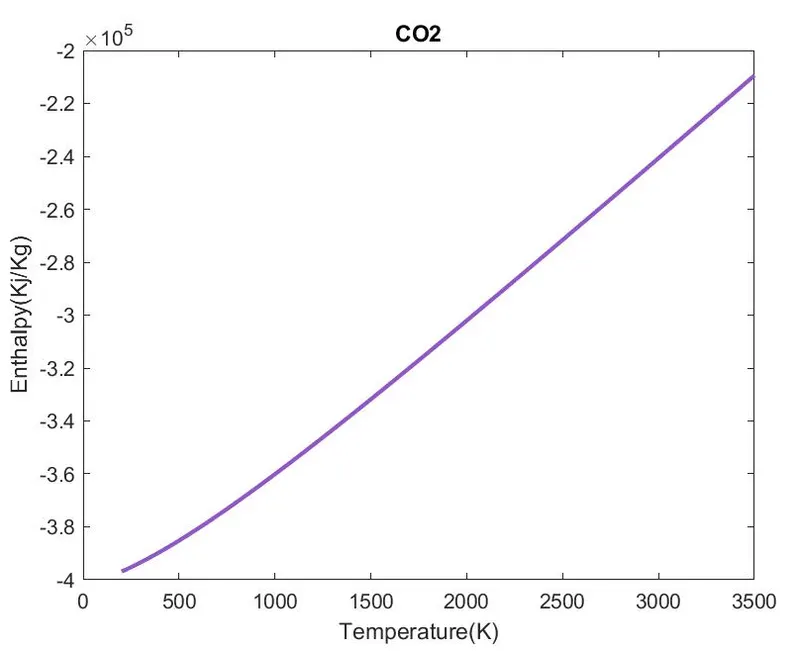
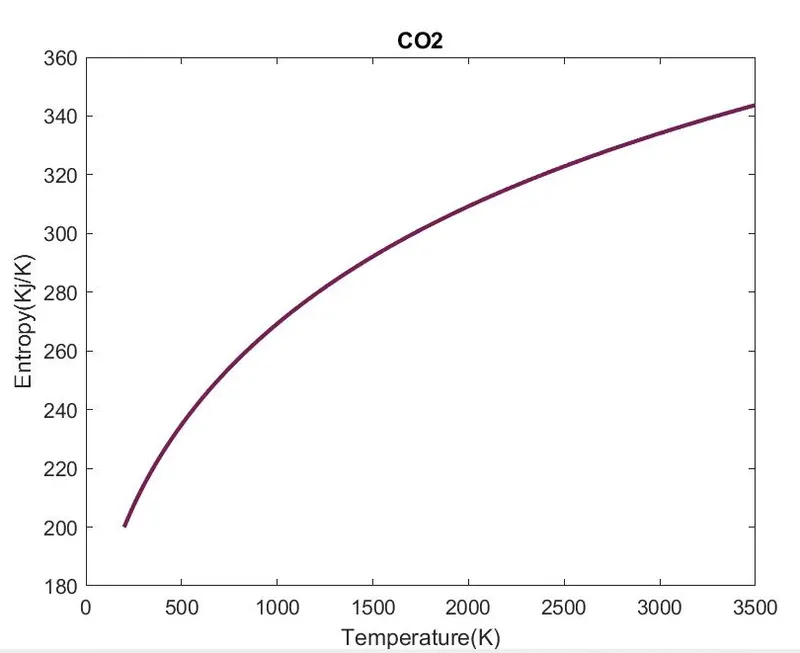
- Plotting the Cp,Enthalpy,Entropy for the local temperature range (low temerature:high temperature)specific for each species.
- saving the plots as images with appropriate names and dumping them in seperate folders for each species with suitable name.
BACKGROUND:NASA came up with polynomials thaat can be used to evaluate thermodynamic properties such as Cp,H,S.
- They have also documented the co-efficients that are required to evaluate these polynomials for 1000+ species.
- The thermodynamic properties in terms of the coefficients are given as:
-
The FIRST 7 coefficients are HIGH-temperature coefficients and the SECOND 7 coefficients are LOW-temperature coefficients.
- Here R is the universal gas constant,T is the temperature.
- SPECIFIC HEAT:It is defined as the amount of heat required to raise the temperature of unit mass of a substance by 1 degree.
- ENTHALPY:It is the sum of internal energy and the product of the pressure and volume of a thermodynamic process.
Enthalpy is an energy-like property or state ffunction- it has the dimensions of energy (and is thus measured in units of joules or ergs),and its value is deterrmined entirely by the temperature,pressure and composition of the system and not by its history.
- ENTROPY:It is the measure of a system's thermal energy per unit temperature that is unavailable for doing useful work.
Because work is obtained from ordered molecular motion,the amount of entropy is also a measure of the molecualr disorder,or randomness,of a system.The concept of entropy provides deep insight into the direction of spontaneous change for many everyday phenomena.
- File parsing here means extracting the useful imformation from a file and utilizing thaat information for our program.
SOLUTION ALGORITHM:
- The program begins with the clear all,close all,clc commands to free up the command window for the workspace.
- We will then read the data from the external NASA thermodynamic file using fopen(to open the file)and fgetl(to read the content in the file line by line)commands.
- The useful header information will be extracted from the file such as global temperature limits.
- Then we will proceeed to extract the individual species data of all the species present in the file using fgetl command to read the file line by line and skipping the line not containing any useful data.
- The data that is to be extracted for all the 53 species mentioned in the file are 14 coefficients (7 for higher temperature and for lower temperature),species name and the local temperature limits.
- This process will be carried out with the help of a for loop.
- Calculation of a specific heat,enthalpy,entropy and molecular weight will be done in seperate function files and will be called in the main program.
- Then we will create plots for specific heat vs temperature ,enthalpy vs temperature,entropy vs temperature for all the 53 species and these 3 plots will be saved in the seperate folders for each species.
- After this we will display the molecular weight of all the species in the command window.
- The code for the entire program will be written in MATLAB.
MATLANB CODE:
MAIN PROGRAM WITH FUCNTION PROGRAM:
clear all
close all
clc

f1 = fopen('THERMO.dat','r')
line_1 = fgetl(f1); %skipping this line
line_2 = fgetl(f1);

%obtaining global temperature values
%storing them as numbers in seperate v/=

global_values = strsplit(line_2,' ');
g_low_temp = str2num(global_values{2});
g_mid_temp = str2num(global_values{3});
g_high_temp  =str2num(global_values{4});

line_3 = fgetl(f1);  %skipping this line
line_4 = fgetl(f1);  %skipping this line
line_5 = fgetl(f1);

%defining input universal gas constant
R = 8.314;
for i = 1:53
    T = fgetl(f1);

    %extracting the species name
    species_name = T(1:9);
    species_name = deblank(species_name);%removing blank space

    %extracting local temperatures
    species_temp = T(49:75);
    local_values = strsplit(species_temp,' ');
    l_low_temp = str2num(local_values{1});
    l_mid_temp = str2num(local_values{3});
    l_high_temp = str2num(local_values{2});

    %storing the local temperatures in a variable
    temp = [l_low_temp l_mid_temp l_high_temp];

    temp_range = linspace(l_low_temp,l_high_temp,500);


%getting coefficients

coeff = fgetl(f1);
coeff1 = findstr(coeff,'E');

%extracting the coefficients
a1 = coeff(1:coeff1(1)+3);
a1 = str2num(a1);
a2 = coeff(coeff1(1)+4:coeff1(2)+3);
a2 = str2num(a2);
a3 = coeff(coeff1(2)+4:coeff1(3)+3);
a3 = str2num(a3);
a4 = coeff(coeff1(3)+4:coeff1(4)+3);
a4 = str2num(a4);
a5 = coeff(coeff1(4)+4:coeff1(5)+3);
a5 = str2num(a5);

new_line = fgetl(f1);

coeff2 = findstr(new_line,'E');
a6 = new_line(1:coeff2(1)+3);
a6 = str2num(a6);
a7 = new_line(coeff2(1)+4:coeff2(2)+3);
a7 = str2num(a7);
a8 = new_line(coeff2(2)+4:coeff2(3)+3);
a8 = str2num(a8);
a9 = new_line(coeff2(3)+4:coeff2(4)+3);
a9 = str2num(a9);
a10 = new_line(coeff2(4)+4:coeff2(5)+3);
a10 = str2num(a10);

new_line1 = fgetl(f1);
coeff_3 = findstr(new_line1,'E');
a11 = new_line1(1:coeff_3(1)+3);
a11 = str2num(a11);
a12 = new_line1(coeff_3(1)+4:coeff_3(2)+3);
a12 = str2num(a12);
a13 = new_line1(coeff_3(2)+4:coeff_3(3)+3);
a13 = str2num(a13);
a14 = new_line1(coeff_3(3)+4:coeff_3(4)+3);
a14 = str2num(a14);

%specific heat calculation
% Cp = specific_heat(a1,a2,a3,a4,a5,a8,a9,a10,a11,a12,temp,temp_range,R);
for i = 1:length(temp_range)
    if temp_range(i)<=temp(2)
        Cp(i) = R*(a8 + (a9*temp_range(i)) + (a10*(temp_range(i).^2)) + (a11*(temp_range(i).^3)) + (a12*(temp_range(i).^4)));
    else
        Cp(i) = R*(a1 + (a2*temp_range(i)) + (a3*(temp_range(i).^2)) + (a4*(temp_range(i).^3)) + (a5*(temp_range(i).^4)));
    end
end
%enthalpy calculation
% H = enthalpy(a1,a2,a3,a4,a5,a6,a8,a9,a10,a11,a12,a13,temp,temp_range,R);
for i = 1:length(temp_range)
    if temp_range(i)<=temp(2)
        H(i) = R*((a8*temp_range(i)) + (a9*((temp_range(i).^2)/2)) + (a10*((temp_range(i).^3)/3)) + (a11*((temp_range(i).^4)/4)) + (a12*((temp_range(i).^5)/5)) + a13);
    else
        H(i) = R*((a1*temp_range(i)) + (a2*((temp_range(i).^2)/2)) + (a3*((temp_range(i).^3)/3)) + (a4*((temp_range(i).^4)/4)) + (a5*((temp_range(i).^5)/5)) + a6);
    end
end
%entropy calculation

%  S = entropy(a1,a2,a3,a4,a5,a7,a8,a9,a10,a11,a12,a14,temp,temp_range,R);
for i = 1:length(temp_range)
    if temp_range(i)<=temp(2)
    S(i) = R.*((a8*log(temp_range(i))) + (a9*temp_range(i)) + (a10*((temp_range(i).^2)/2)) + (a11*((temp_range(i)^3)/3)) + (a12*((temp_range(i).^4)/4)) + a14);
    else

        S(i) = R.*((a1*log(temp_range(i))) + (a2*temp_range(i)) + (a3*((temp_range(i).^2)/2)) + (a4*((temp_range(i).^3)/3)) + (a5*((temp_range(i).^4)/4)) + a7);
    end
end
%calculation for molecular weight
% mol_mass = weight(species_name);
  elements = ['H','C','O','N','A'];
  atomic_weight = [1.0079 12.0107 15.999 14.0067 39.948];
  mol_mass = 0;
  for l = 1:length(species_name);
    for m = 1:length(atomic_weight);
  if strcmp(species_name(1),elements(m));
    mol_mass = mol_mass + atomic_weight(m);
    position = m;
end
    end
    n = str2double(species_name(1));
    if n>1
        mol_mass = mol_mass + atomic_weight(position)*(n-1);
    end
  end


fprintf('molecular mass of %s is %f',species_name,mol_mass)


%plotting and saving
cur_dir = pwd;

%making a new folder for each species
mkdir('species_name');
cd(species_name);

figure(1)
plot(temp_range,Cp,'linewidth',2,'color',[0.2345 0.4567 0.5678])
xlabel('Temperature(K)');
ylabel('specific heat(Kj/Kg-K)');
title(species_name);

figure(2)
plot(temp_range,H,'linewidth',2,'color',[0.5678 0.3423 0.7874])
xlabel('Temperature(K)');
ylabel('Enthalpy(Kj/Kg)');
title(species_name);

figure(3)
plot(temp_range,S,'linewidth',2,'color',[0.4567 0.1234 0.3324])
xlabel('Temperature(K)');
ylabel('Entropy(Kj/K)');
title(species_name);

%saving the plots in seperate folder for each species
saveas(1,'specific heat.jpg');
saveas(1,'enthalpy.jpg');
saveas(1,'entropy.jpg');

cd(cur_dir);
%printing the molecular weight of the species
 sprintf('molecular weight of %s:%f u',species_name,mol_mass);

end

%closing the file
fclose(f1)
OUTPUT FOR COMMAND WINDOWS:
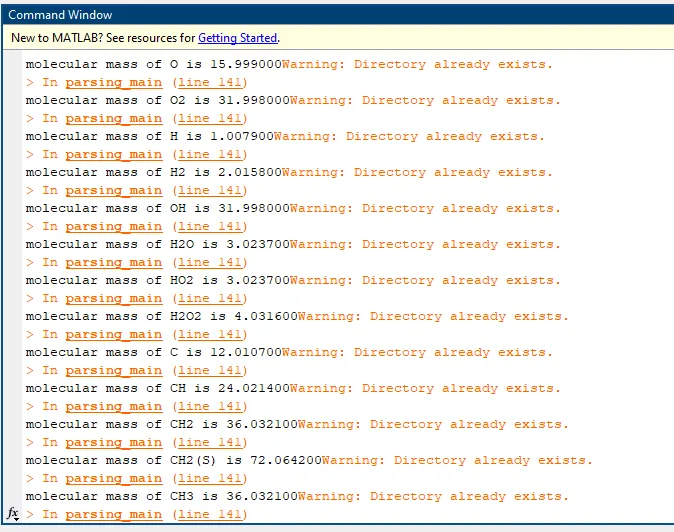
In the same way the molecular weight of all the 53 species is displayed in the command window.
plots of O2,N2,CO2
Plots of o2
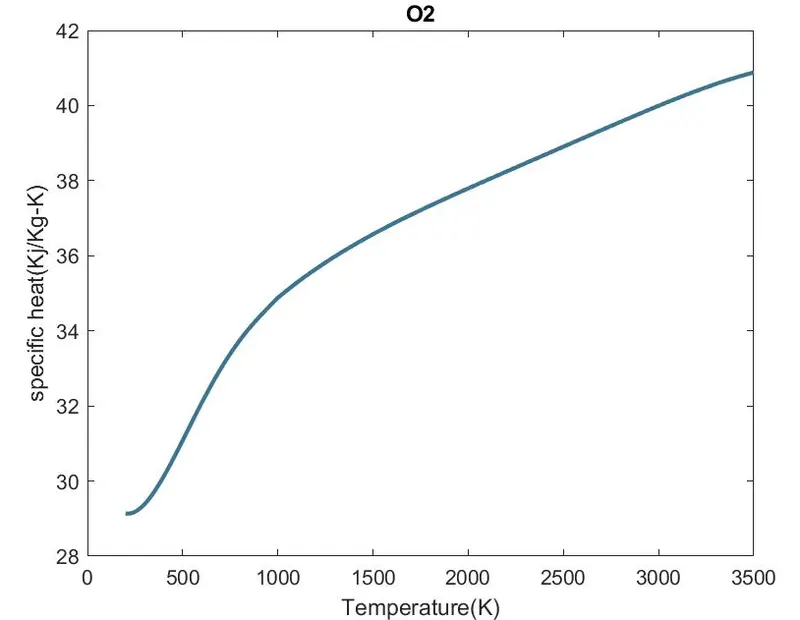
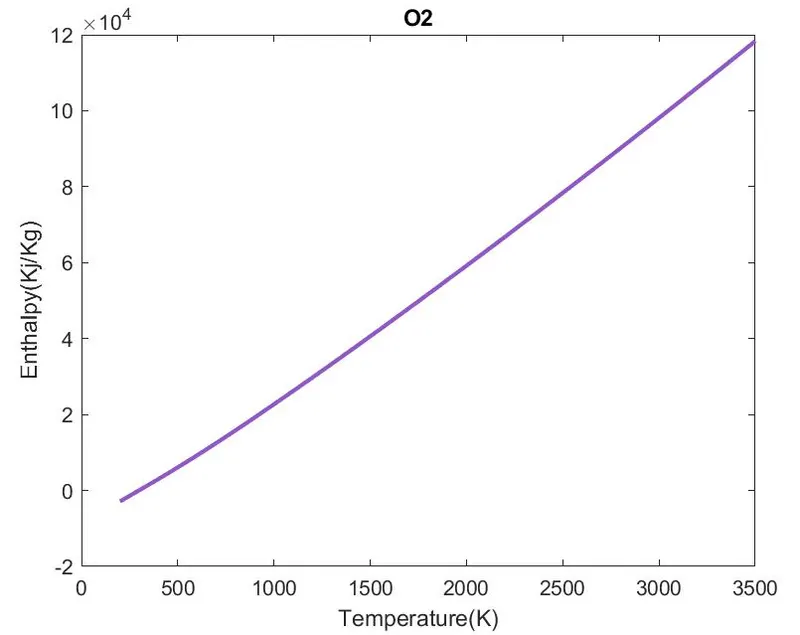
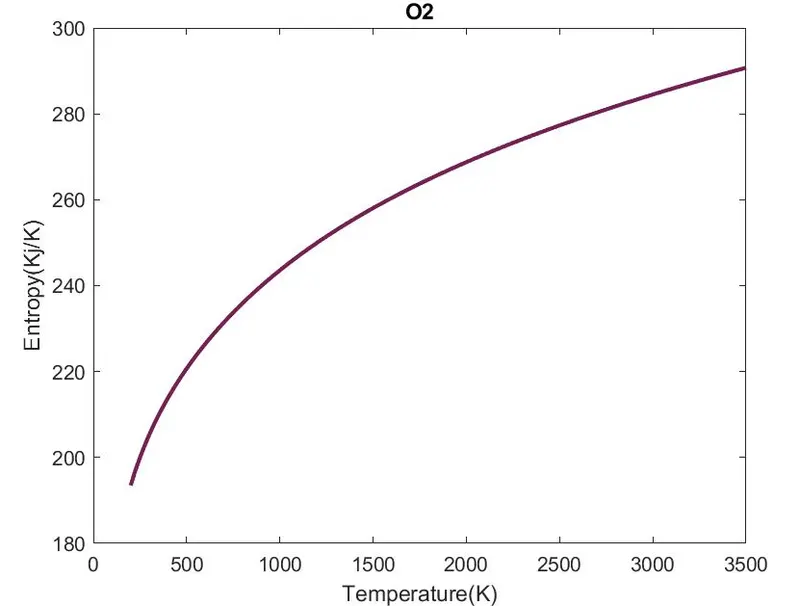
Plots of N2
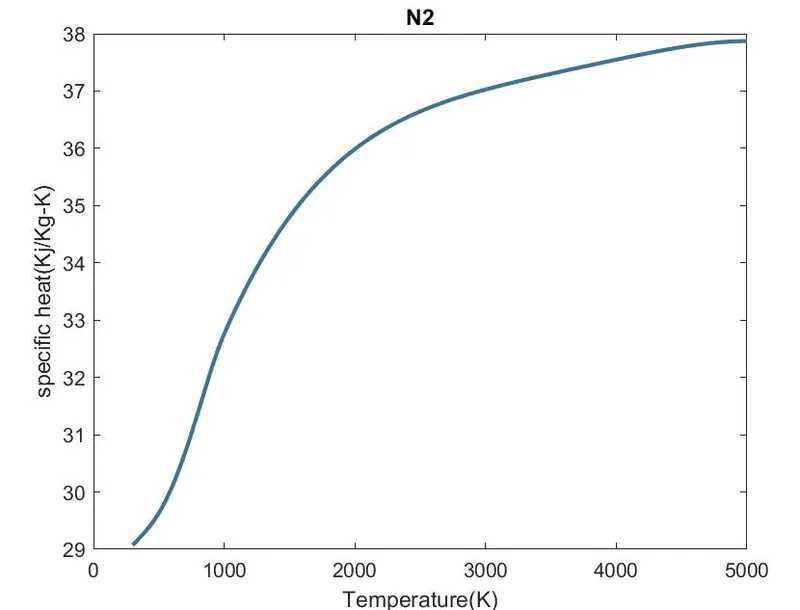
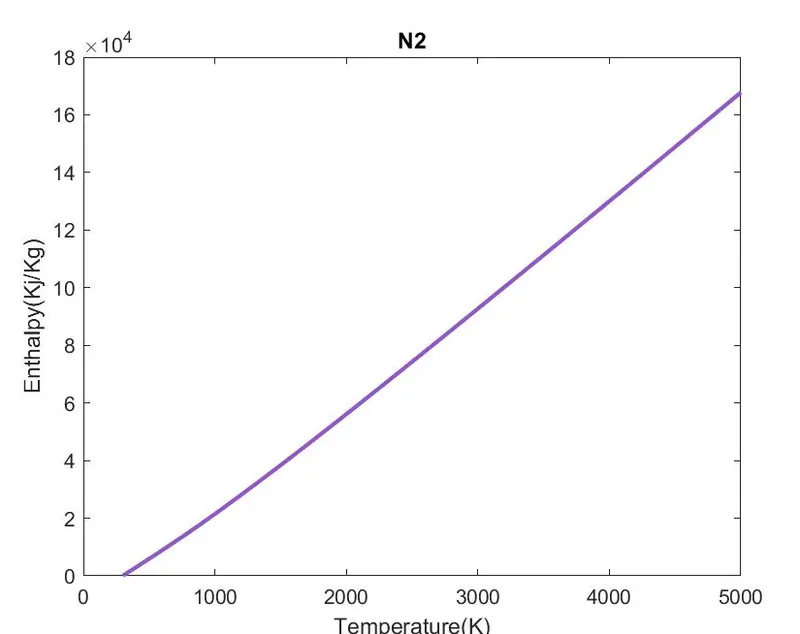
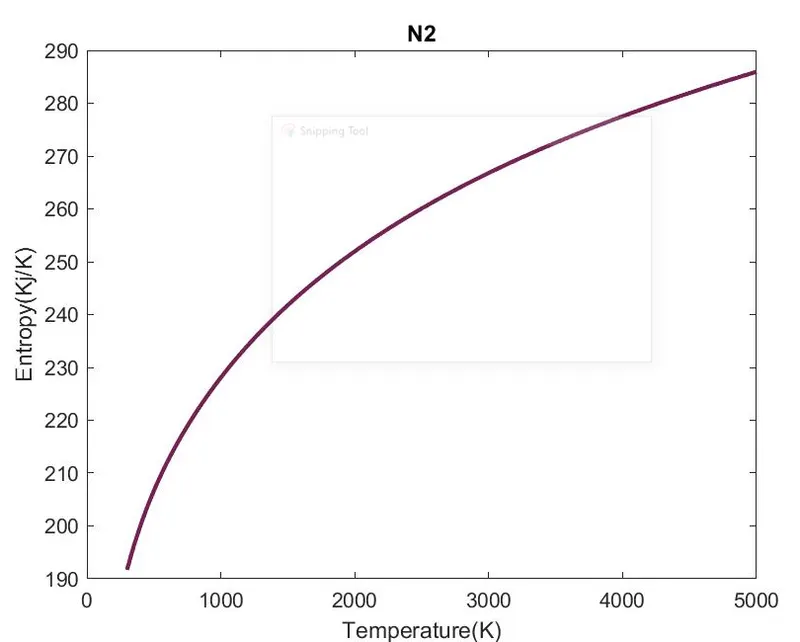
Plots of co2
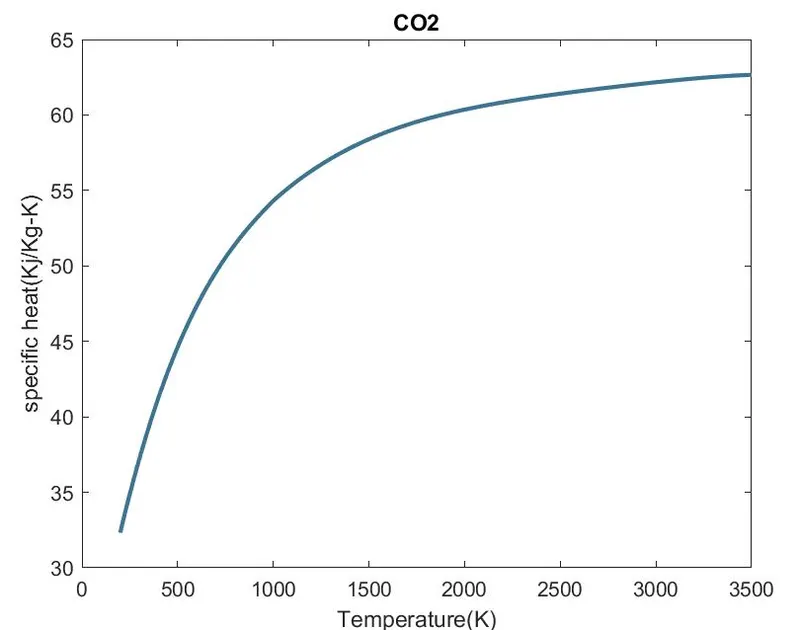
- screen shots showing location of foldders created for species.



ERRORS :
- Faced too many errors while completing the program but forgot to take screen shots due to focusing on clearing the errors.
CONCLUSION:
- The file parsing is done for NASA thermodynamic data and the thermodynamic properties like specific heat,enthalpy and entropy are calculated.Also plotting is done for the same and stored in the seperate directory by using MATLAB code
REFERENCES
- https://www.mathworks.com/help/matlab/ref/blanks.html#:~:text=Input%20Arguments,-collapse%20all&text=Number%20of%20space%20characters%2C%20specified,blanks%20treats%20it%20as%200%20.
- https://www.mathworks.com/help/matlab/ref/mkdir.html#:~:text=status%20%3D%20mkdir(___)%20creates,combinations%20in%20the%20previous%20syntaxes.
- https://www.mathworks.com/help/matlab/ref/cd.html#:~:text=cd%20displays%20the%20current%20folder,%C2%AE%20finishes%20executing%20the%20function.