Project 1 - Parsing NASA thermodynamic data
Aim :
To
1.Write a function that extracts the 14 co-efficients and calculates the enthalpy, entropy and specific heats for all the species in the data file.
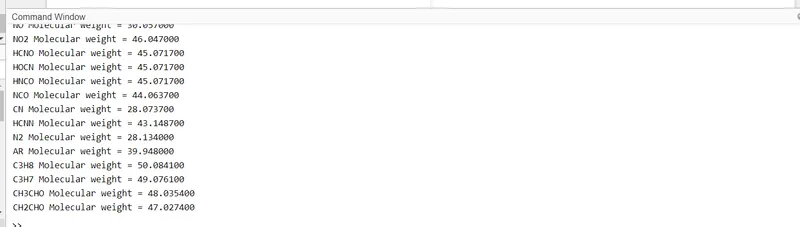
2.Calculate the molecular weight of each species and display it in the command window.
3.Plot the Cp, Enthalpy and Entropy for the local temperature range (low temperature : high temperature) specific for each species.
4.Save the plots as images with appropriate names and save them in separate folders for each species with suitable name. All these should be generated automatically.
5. The main program will just take the "THERMO.dat" file as an input and generate Cp, H and S plots.
Theory :
File parsing is the process of analyzing a string of text or symbols, either in natural language, computer language or data structures, conforming to the rules of a formal grammar.
Code :
Main Code to parse data from the THERMO file, plot the results and save them in separate files
clear all
close
clc

f1 = fopen("THERMO.txt",'r');

fgetl(f1);          %reading the first line of the file
t_line = fgetl(f1);  %reading the Global Temperature from the file

t = strsplit(t_line,' ');
global_low_temp = str2num(t{2});
global_mid_temp = str2num(t{3});
global_high_temp = str2num(t{4});

fgetl(f1);
fgetl(f1);
fgetl(f1);   %ignoring the next 3 lines of the file


for(i = 1:53)

t_line2 = fgetl(f1);     %Reading the line containin the name of the species and local temperatures
s = strsplit(t_line2,' ');
spname = s{1};           %Getting the name of the species
local_low_temp = str2double(s{length(s)-3});
local_mid_temp = str2double(s{length(s)-2});
local_high_temp = str2double(s{length(s)-1});

t_line3 = fgetl(f1);               %reading 1st line of coefficients
a = strfind(t_line3,'E');

b1 = str2double(t_line3(1:(a+3)));        %1st coefficient
b2 = str2double(t_line3(a(1)+4:a(2)+3));  %2nd coefficeint
b3 = str2double(t_line3(a(2)+4:a(3)+3));  %3rd coefficient
b4 = str2double(t_line3(a(3)+4:a(4)+3));  %4th coefficient
b5 = str2double(t_line3(a(4)+4:a(5)+3));  %5th coefficeint

t_line4 = fgetl(f1);               %reading 2nd line of coefficients
b6 = str2double(t_line4(1:(a+3)));        %6th coefficient
b7 = str2double(t_line4(a(1)+4:a(2)+3));  %7th coefficeint
b8 = str2double(t_line4(a(2)+4:a(3)+3));  %8th coefficient
b9 = str2double(t_line4(a(3)+4:a(4)+3));  %9th coefficient
b10 = str2double(t_line4(a(4)+4:a(5)+3)); %10th coefficeint

t_line5 = fgetl(f1);                %reading 3rd line of coefficients
b11 = str2double(t_line5(1:(a+3)));       %11th coefficient
b12 = str2double(t_line5(a(1)+4:a(2)+3)); %12th coefficeint
b13 = str2double(t_line5(a(2)+4:a(3)+3)); %13th coefficient
b14 = str2double(t_line5(a(3)+4:a(4)+3)); %14th coefficient

R = 8.314; %universal gas Constant

% To produce 100 different value for T between local high and low
% temperatures
T = linspace(local_low_temp,local_high_temp,100);

%To calculate specific heat
cp = spcfcht(b1,b2,b3,b4,b5,b8,b9,b10,b11,b12,R,T,local_mid_temp);
%To calculate enthalpy
h = enthalpy(b1,b2,b3,b4,b5,b6,b8,b9,b10,b11,b12,b13,R,T,local_mid_temp);
%To calculate entropy
s = entrpy(b1,b2,b3,b4,b5,b7,b8,b9,b10,b11,b12,b14,local_mid_temp,R,T);

mkdir('/MATLAB Drive/',spname) % Making a new folder by the name of therm_data to save all the plots
cd(spname)                 %changing the current directory to therm_data


%plotting graph between temperature and specific heat
figure(1)
plot(T,cp);
xlabel('temperature');
ylabel('Specific heat');
title('Temperature vs Specific Heat');
saveas(1,'specific_heat','jpg');

%plotting graph between temperature and enthalpy
figure(2)
plot(T,h);
xlabel('Temperature');
ylabel('Enthalpy');
title('Temperature vs Enthalpy');
saveas(2,'enthalpy','jpg');

%plotting graph between temperature and entropy
figure(3)
plot(T,s);
xlabel('Temperature');
ylabel('Entropy');
title('Temperature vs Entropy');
saveas(3,'entropy','jpg');

cd ..

m = molwt(spname); %to calculate molecular weight of the given specie

k = sprintf('%s Molecular weight = %f',spname,m);
disp(k);
end
fclose(f1);
Code for the Specific heat calculation function
function [cp] = spcfcht(b1,b2,b3,b4,b5,b8,b9,b10,b11,b12,R,T,local_mid_temp)

if(T>local_mid_temp)
    cp = R.*(b1+(b2.*T)+(b3.*(T.^2))+(b4.*(T.^3))+(b5.*(T.^4)));
else
    cp = R.*(b8+(b9.*T)+(b10.*(T.^2))+(b11.*(T.^3))+(b12.*(T.^4)));
end
Code for the Enthalpy Calculation function
function [h] = enthalpy(b1,b2,b3,b4,b5,b6,b8,b9,b10,b11,b12,b13,R,T,local_mid_temp)

if(T>local_mid_temp)
    h = R.*T.*(b1+((b2.*T)./2)+((b3.*(T.^2))./2)+((b4.*(T.^3))./2)+((b5.*(T.^4))./2)+(b6./T));
else
    h = R.*T.*(b8+((b9.*T)./2)+((b10.*(T.^2))./2)+((b11.*(T.^3))./2)+((b12.*(T.^4))./2)+(b13./T));

end
Code for the Entropy calculation function
function [s] = entrpy(b1,b2,b3,b4,b5,b7,b8,b9,b10,b11,b12,b14,local_mid_temp,R,T)

if(T>local_mid_temp)
    s = R.*(b1.*log(T) + b2.*T + (b3.*(T.^2))./2 + (b4.*(T.^3))./3 + (b5.*(T.^4))./4 + b7);
else
    s = R.*(b8.*log(T) + b9.*T + (b10.*(T.^2))./2 + (b11.*(T.^3))./3 + (b12.*(T.^4))./4 + b14);

end
Code for the Molecular weight calculation function
function [m] = molwt(spname)

elements = [ 'H','C','O','N','A','S'];
mass = [1.008,14.0067,15.99,14.067,39.948,32];
mw = 0;

for i = 1:length(spname)
    for j = 1:length(elements)
        if strcmpi(spname(i),elements(j))
            mw = mw + mass(j);
            a=j;
         end
    end

    n = str2double(spname(i));
    if n>1
        mw = mw + mass(a)*(n-1);
    end
end
m = mw;
end
Results :
Screenshot of all the saved files
Plots for O2
Plots for N2
Plots for CO2
Screenshot of all the saved files
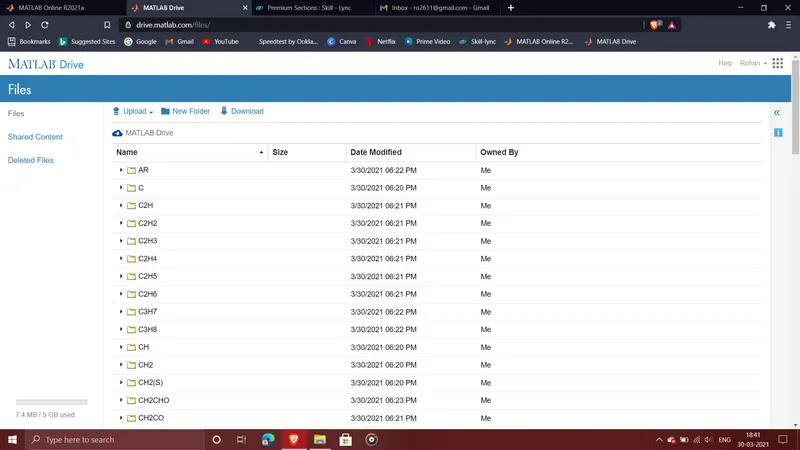
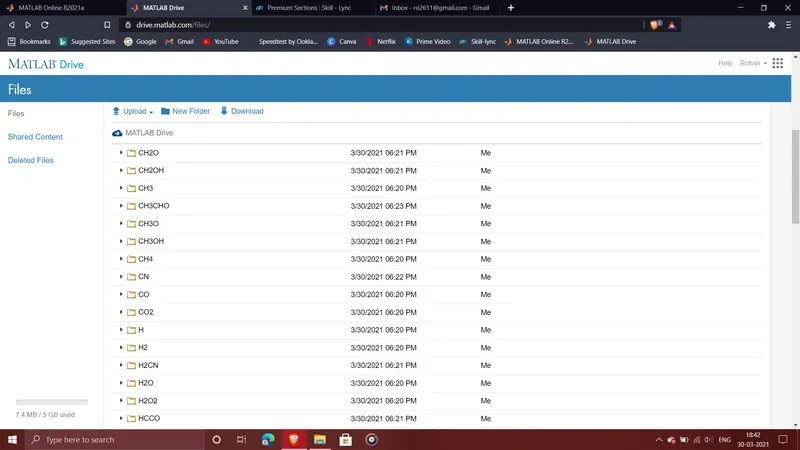
Screenshot of the command window showing the molecular weights of all the species