Project 1 - Parsing NASA thermodynamic data
AIM:
Write a MATLAB code to parse NASA Thermodynamic data file to calculate the Specific heat, Enthalpy, Entropy, and molecular weight of each species.
OBJECTIVES:
- To read the data from the 'THERMO.dat' file and extract all the coefficients for each species to calculate entropy, specific heat, and enthalpy.
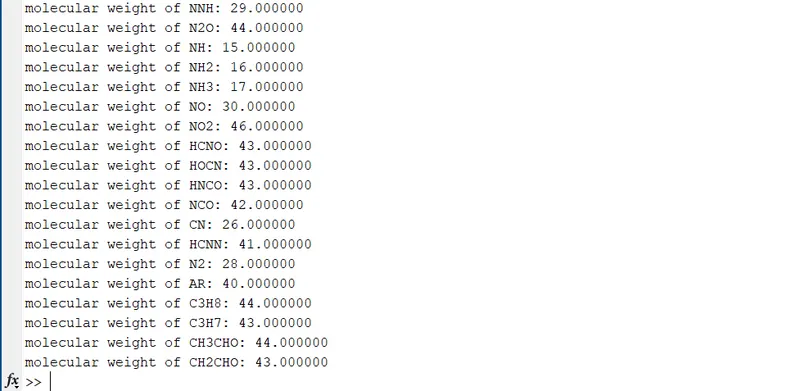
- Next to calculate the molecular weight of each species and display the molecular weight in the command window.
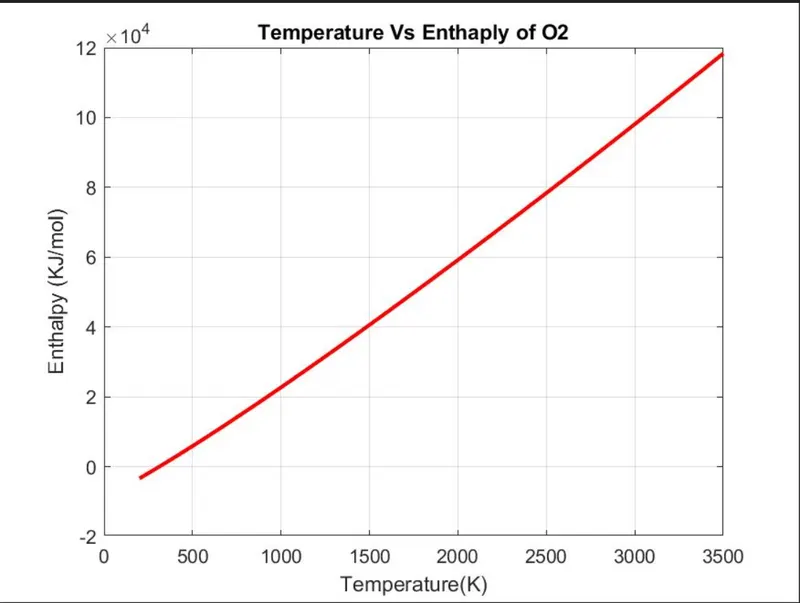
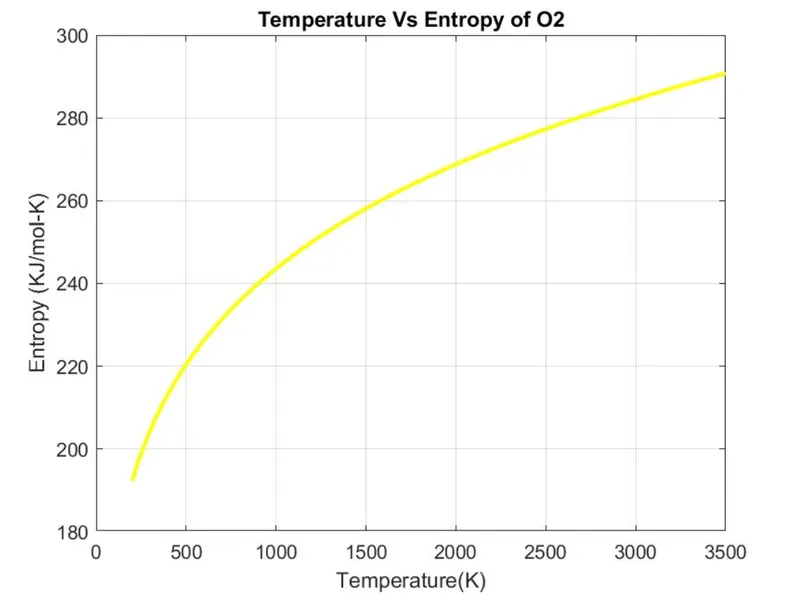
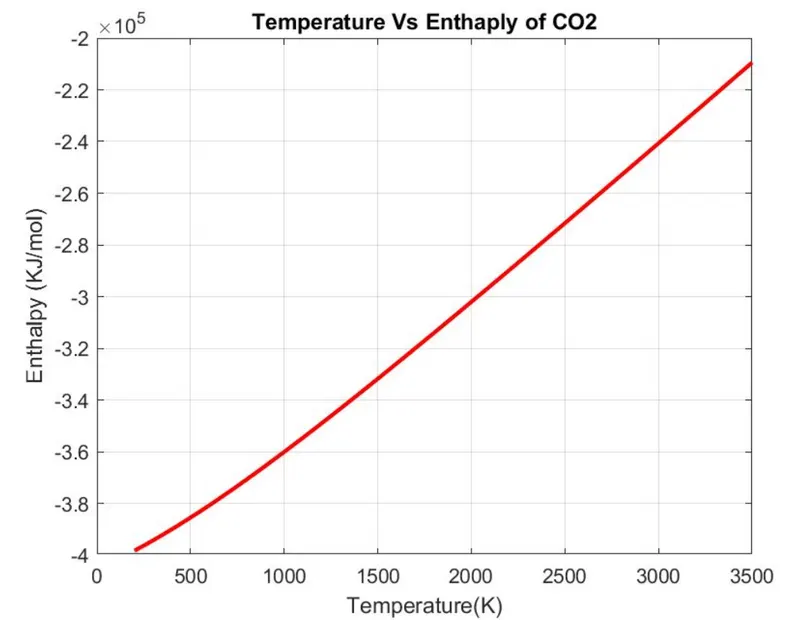
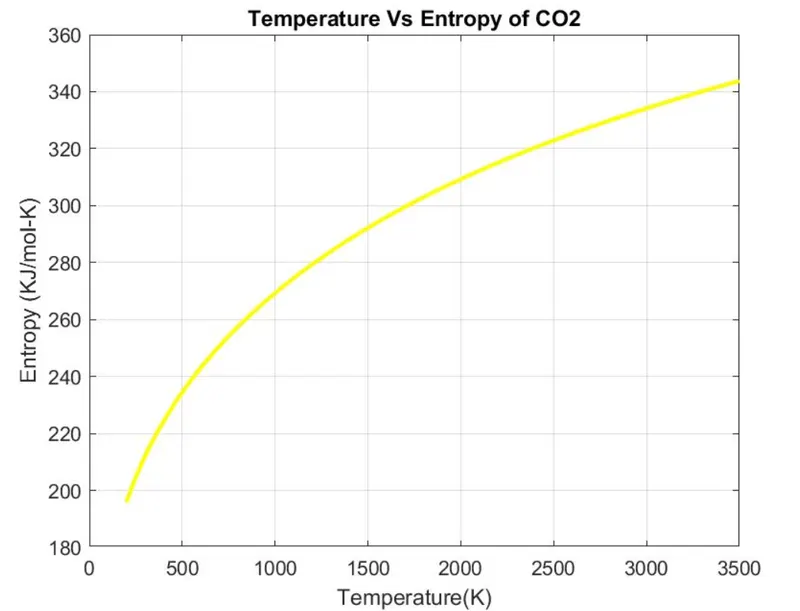
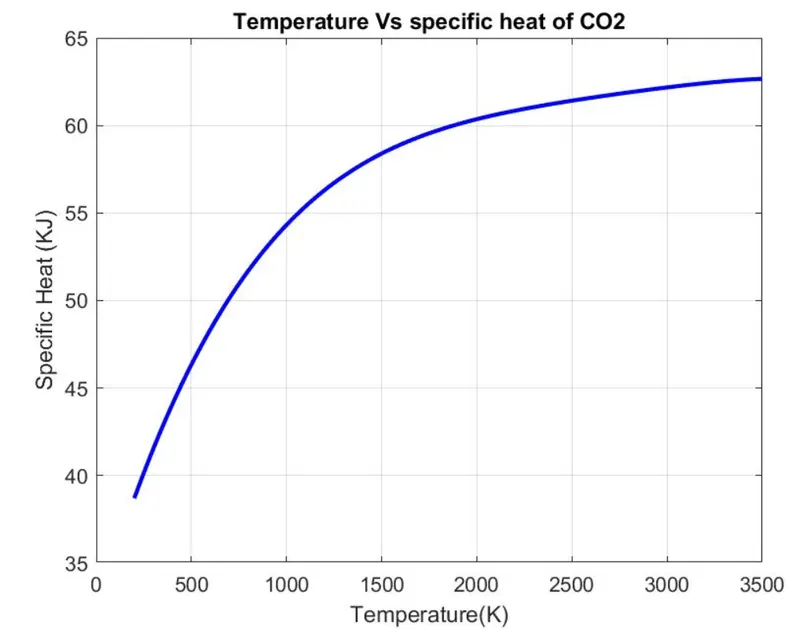
- To plot the Enthalpy, Entropy, and specific heat for local temperature range for each species.
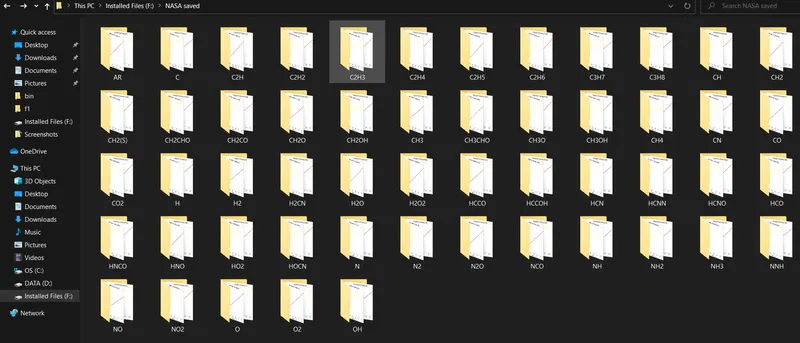
- Finally to save the plots as images with appropriate names and store them in separate folders for each species with respective names.
THEORY:
FILE PARSING
File parsing is a process that is used to split a given large file(input) into pieces of data that can be easily be stored or manipulated to get desired output. Also, during this procedure data(input) is divided into component parts so that its syntax can be analyzed, categorized, and understood. In file parsing, we split an entire data file into parts then recognize the parts to convert them into a much simpler form than the string. The file parsing technique is used in big data processing in order to act as an interface between the program and large data set. We can either 'Read' or 'write' the data file based on our convenience.
- Process 1-'File writing'
In this process, we are writing the data into a required file by using the command fopen(permission channel 'w').
syntax: variable_name=fopen('filename.txt','w')
fclose(variable_name);
Note: Value of variable_name which is returned on command window when above syntax computed should return a positive number.
- Process 2-'File reading'
In this process, we are read the data from a required file by using the command fopen(permission channel 'r').
syntax: variable_name=fopen('filename.txt','r')
fclose(variable_name);
ENTHALPY: is the measurement of energy in a thermodynamic system. The quantity of enthalpy equals the content of a system, equivalent to the system's internal energy plus the product of volume and pressure. Enthalpy is represented as 'H'.
ENTROPY: is a property of a thermodynamic system that expresses the direction or outcome of spontaneous changes in the system. Entropy is represented by 'S'.
SPECIFIC HEAT: is the ratio of the quantity of heat required to raise the temperature of a body one degree to that required to raise the temperature of an equal mass of water by one degree. Specific heat is represented by 'Cp'.
MOLECULAR WEIGHT: The sum of the atomic masses of all atoms in a molecule, based on a scale on which the atomic masses of hydrogen, carbon, nitrogen, oxygen, and argon are (1,12,14,16, and 40).
GOVERNING EQUATIONS:
Formula to calculate specific heat, entropy, and enthalpy
- Specific heat(Cp)
`(Cp)/R=a1+a2*T+a3*T^2+a4*T^3+a5*T^4` this equation is used for temperature's value greater than local mid temperature(1000K).
`(Cp)/R=a8+a9*T+a10*T^2+a11*T^3+a12*T^4` this equation is used for temperature's value lesser than local mid temperature(1000K).
- Entropy(S)
`S/R=a1*lnT+a2*T+(a3*T^2)/2+(a4*T^3)/3+(a5*T^4)/4+a7` this equation is used for temperature's value greater than local mid temperature(1000K).
`S/R=a8*lnT+a9*T+(a10*T^2)/2+(a11*T^3)/3+(a12*T^4)/4+a14` this equation is used for temperature's value lesser than local mid temperature(1000K).
- Enthalpy(H)
`H/(R*T)=a1+(a2*T)/2+(a3*T^2)/3+(a4*T^3)/4+(a5*T^4)/5+a6/T` this equation is used for temperature's value greater than local mid temperature(1000K).
`H/(R*T)=a8+(a9*T)/2+(a10*T^2)/3+(a11*T^3)/4+(a12*T^4)/5+a13/T` this equation is used for temperature's value lesser than local mid temperature(1000K).
Syntax for File parsing
- Fgetl command returns the next line of the specified file removing the newline character.
SYNTAX: variable_name=fgetl(filename)
- String split (Strsplit) command is used to split the string by using a delimiter.
SYNTAX: variable_name=strsplit(line,delimiter)
- String to double(str2double) command is used to convert the text in the string to a double-precision value.
SYNTAX: variable_name=str2double(str)
- String find(strfind) command is used to return the string which is present before the character specifier.
SYNTAX: variable_name=strfind(str,specifier)
- String compare(strcmp) command is used to compare two strings which returns output true(1) or false(0).
SYNTAX: strcmp(str1,str2)
- mkdir command is used to create a new folder.
SYNTAX: mkdir(filename)
- cd command is used to change the current folder to a new folder or to specify the path to create the folder.
SYNTAX: cd(filename) or cd('F:\NASA saved data')
- saveas command is used to save the figures into the desired extension such as .jpg, .png etc.
SYNTAX: Saveas(figure_name,'name.jpg')
MATLAB CODE:
clear all
close all
clc

%Reading the data from 'thermo.dat'
f=fopen('F:\THERMO.dat','r');
m=fgetl(f);

%extracting the global temperatures
temp=fgetl(f);
a=strsplit(temp,' ');
global_temp1=str2double(a{length(a)-2});
global_temp2=str2double(a{length(a)-1});
global_temp3=str2double(a{length(a)});

%Next three line contains comment section we are neglecting them
for i=1:3
    fgetl(f);
end
for i=1:53
%extracting particular species local temperatures and coefficients
line=fgetl(f);
b1=strsplit(line,' ');
species=b1{1};
local_temp1=str2double(b1{length(b1)-3});
local_temp2=str2double(b1{length(b1)-2});
local_temp3=str2double(b1{length(b1)-1});

%extracting high and low temperature coefficients
line1=fgetl(f);
b2=strfind(line1,'E');
a1=str2double(line1(1:b2(1)+3));
a2=str2double(line1(b2(1)+4:b2(2)+3));
a3=str2double(line1(b2(2)+4:b2(3)+3));
a4=str2double(line1(b2(3)+4:b2(4)+3));
a5=str2double(line1(b2(4)+4:b2(5)+3));

line2=fgetl(f);
b3=strfind(line2,'E');
a6=str2double(line2(1:b3(1)+3));
a7=str2double(line2(b3(1)+4:b3(2)+3));
a8=str2double(line2(b3(2)+4:b3(3)+3));
a9=str2double(line2(b3(3)+4:b3(4)+3));
a10=str2double(line2(b3(4)+4:b3(5)+3));

line3=fgetl(f);
b4=strfind(line3,'E');
a11=str2double(line3(1:b4(1)+3));
a12=str2double(line3(b4(1)+4:b4(2)+3));
a13=str2double(line3(b4(2)+4:b4(3)+3));
a14=str2double(line3(b4(3)+4:b4(4)+3));

%Defining universal Gas constant
R=8.3145;     %j/mol-K
local_midtemp=1000;

%calculating cp,H and S
T=linspace(local_temp1,local_temp2,1000);
for j=1: length(T)
    if T< local_midtemp
        Cp=R*(a8+a9*T+a10*(T).^2+a11*(T).^3+a12*(T).^4);
         H=R*T.*(a8+(a9*T)/2+(a10*T.^2)/3+(a11*T.^3)/4+(a12*T.^4)/5+a13./T);
         S=R*(a8.*log(T)+a9*T+(a10*T.^2)/2+(a11*T.^3)/3+(a12*T.^4)/4+a14)
    else
        Cp=R*(a1+a2*T+a3*(T).^2+a4*(T).^3+a5*(T).^4);
        H=R*T.*(a1+(a2.*T)/2+(a3*T.^2)/3+(a4*T.^3)/4+(a5*T.^4)/5+a6./T);
        S=R*(a1.*log(T)+a2*T+(a3*T.^2)/2+(a4*T.^3)/3+(a5*T.^4)/4+a7);
    end
end

%calculating the molecular weight for given species
atoms=['O','H','N','C','Ar'];
atomic_weight=[16,1,14,12,40];
M=0;
for i=1:length(species)
    for j=1:length(atoms)
        if strcmp(species(i),atoms(j))
            M=M+atomic_weight(j);
            a=j;
        end
    end
    B=str2double(species(i));
    if B>1
        M=M+atomic_weight(a)*(B-1);
    end

end
%displaying the molecular weight
   fprintf('molecular weight of %s: ',species);
   fprintf('%f\n',M);

%Creating new folder for all species and storing relavent graphs
       cd('F:\NASA saved');
       mkdir(species);
       cd(species);
       %Writing molecular weight
       file=fopen('molecular weight.txt','w');
       fprintf(file,'molecular weight of %s is %f',species,M);
       fclose(file);

       %plotting Temperature Vs Specific heat(Saving)
       figure(1)
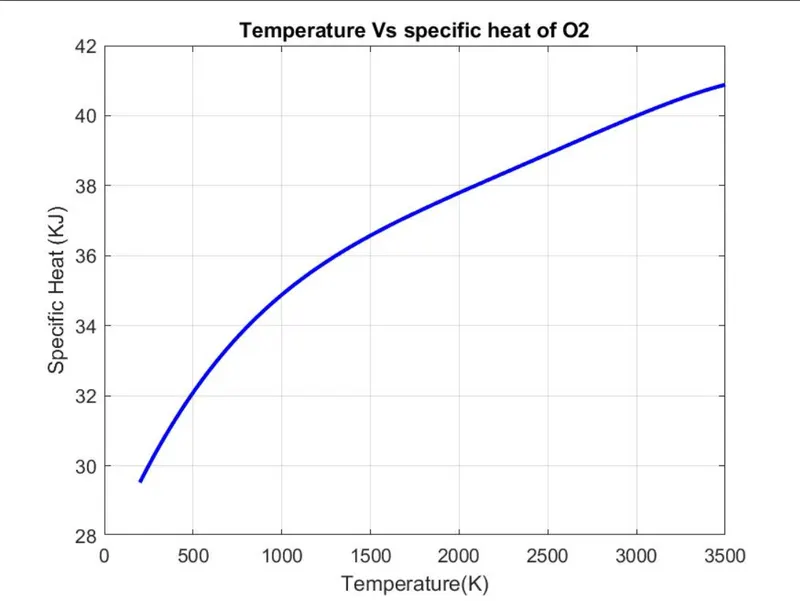
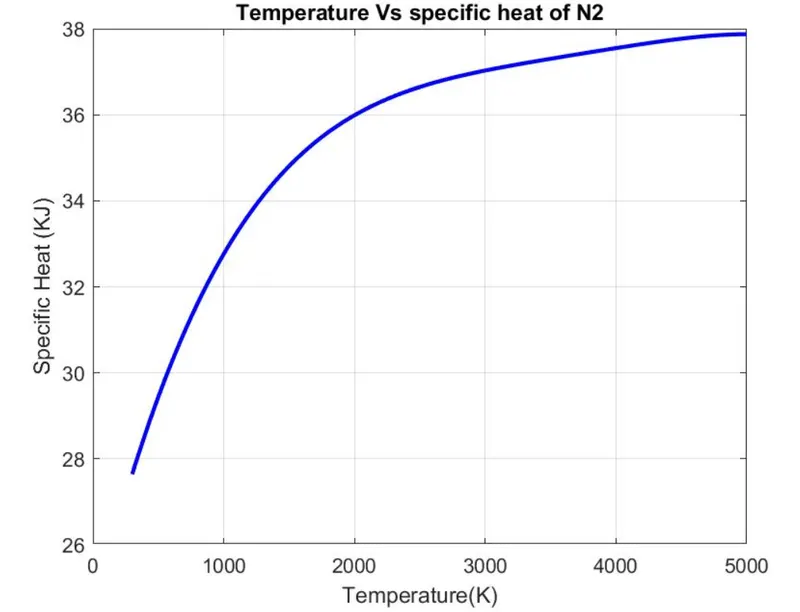
       plot(T,Cp,'linewidth',2,'color','b');
       xlabel('Temperature(K)');
       ylabel('Specific Heat (KJ)');
       title(sprintf('Temperature Vs specific heat of %s',species));
       grid on
       saveas(figure(1),'Specific heat.jpg');

       %plotting Temperature Vs Enthpaly(Saving)
       figure(2)
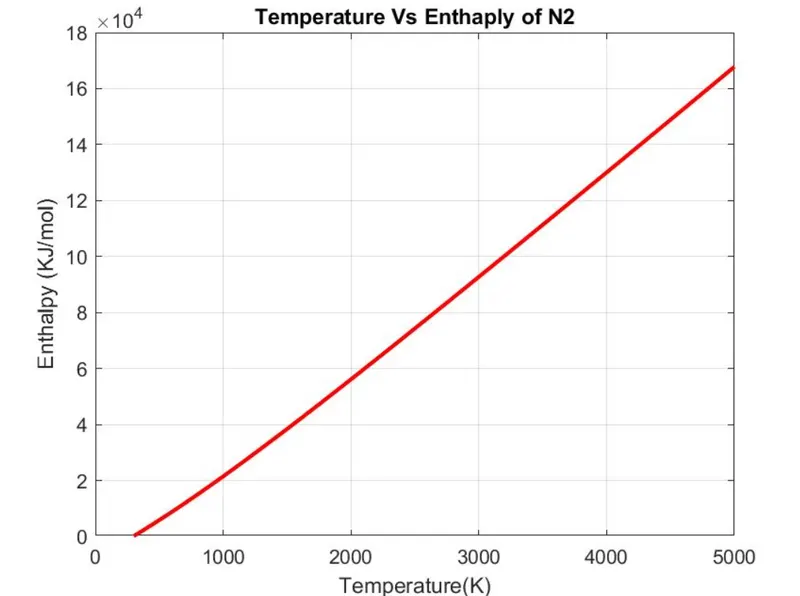
       plot(T,H,'linewidth',2,'color','r');
       xlabel('Temperature(K)');
       ylabel('Enthalpy (KJ/mol)');
       title(sprintf('Temperature Vs Enthaply of %s',species));
       grid on
       saveas(figure(2),'Enthaply.jpg');

       %plotting Temperature Vs Entropy(Saving)
       figure(3)
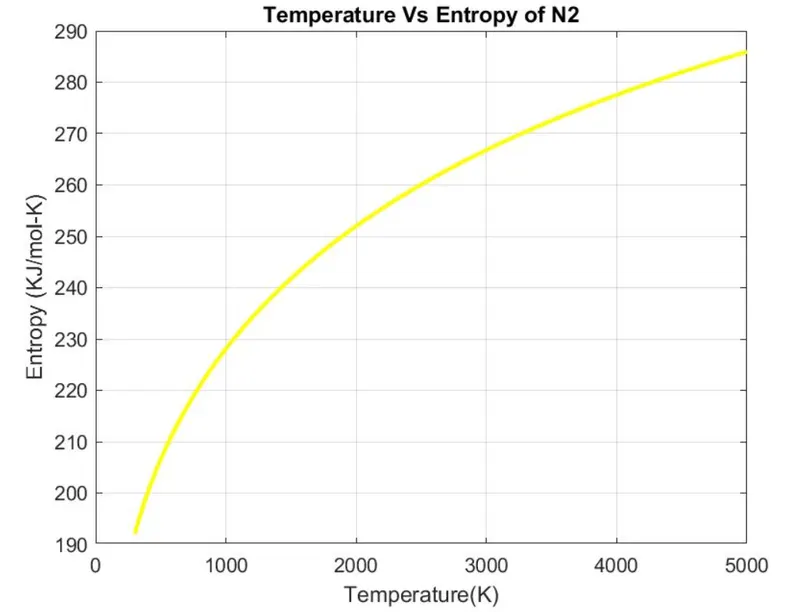
       plot(T,S,'linewidth',2,'color','y');
       xlabel('Temperature(K)');
       ylabel('Entropy (KJ/mol-K)');
       title(sprintf('Temperature Vs Entropy of %s',species));
       grid on
       saveas(figure(3),'Entropy.jpg');

end
CODE EXPLANATION:
- The first step in MATLAB programming is to make sure when a new file is opened all the variables and command windows must be cleared by using(clear all, close all, and clc)commands.
- Initially, we are opening the 'THERMO.dat' data file using fopen command which is used for reading data in a file, and using fgetl command is used to getting a line from the 'THERMO.dat' data file.
- Strsplit command is used to split the string at a delimiter which in this case is the space between the numbers which gives us the values of global temperature from the first line of the data file and store them in respective variables.
- Str2num command is used to convert the string of values of temperature into global temperature values.
- To skip the next 3 lines we use FOR loop by using fgetl command.
- In order to read all the 53 species mentioned in the data file and to calculate the thermodynamic properties of each species, we use the 'FOR' loop.
- In the FOR loop, the first line of each species is read by using fgetl command, and the string is converted into an array with the strsplit command.
- The name of the species is stored in the 'species' variable and the local temperature values are extracted using the str2num command.
- To read the values of coefficients from the proceeding three lines fgetl command is used along with findstr command to find a common term in the string and here 'E' is given as input to find common in the string.
- In this way, all the 14 temperature coefficients are extracted and stored in a variable 'an' where 'n=1,2,3,4,......13,14'.The local temperature range for calculations is defined for 1000 values using linspace command.
- 'IF ELSE' loop is used as there 14 coefficients in which the first 7 coefficients are high-temperature coefficients and the second 7 coefficients are low-temperature coefficients.
- So to calculate the specific heat, Enthalpy, Entropy of the species based on the formula, 'if else' loop is used if the values of temperature are above/Below the local medium temperature.
- The molecular weight is calculated by assigning the values to variables of 'Atoms' along with their respective 'Atomic weight' and initially, the value of ''M' is stored as 0. Then two for loops are used one for the data stored in 'species' and another for the atoms that we defined.
- 'IF' loop is used where at the first the species name and atoms are compared using strcmp command and if the comparison is true then the atomic weight of the particular atom is added to 'M' variable at every place where the atom is present in the species.
- Another 'IF' loop is used to multiply the value which is adjacent to the particular atom and which indicates the number of that particular atom such as O2 to atomic weight.
- Now to display the molecular weight in the command window fprintf command is used to display molecular weight.
- In the next step molecular weight is written to a text file by fprint(fopen and fclose command) which is used to open and close the text file. Then to save all the output to a separate folder first the folder is changed using the cd command which takes the folder address as input to change the folder.
- mkdir command makes a new folder for each species and cd will again change the folder to the particular species name to save the output. Then the graphs of specific heat, entropy, enthalpy against temperature are plot using plot command using proper labels and titles.
- Three graphs for each species are saved using saveas command as an image file with the '.jpg' extension.
ERRORS:
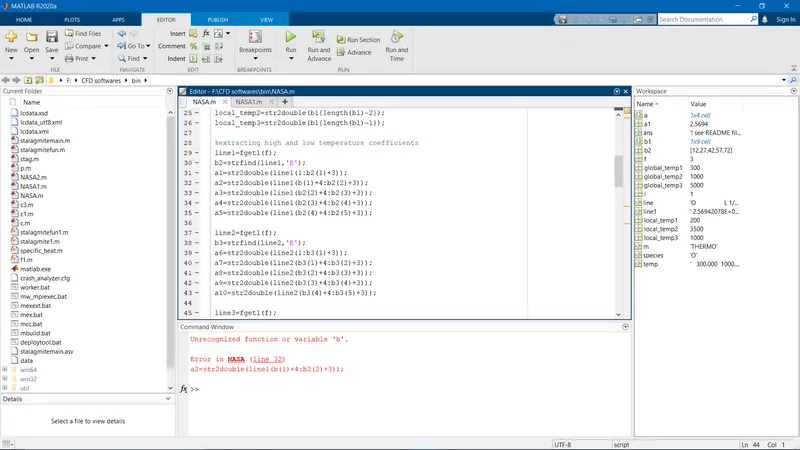
The above error has occurred due to a variable not used in the while calculation of temperature coefficients hence it is rectified.
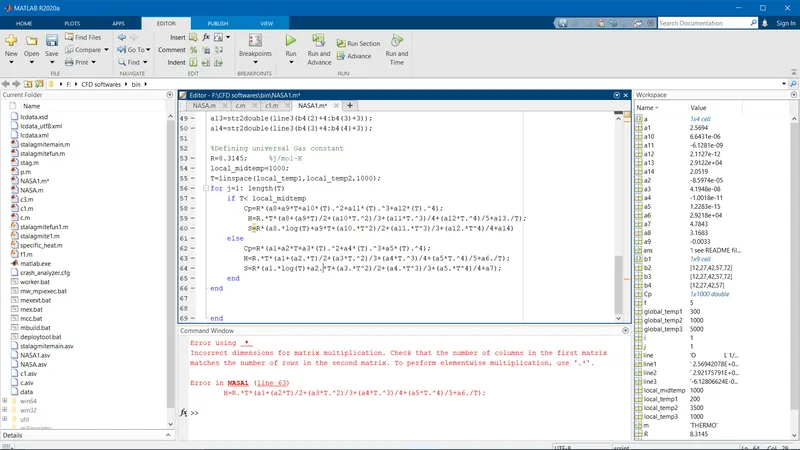
The above error has occurred due to not using the multiplication operator while calculation of H hence it is rectified.
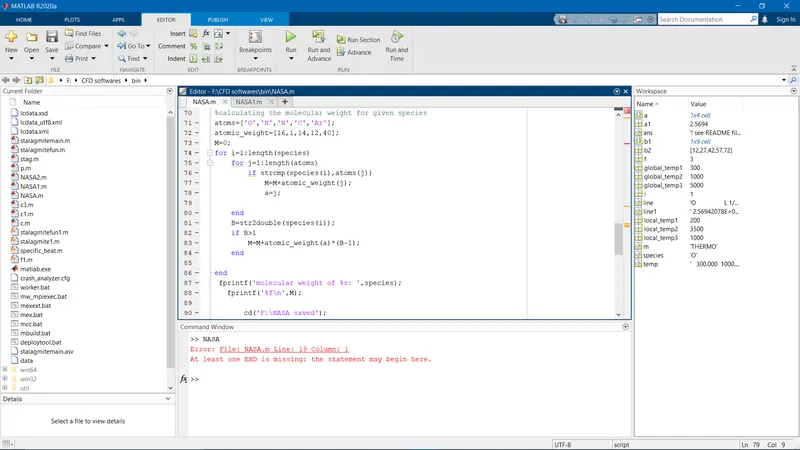
The above error has occurred due to not using the end statement for the if loop while calculating the molecular weight hence it is rectified.
RESULTS:
Molecular weight for the given species is displayed in the command window as shown in the figure.
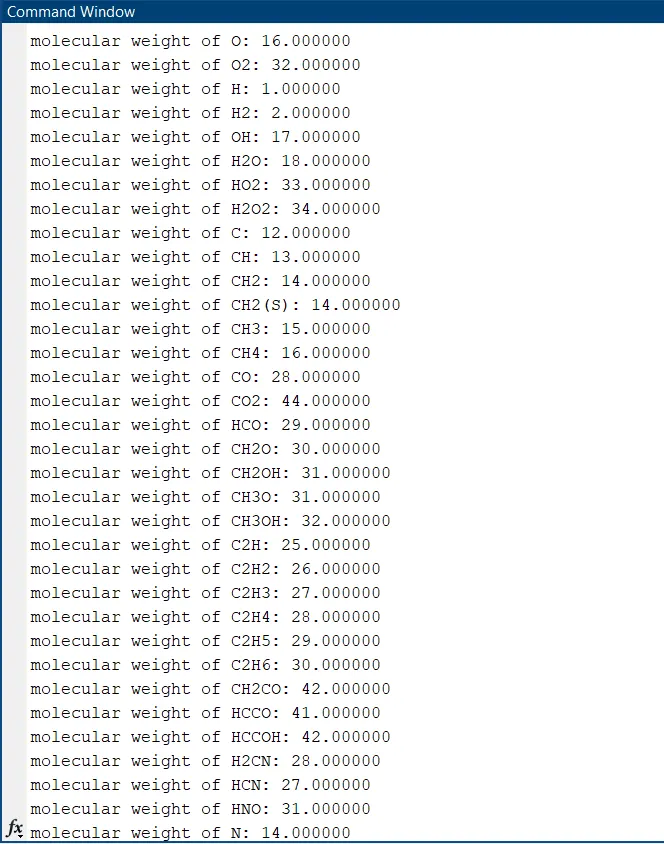
All the species data containing graphs and the molecular weight is stored in a single folder as shown below.
Graphs for O2
Graphs for N2
Graphs for CO2
CONCLUSION:
Hence we extract all 14 temperature coefficients and local temperature values of all the 53 species. The above-obtained data is used to calculate the Enthalpy, Entropy, and specific heat for entire species, and the respective molecular weight is calculated and displayed on the command window. Finally, we are plot the graphs of Enthalpy, Entropy, and specific heat vs temperature for all species and storing them in the respective species folder.