MATLAB- Parsing NASA thermodynamic data
OBJECTIVE :
- Finding all fourteen coefficients of each species.
- Calculating the Specific Heat, Enthalpy and Entropy for all the species of thermodynamic data.
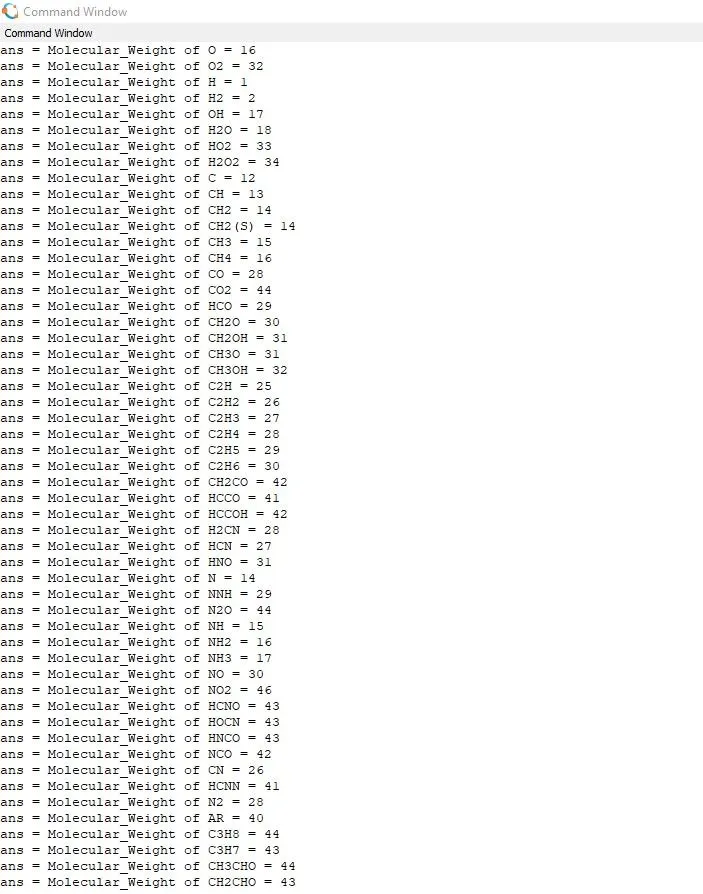
- Calculating Molecular masses of each species.
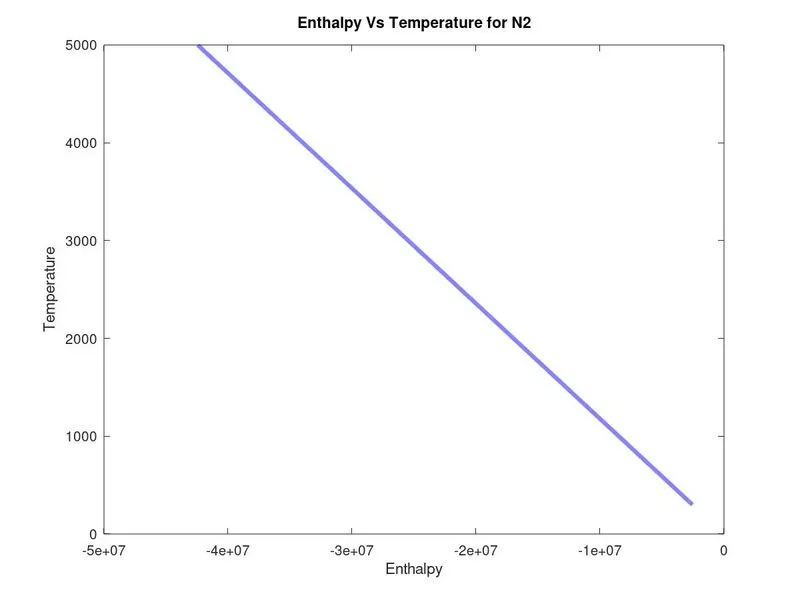
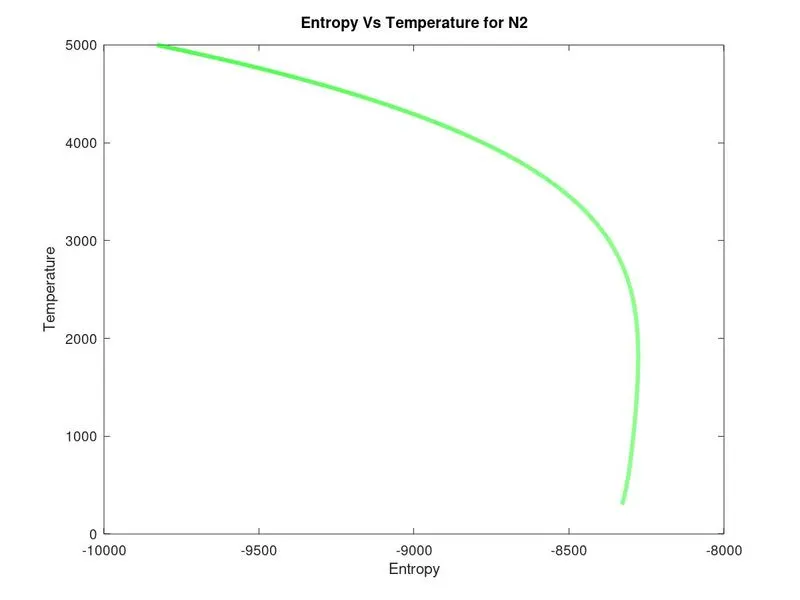
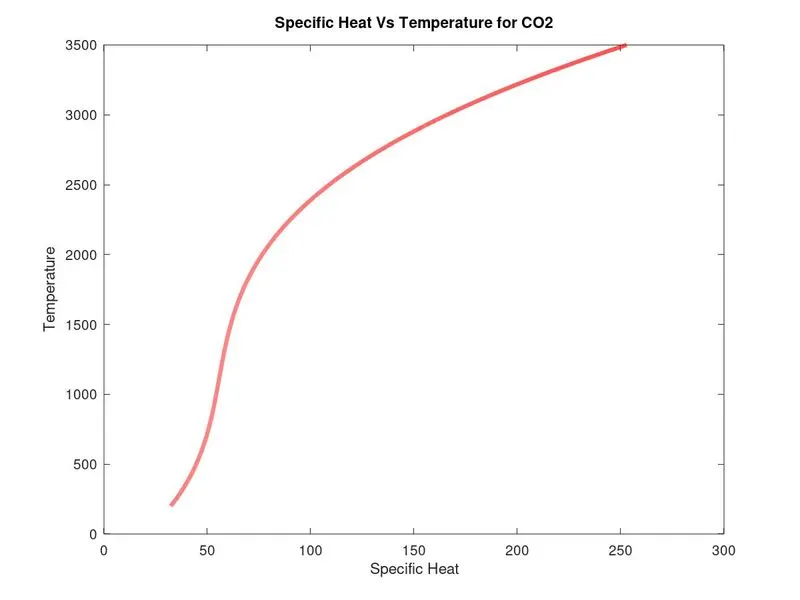
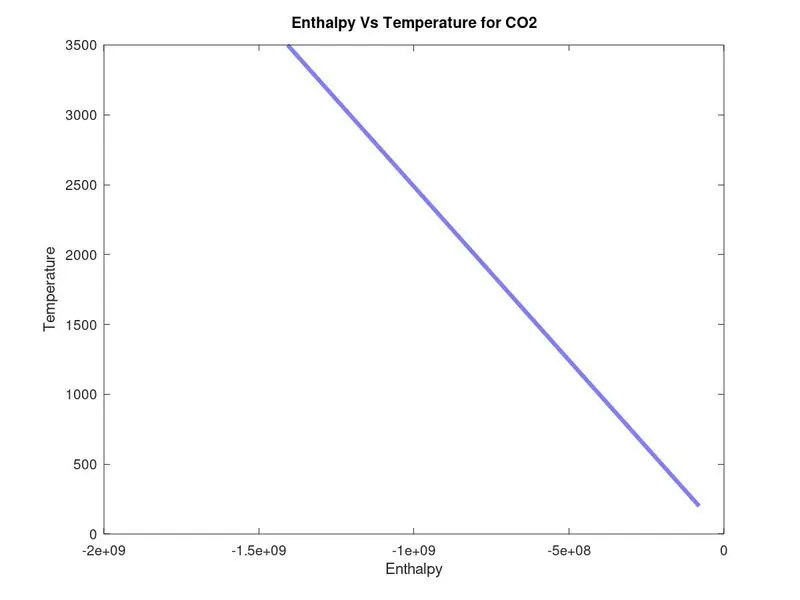
- Plotting Specific Heat, Enthalpy and Entropy versus temperature for each species.
THEORY:
File Parsing : Parsing a file is to split a file of source data into pieces of data that can be easily stored or manipulated.
Specific Heat : It is the amount of heat per unit mass required to raise the temperature by one degree celsius.
Enthalpy : It is a thermodynamic quantity equivalent to the total heat content of the system. It is equal to internal energy of the system and in addition to product of pressure and volume.
Entropy : It is a thermodynamic quantity representing the unavailability of a system thermal energy for conversion into mechanical work.
Molecular Weight : Molecular weight is the weight of a given molecule.
Specific Heat : `(Cp)/R = a1 + a2.T+ a3.T^2 +a5.T^4` Where: R = Univesral Gas Constant , T = Temperature
Enthalpy : `H/R = a1 + a2(T/2) +a3(T^2/3)+a4(T^3/4)+a5(T^4/5)+(a6)/T`
Entropy : `S/R = a1.lnT + a2.T+a3(T^2/2) +a4(T^3/3)a5(T^4/4)+a7`
MATLAB PROGRAM :
clear all
close all
clc

R=8.314;        % Universal Gas Constant

f1=fopen("THERMO.dat","r");
tline1=fgetl(f1);
tline2=fgetl(f1);
%s='END'
glob_temp=strsplit(tline2,' ');
global_low_temp = str2num(glob_temp{2});
global_mid_temp = str2num(glob_temp{3});
global_high_temp = str2num(glob_temp{4});

%Loop to run and ignore first four lines
for i=1:3;
    skip=fgetl(f1);
end

%Loop to obtain data and getting plots for each species
for i=1:53;

  %Name of species and converting to string value
  tline=fgetl(f1);
  A=strsplit(tline,' ');
  species=char(A(1));
  b=strfind(tline,'.') ;
  %if strcmp(s,tline(1):tline(3))
  % break;
  %end

  %Finding local Temperature values for each species
  low_temp=str2double(tline(b(1)-3:b(1)-1));
  high_temp=str2double(tline(b(2)-4:b(2)-1));
  mid_temp=str2double(tline(b(3)-4:b(3)-1));

  %Coefficients from three lines of each species
  tline3=fgetl(f1);
  c=strfind(tline3,'E');
  a1=str2double(tline3(1:c(1)+3));
  a2=str2double(tline3(c(1)+4:c(2)+3));
  a3=str2double(tline3(c(2)+4:c(3)+3));
  a4=str2double(tline3(c(3)+4:c(4)+3));
  a5=str2double(tline3(c(4)+4:c(5)+3));

  tline4=fgetl(f1);
  d=strfind(tline4,'E');
  a6=str2double(tline4(1:d(1)+3));
  a7=str2double(tline4(c(1)+4:c(2)+3));
  a8=str2double(tline4(c(2)+4:c(3)+3));
  a9=str2double(tline4(c(3)+4:c(4)+3));
  a10=str2double(tline4(c(4)+4:c(5)+3));

  tline5=fgetl(f1);
  d=strfind(tline4,'E');
  a11=str2double(tline5(1:d(1)+3));
  a12=str2double(tline5(c(1)+4:c(2)+3));
  a13=str2double(tline5(c(2)+4:c(3)+3));
  a14=str2double(tline5(c(3)+4:c(4)+3));

%Calculating Molecular weight of each species
Molecular_Weight= atom_wgt(species);
sprintf('Molecular_Weight of %s = %d',species,Molecular_Weight)

%Defining T
T=(low_temp:high_temp);

%Values of Specific Heat(cp), Enthalpy(S), Entropy(S)
if T>mid_temp;
cp= R*(a1 + a2*T + a3*(T.^2) + a4*(T.^3) + a5*(T.^4));

H=R*(a1 + a2*(T/2) + (a3*(T.^2))/(3) + (a4*(T.^3))/(4) + (a5*(T.^4))/(5) + a6*T);

S=R*(a1*log(T) + a2*T + (a3*(T.^2))/(2) + (a4*(T.^3))/(3) + (a5*(T.^4))/(4) + a7);

else

cp= R*(a8 + a9*T + a10*(T.^2) + a11*(T.^3) + a12*(T.^4));

H=R*(a8 + a9*(T/2) + (a10*(T.^2))/(3) + (a11*(T.^3))/(4) + (a12*(T.^4))/(5) + a13*T);

S=R*(a8*log(T) + a9*T + (a10*(T.^2))/(2) + (a11*(T.^3))/(3) + (a12*(T.^4))/(4) + a13);

end

%Creating folders for each species
t=sprintf("%s",species);
mkdir(t);

cd(t); %saving plots to respective folders

%Plottings curves for Specific Heat Vs Temperature
figure(1);
plot(cp,T,'linewidth',3,'color','r');
xlabel('Specific Heat');
ylabel('Temperature');
CP_text=sprintf('Specific Heat Vs Temperature for %s',species);
title(CP_text);
saveas(gcf,'CP.jpg');

%Plottings curves for Enthalpy Vs Temperature
figure(2);
plot(H,T,'linewidth',3,'color','b');
xlabel('Enthalpy');
ylabel('Temperature');
H_text=sprintf('Enthalpy Vs Temperature for %s',species);
title(H_text);
saveas(gcf,'H.jpg');

%Plottings curves for Entropy Vs Temperature
figure(3);
plot(S,T,'linewidth',3,'color','g');
xlabel('Entropy');
ylabel('Temperature');
S_text=sprintf('Entropy Vs Temperature for %s',species);
title(S_text);
saveas(gcf,'S.jpg');

cd ..;  %Back to previous Directory

end
FUNCTION PROGRAM :
%Finding molecular mass of each species

function[M]=atom_wgt(species)
elements=['H','C','N','O','R'];     %Defining Elements
Atomic_Weight=[1,12,14,16,40];      %Atomic Weight of each elements
M=0;                                %Initial mass zero

%Loop for each element inside each species
  for i=1:length(species);
    for j=1:length(elements);
      if strcmp(species(i),elements(j));
        M= M+ Atomic_Weight(j);
        p=j;
      end
    end

%Multiplying each element if greater than 1
    n=str2double(species(i));
    if n>1;
      M=M+(Atomic_Weight(p))*(n-1);
    end
  end
end
RESULTS :
- Plotting For O2
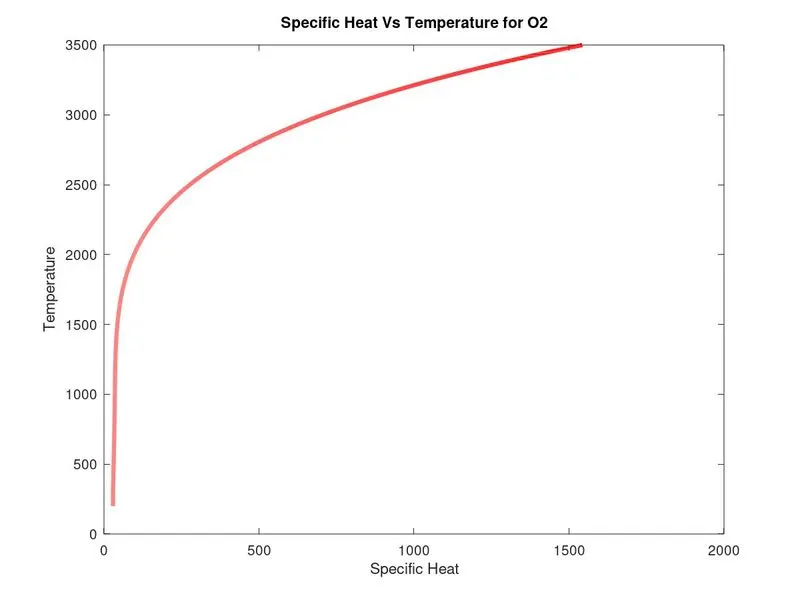
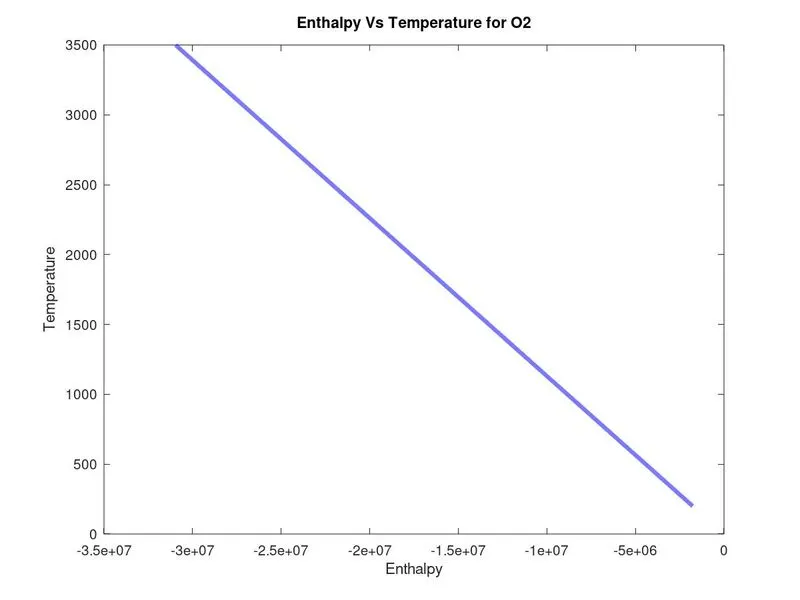
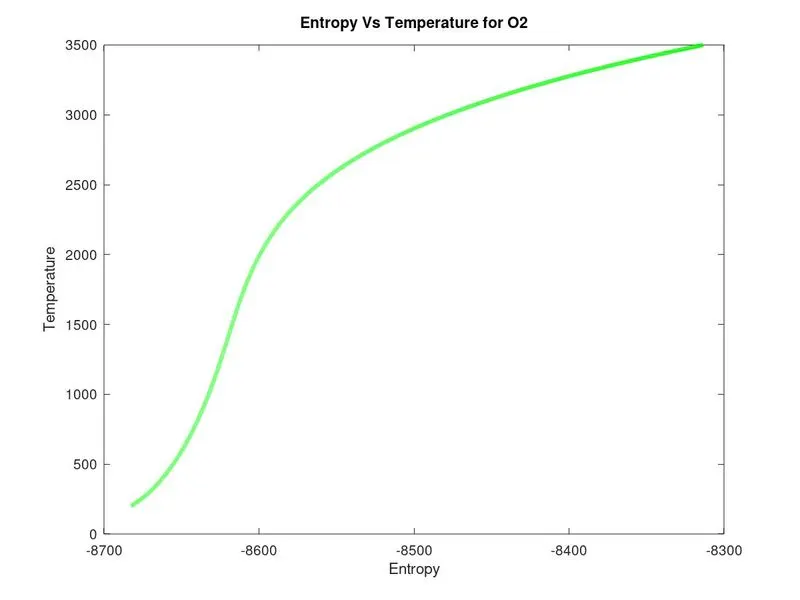
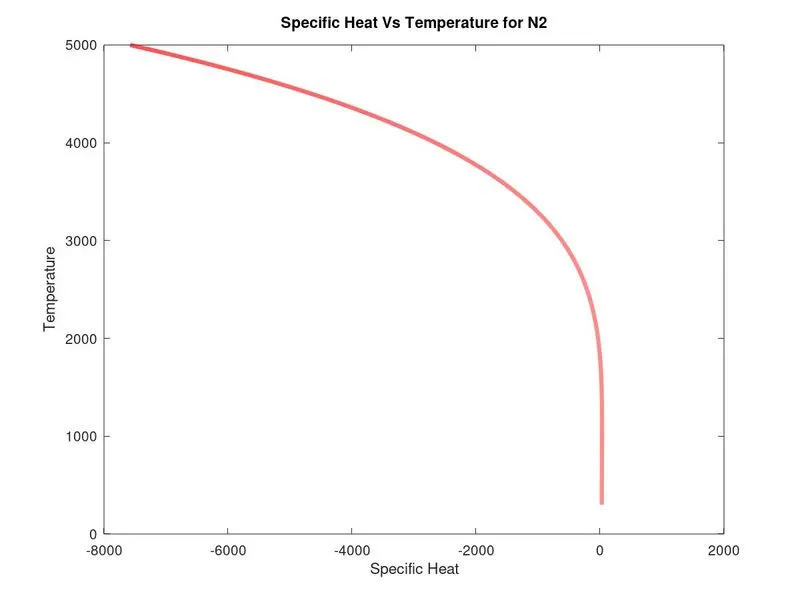
- Plotting For N2
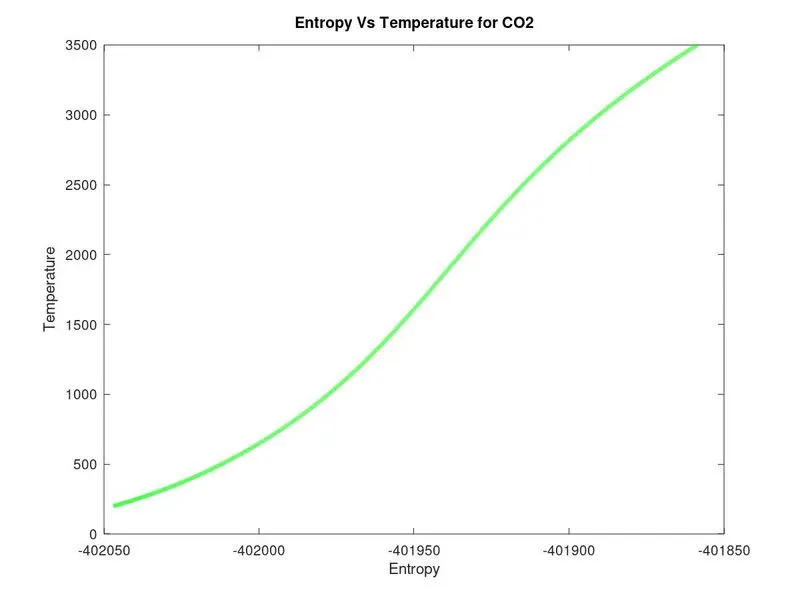
- Plotting For CO2
- Molecular Weight of all the species
- File Creation of all the species

CONCLUSION :
- N2 and O2 follow the same curve but only difference is that O2 gives out energy and N2 takes energy which are positive and negative enthalpy respectively.Their relation to temperature is parabolic for Specific heat and Entropy and linear plot for Enthalpy.
- File Parsing helps to fetch and read the sourse data,plotting graphs of Specific Heat, Entalphy and Entropy with respect to Temperature, obtaining coefficients and molecular masses of each species.