Project 1 - Parsing NASA thermodynamic data
AIM:
- To write a function that extracts the 14 coefficients and calculates the Enthalpy, Entropy, and Specific heat for all the species in the data file. (the first 7 coefficients are high-temperature coefficients and the second 7 coefficients are the low-temperature coefficients).
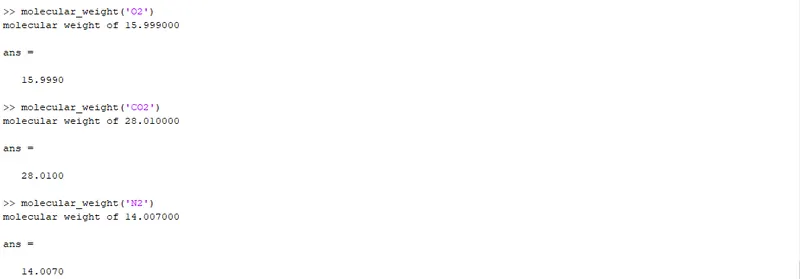
- Calculate the molecular weight of each species and Display it in the command window.
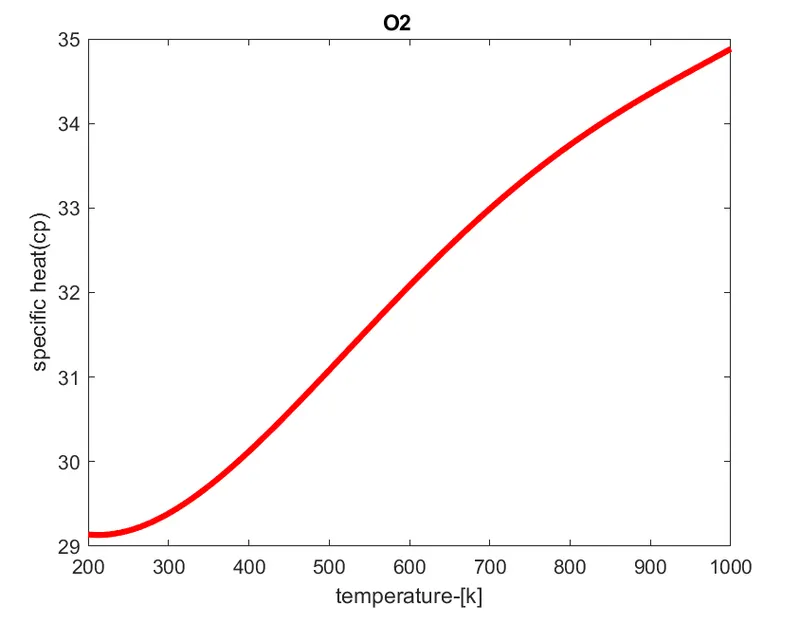
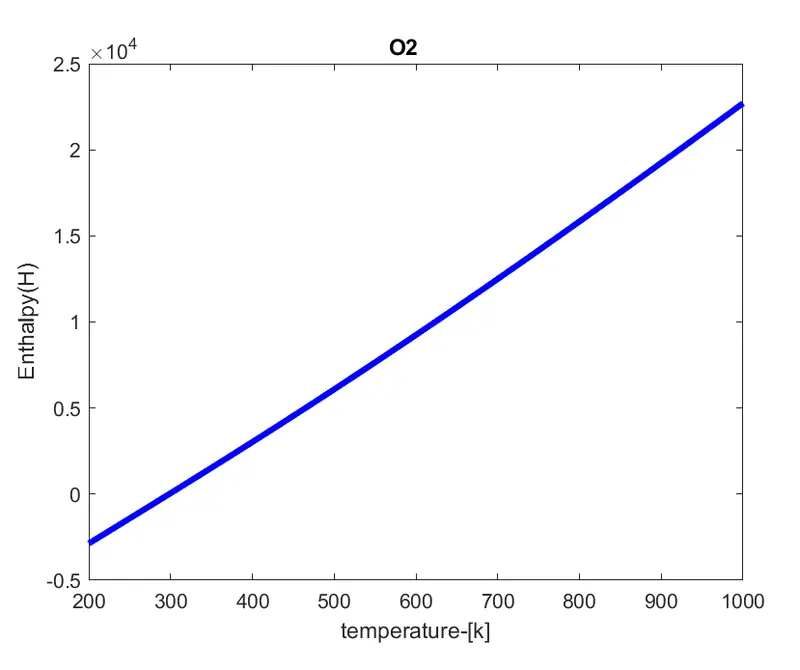
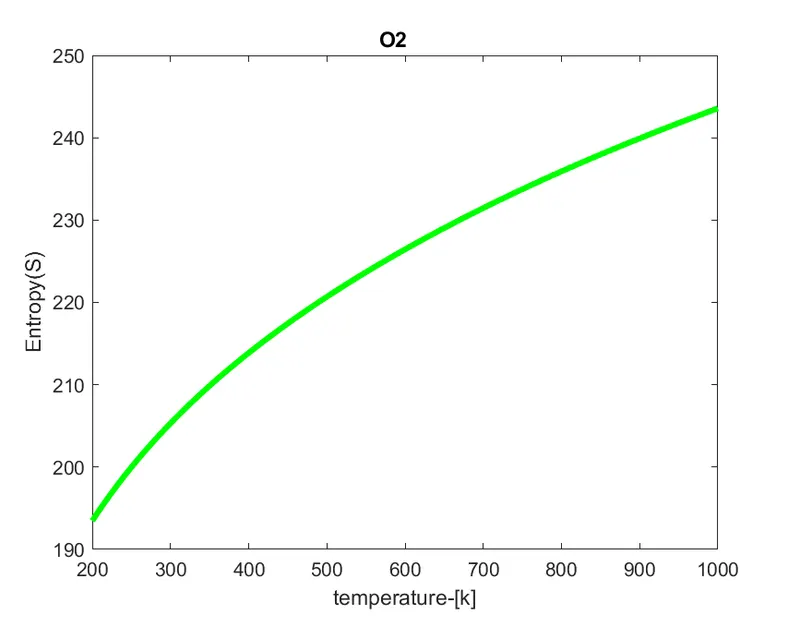
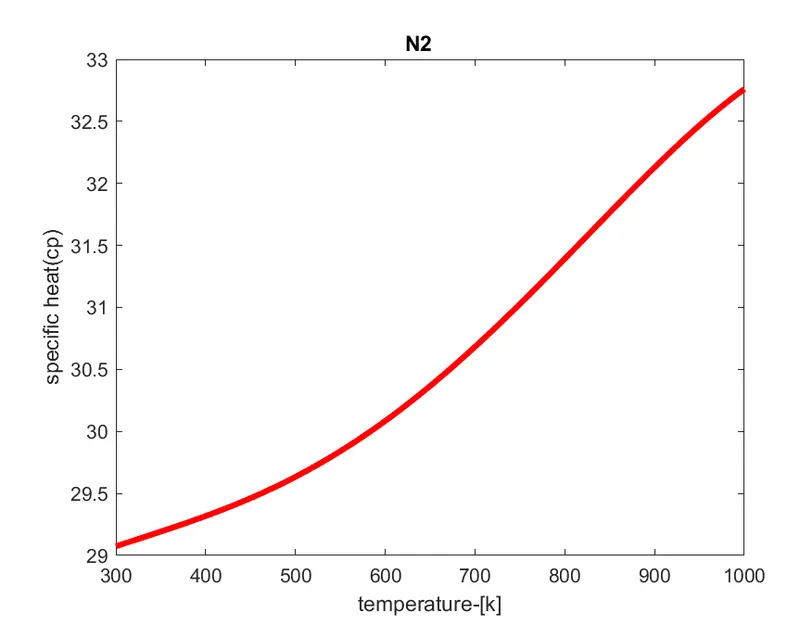
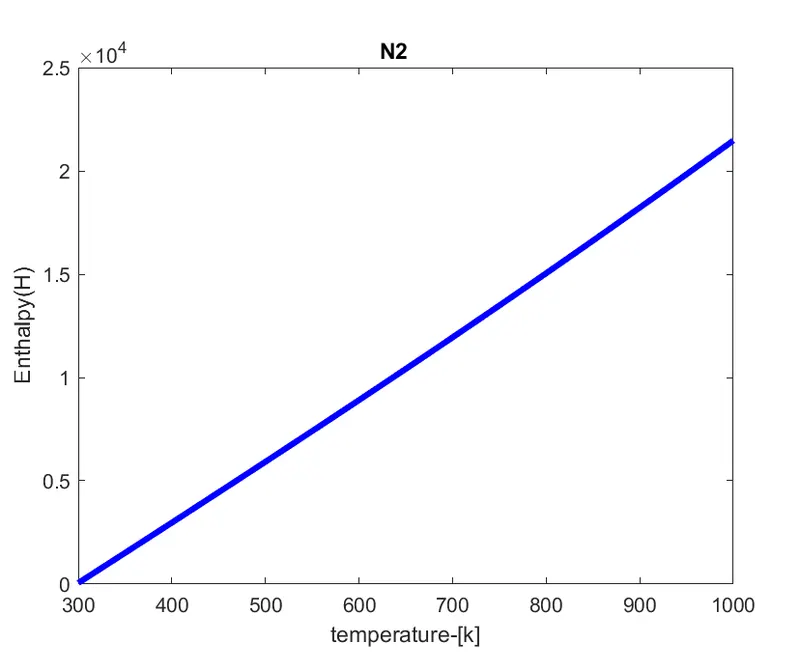
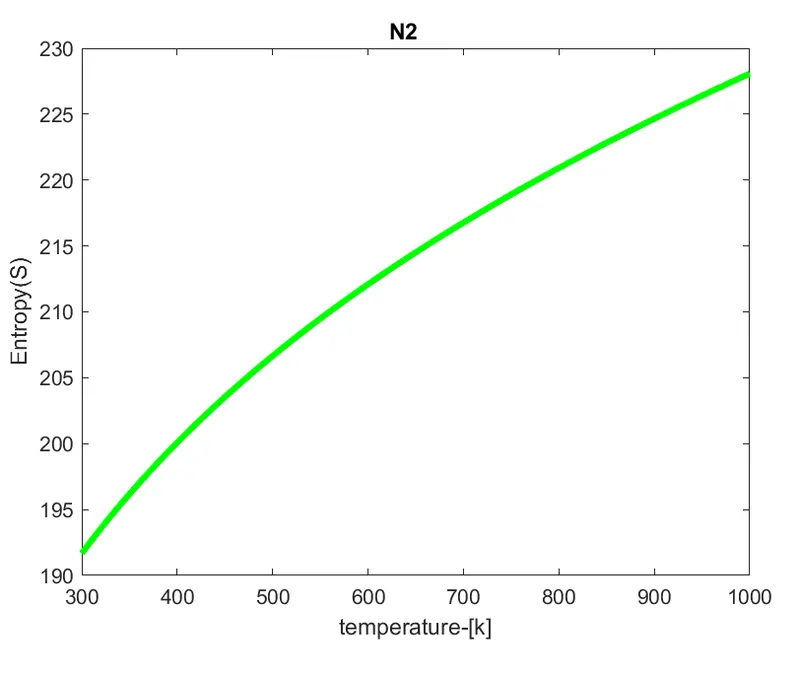
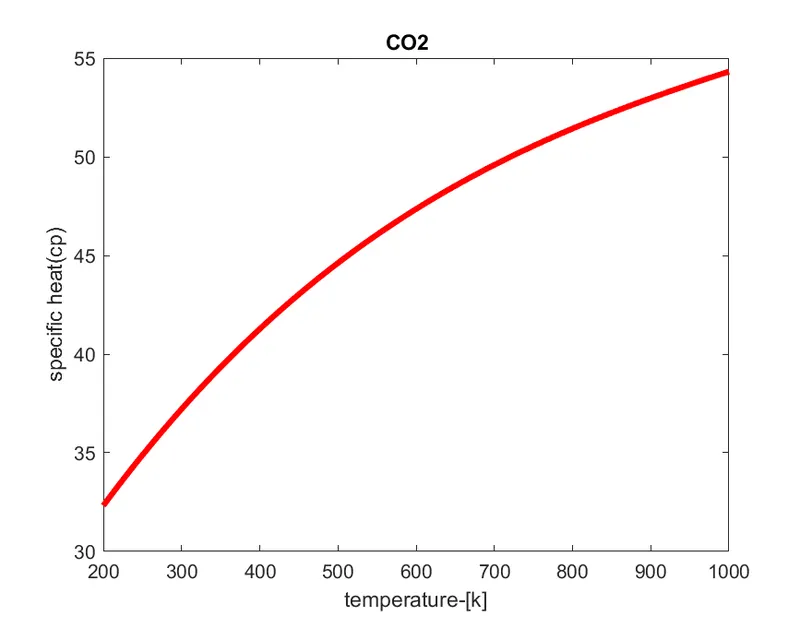
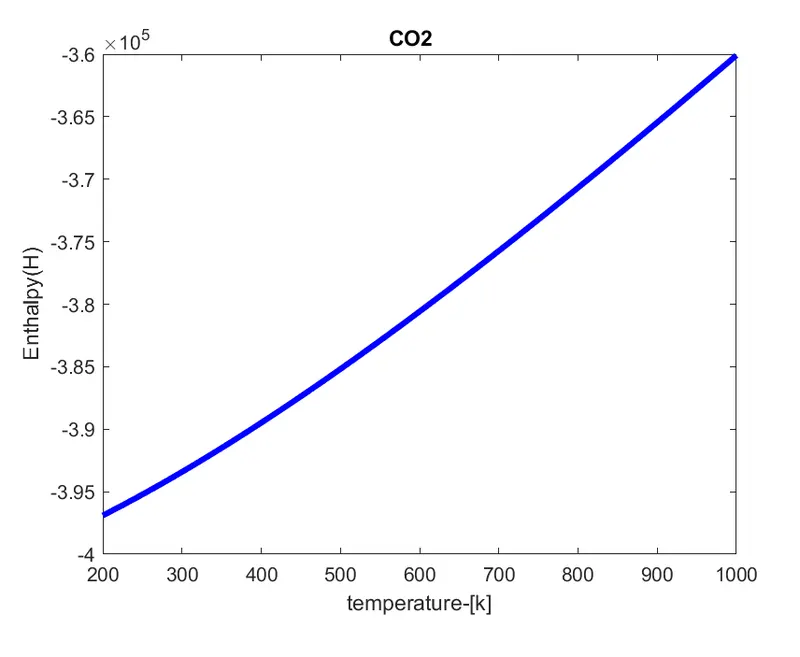
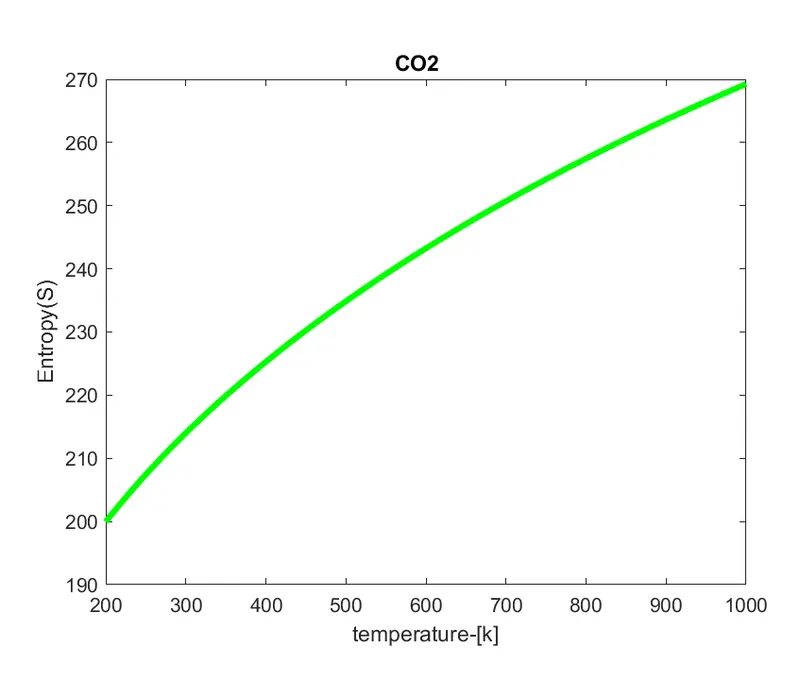
- Plot the Cp, Enthalpy, and Entropy for the local temperature range (low temperature: high temperature) specific for each species.
- Save the plots as images with appropriate names and dump them in separate folders for each species with a suitable name. All these should be generated automatically.
- The main program that you will submit will just take the "THERMO.dat" file as an input and generate Cp, H, and Splots.
- Please write a detailed report to describe your logic.
________________________________________________________________________________________________________________________________________________________________________________________________
Formula:
R=universal gas constant ; T= Temperature.

________________________________________________________________________________________________________________________________________________________________________________________________
Main Code:
clear all
close all
clc
f1=fopen('Thermo.dat','r');
fgetl(f1);
Line2=fgetl(f1);

%string in Line 2
line2='300.000  1000.000  5000.000';
A=strsplit(line2,' ');

%changing string to a number format
Global_low_temp=str2double(A{1});
Global_mid_temp=str2double(A{2});
Global_high_temp=str2double(A{3});

%skipping line 3:5
Line3=fgetl(f1);
Line4=fgetl(f1);
Line5=fgetl(f1);

for i=1:53
    Species=fgetl(f1);
    Species_name=Species(1:6);
   %finding the local temperatures
   t=strsplit(Species,' ');
   G=strfind(Species,'G');
%converting cells into numbers
Low_Temp=str2double(Species(G+4:G+10));
Mid_Temp=str2double(Species(G+13:G+19));
High_Temp=str2double(Species(G+23:G+29));

%reading the lines from file=f1
Line7=fgetl(f1);
Line8=fgetl(f1);
Line9=fgetl(f1);
%Finding the position of'E'in all three lines
a=strfind(Line7,'E');
b=strfind(Line8,'E');
c=strfind(Line9,'E');
%lower temp coefficients
a1=str2double(Line7(1:a(1)+3));
a2=str2double(Line7(a(1)+4:a(2)+3));
a3=str2double(Line7(a(2)+4:a(3)+3));
a4=str2double(Line7(a(3)+4:a(4)+3));
a5=str2double(Line7(a(4)+4:a(5)+3));
a6=str2double(Line8(1:b(1)+3));
a7=str2double(Line8(b(1)+4:b(2)+3));

%lower temp coefficients
a8=str2double(Line8(b(2)+4:b(3)+3));
a9=str2double(Line8(b(3)+4:b(4)+3));
a10=str2double(Line8(b(4)+4:b(5)+3));
a11=str2double(Line9(1:c(1)+3));
a12=str2double(Line9(c(1)+4:c(2)+3));
a13=str2double(Line9(c(2)+4:c(3)+3));
a14=str2double(Line9(c(3)+4:c(4)+3));

%creating check values for local_temp
T=linspace(Low_Temp,High_Temp,100);
R=8.314; %universal gas constant
%calculating cp, H, S for low and high temperatures
for j=1:100
    if T(j)>=Mid_Temp
        cp(j)=(a1+a2.*T(j)+a3.*T(j).^2+a4.*T(j).^3+a5.*T(j).^4).*R;

        H(j)=R.*T(j).*(a1+(a2.*T(j))./2+(a3.*T(j).^2)/3+(a4.*T(j).^3)/4+(a5.*T(j).^4)/5+a6./T(j));

        S(j)=R.*((a1*log(T(j)))+(a2.*T(j))+(a3.*T(j).^2)/2+(a4.*T(j).^3)/3+(a5.*T(j).^4)/4+a7);
    else
        cp(j)=(a8+a9.*T(j)+a10.*T(j).^2+a11.*T(j).^3+a12.*T(j).^4).*R;

        H(j)=R.*T(j).*(a8+(a9.*T(j))./2+(a10.*T(j).^2)/3+(a11.*T(j).^3)/4+(a12.*T(j).^4)/5+a13./T(j));

        S(j)=R.*((a8*log(T(j)))+(a9.*T(j))+(a10.*T(j).^2)/2+(a11.*T(j).^3)/3+(a12.*T(j).^4)/4+a14);
    end
end
%calculating molecular weight of the species
MW(i)=molecular_weight(Species_name);

%creating a directory for the species
mkdir(['C:\Users\Student\Desktop\kapil diwakar skill_lync\species_data\',Species_name]);

%current directory
cd('species_data')
cd(Species_name)

figure(1)
plot(T,cp,'linewidth',3,'color','r')
xlabel('temperature-[k]')
ylabel('specific heat(cp)')
title(Species_name)
fig1=sprintf('Specific_heat of %s.png',Species_name);
saveas(figure(1),fig1);

figure(2)
plot(T,H,'linewidth',3,'color','b')
xlabel('temperature-[k]')
ylabel('Enthalpy(H)')
title(Species_name)
fig2=sprintf('Enthalpy of %s.png',Species_name);
saveas(figure(2),fig2)

figure(3)
plot(T,S,'linewidth',3,'color','g')
xlabel('temperature-[k]')
ylabel('Entropy(S)')
title(Species_name)
fig3=sprintf('Entropy of %s.png',Species_name);
saveas(figure(3),fig3)
cd ..
cd ..
end
________________________________________________________________________________________________________________________________________________________________________________________________
Molecular_weight(MW) function code:
function MW=molecular_weight(Species_name)
Element=['H','C','O','N','A'];
atomic_mass=[1.008 12.011 15.999 14.007 39.948];%defining atomic masses of main species
MW=0;%molecular_weight starting range
for i=1:length(Species_name)
    for j=1:length(Element)
        if strcmpi(Species_name(i),Element(j))
            MW=MW+atomic_mass(j);
            %storing the position of matched elements
            position=j;
        end
    end
    n=str2double(Species_name);
    if n>1
        MW=MW+atomic_mass(position)*(n-1);
    end
end
fprintf('molecular weight of %S :-',Species_name);
fprintf('%f',MW);
disp(' ');
end
________________________________________________________________________________________________________________________________________________________________________________________________
Explanation:
First assigning a file id for the file f1. Then using 'fopen' command to open the thermo.dat file and entering the mode 'r' meaning to read the file.

Use "Fgetl" command to read lines or to skip lines.

Using 'fgetl' im reading line 2 and assigning Line2 variable a string from the particular line. line2='300.000  1000.000  5000.000'.

Then using string split "strsplit' command we can get the coefficients for the Global low, mid, and high temperatures.

Using 'fgetl' command to skip through the next three comment lines.
_________________________________________________________________________________
f1=fopen('Thermo.dat','r');
fgetl(f1);
Line2=fgetl(f1);

%string in Line 2
line2='300.000  1000.000  5000.000';
A=strsplit(line2,' ');

%changing string to a number format
Global_low_temp=str2double(A{1});
Global_mid_temp=str2double(A{2});
Global_high_temp=str2double(A{3});

%skipping line 3:5
Line3=fgetl(f1);
Line4=fgetl(f1);
Line5=fgetl(f1);
Next using a for loop we can calculate the local low, mid and high temperatures for the entire set of species present in the data. (total number of species= 53)

Assigning a variable for the particular line, splitting the string, Finding the position of a particular character present in the string 'G', and using this we can find the starting and ending position of the required value, this will create a cell array.

Next convert the string(cell-array) to numbers using the 'str2num' or 'str2double' in order to find the values for the Local low, Local mid, and Local high temperatures.

Next im reading the next three lines together from f1 to find the string from each line , then we find the position of "E' from the strings and convert the strings to number using the 'str2double' command in order to get the value of the higher temperatures coefficients(a1,a2,a3,a4,a5,a6,a7) and lower temperatures coefficients(a8,a9,a10,a11,a12,a13,a14)
_______________________________________________________________________________________
for i=1:53
    Species=fgetl(f1);
    Species_name=Species(1:6);
   %finding the local temperatures
   t=strsplit(Species,' ');
   G=strfind(Species,'G');
%converting cells into numbers
Low_Temp=str2double(Species(G+4:G+10));
Mid_Temp=str2double(Species(G+13:G+19));
High_Temp=str2double(Species(G+23:G+29));

%reading the lines from file=f1
Line7=fgetl(f1);
Line8=fgetl(f1);
Line9=fgetl(f1);
%Finding the position of'E'in all three lines
a=strfind(Line7,'E');
b=strfind(Line8,'E');
c=strfind(Line9,'E');
%lower temp coefficients
a1=str2double(Line7(1:a(1)+3));
a2=str2double(Line7(a(1)+4:a(2)+3));
a3=str2double(Line7(a(2)+4:a(3)+3));
a4=str2double(Line7(a(3)+4:a(4)+3));
a5=str2double(Line7(a(4)+4:a(5)+3));
a6=str2double(Line8(1:b(1)+3));
a7=str2double(Line8(b(1)+4:b(2)+3));

%lower temp coefficients
a8=str2double(Line8(b(2)+4:b(3)+3));
a9=str2double(Line8(b(3)+4:b(4)+3));
a10=str2double(Line8(b(4)+4:b(5)+3));
a11=str2double(Line9(1:c(1)+3));
a12=str2double(Line9(c(1)+4:c(2)+3));
a13=str2double(Line9(c(2)+4:c(3)+3));
a14=str2double(Line9(c(3)+4:c(4)+3));
Create an Array for the local low to high temperature with 100 values of output.
Give input R=8.314 universal gas constant
Then using a for loop calculate the specific heat, Enthalpy, and Entropy for both the higher temperature coefficients and lower temperature coefficients using the given formula and end the loop
_____________________________________________________________________________________
T=linspace(Low_Temp,High_Temp,100);
R=8.314; %universal gas constant
%calculating cp, H, S for low and high temperatures
for j=1:100
if T(j)>=Mid_Temp
cp(j)=(a1+a2.*T(j)+a3.*T(j).^2+a4.*T(j).^3+a5.*T(j).^4).*R;
H(j)=R.*T(j).*(a1+(a2.*T(j))./2+(a3.*T(j).^2)/3+(a4.*T(j).^3)/4+(a5.*T(j).^4)/5+a6./T(j));
S(j)=R.*((a1*log(T(j)))+(a2.*T(j))+(a3.*T(j).^2)/2+(a4.*T(j).^3)/3+(a5.*T(j).^4)/4+a7);
else
cp(j)=(a8+a9.*T(j)+a10.*T(j).^2+a11.*T(j).^3+a12.*T(j).^4).*R;
H(j)=R.*T(j).*(a8+(a9.*T(j))./2+(a10.*T(j).^2)/3+(a11.*T(j).^3)/4+(a12.*T(j).^4)/5+a13./T(j));
S(j)=R.*((a8*log(T(j)))+(a9.*T(j))+(a10.*T(j).^2)/2+(a11.*T(j).^3)/3+(a12.*T(j).^4)/4+a14);
end
endCalling the molecular weight function to calculate the molecular weight for each species.
create a directory to save all the plots.
choose the current directory to save plots.
plot the figure for specific heat vs temperature.
plot the figure for Enthalpy vs temperature.
plot the figure for Entropy vs temperature.
_____________________________________________________________________
%calculating molecular weight of the species
MW(i)=molecular_weight(Species_name);
%creating a directory for the species
mkdir(['C:\Users\Student\Desktop\kapil diwakar skill_lync\species_data\',Species_name]);
%current directory
cd('species_data')
cd(Species_name)
figure(1)
plot(T,cp,'linewidth',3,'color','r')
xlabel('temperature-[k]')
ylabel('specific heat(cp)')
title(Species_name)
fig1=sprintf('Specific_heat of %s.png',Species_name);
saveas(figure(1),fig1);
figure(2)
plot(T,H,'linewidth',3,'color','b')
xlabel('temperature-[k]')
ylabel('Enthalpy(H)')
title(Species_name)
fig2=sprintf('Enthalpy of %s.png',Species_name);
saveas(figure(2),fig2)
figure(3)
plot(T,S,'linewidth',3,'color','g')
xlabel('temperature-[k]')
ylabel('Entropy(S)')
title(Species_name)
fig3=sprintf('Entropy of %s.png',Species_name);
saveas(figure(3),fig3)
cd ..
cd ..
end
d
________________________________________________________________________________________________________________________________________________________________________________________________
Plots for O2, N2, CO2: