Project 1 - Parsing NASA thermodynamic data
Aim:-To write a program in matlab to parse the nasa thermodynamic data file and calculate the thermodynamic properties of various gas species.
Objectives:-
1. To write a code to exract the 14 coefficients and calculate the entropy,enthalpy and specific heat for all species in the data file.
2.calculate the molecular weight of all species
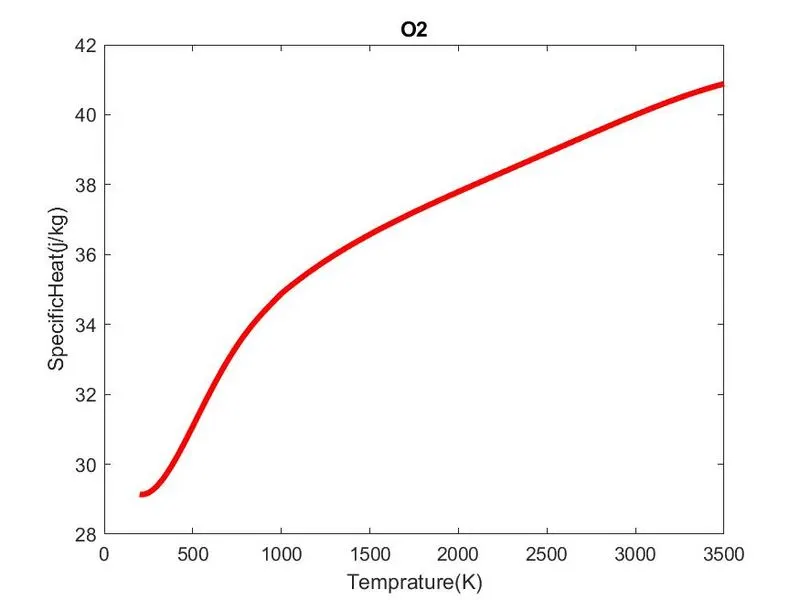
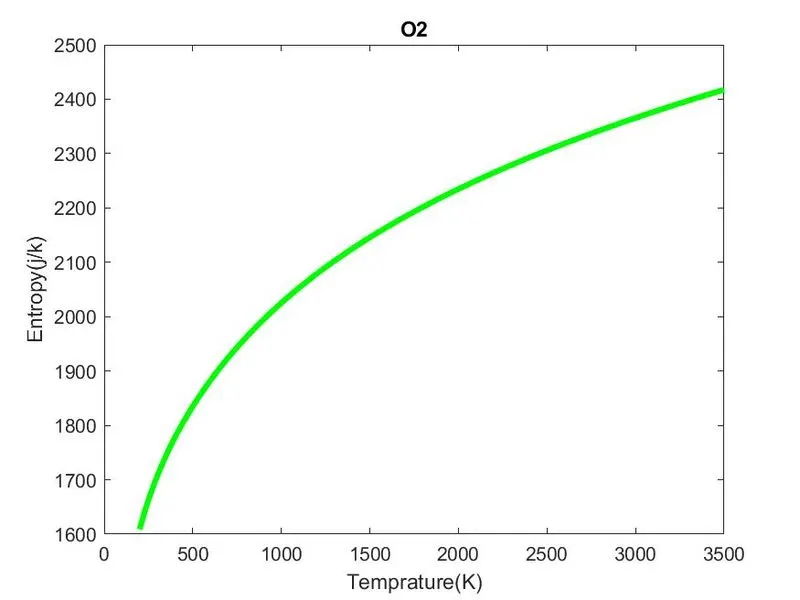
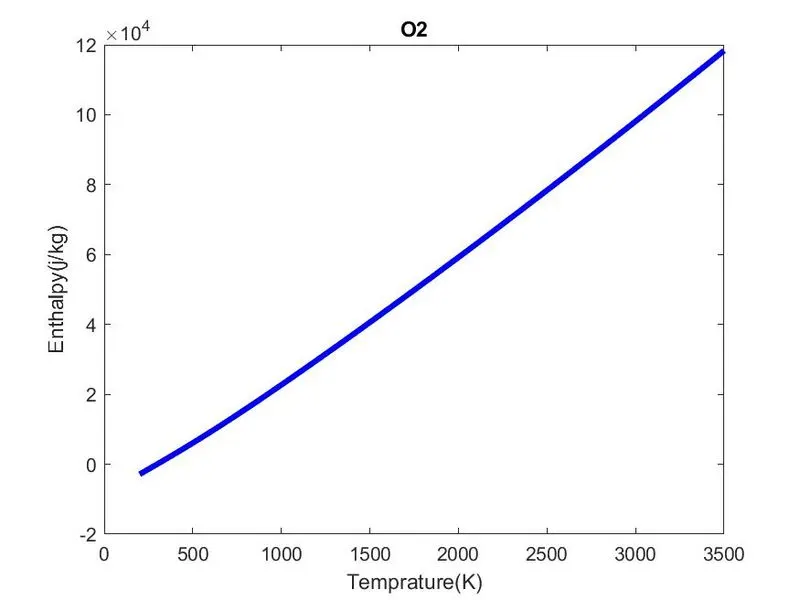
3.plot the graphs for entropy vs temperature,enthalpy vs temperature and specific heat vs temperature for each species
4.Save the plots as images in seperate folders for each species with proper naming
Theory:-
Parsing:-In computer language it refers to syntactic analysis of the input code into its components parts in order to facilitate the writing of compilers and interpreters. It can be used to describe split or separation.
Parsing a file means reading in a data stream of some sort and building an in memory model of the semantic content of that data. This aims at facilitating perfoming some kind of transformation on the data.
Enthalpy(H):-
A quantity associated with a thermodynamic system, expressed as the internal energy of a system plus the product of the pressure and volume of the system, having the property that during an isobaric process, the change in the quantity is equal to the heat transferred during the process.
Entropy(S):-
It is a measurable physical property that is most commonly associated with a state of disorder, randomness, or uncertainty. The term and the concept are used in diverse fields, from classical thermodynamics, where it was first recognized, to the microscopic description of nature in statistical physics, and to the principles of information theory.
Specific heat(Cp):-
The ratio of the amount of heat required to raise the temperature of a unit mass of a substance by one unit of temperature tothe amount of heat required to raise the temperature of a similar mass of a reference material, usually water, by the same amount.The amount of heat, measured in calories, required to raise the temperature of one gram of a substance by one Celsius degree.
Inputs and Formulas:-
Universal gas constant:-
R=8.3145
Formulas used for enthalpy,entropy and specific heat

Procedure:-
1.Open the given thermodynamic data file and read the data in the file and store the data as a variable
-First, in the program, the value of the universal gas constant R is given as 8.314 as an input.
-The given data is then formatted as a dat file.
code:-
2.code written for enthalpy,entorpy and specific heat as a function
%function code for enthalpy
function H=enthalpy(l1,l2,l3,l4,l5,l6,l7,l8,l9,l10,l11,l12,l13,l14,R,lt,mt,ht,T)
for i=1:length(T)
if T(i)>=mt
    H(i)=(l1.*(T(i)/2)+l2.*(T(i).^2)./3+l3.*(T(i).^3)./4+l4.*(T(i).^4)./5+l5.*(T(i).^5)./6+l6)*R*T(i);
else
    H(i)=(l8.*(T(i)/2)+l9.*(T(i).^2)./3+l10.*(T(i).^3)./4+l11.*(T(i).^4)./5+l12.*(T(i).^5)./6+l13)*R*T(i);
end
end
end
%function code for entropy
function S=entropy(l1,l2,l3,l4,l5,l6,l7,l8,l9,l10,l11,l12,l13,l14,R,lt,mt,ht,T)
for i=1:length(T)
if T(i)>=mt
    S(i)=(l1.*log(T(i))+l2.*T(i)+l3.*(T(i).^2)./2+l4.*(T(i).^3)./3+l5.*(T(i).^4)./4+l7)*R;
else
   S(i)=(l8.*log(T(i))+l9.*T(i)+l10.*(T(i).^2)./2+l11.*(T(i).^3)./3+l12.*(T(i).^4)./4+l14)*R;
end
end
%function code for specific heat
function Cp=specific_heat(l1,l2,l3,l4,l5,l6,l7,l8,l9,l10,l11,l12,l13,l14,R,lt,mt,ht,T)
for i=1:length(T)
if T(i)>=mt
    Cp(i)=(l1+l2*(T(i))+l3*(T(i).^2)+l4*(T(i).^3)+l5*(T(i).^4))*R;
else
    Cp(i)=(l8+l9*(T(i))+l10*(T(i).^2)+l11*(T(i).^3)+l12*(T(i).^4))*R;
end

end
end
%function code for calculating the molecular weight
% Calculatiing molecular weight
% Input Datas
function [mw]= molecular_weight(species)
atoms = ['H','O','C','N','S','A'];
atomic_weight = [1.007,15.999,12.011,14.006,32.059,39.792];

mw=0;
% Creating for loop and if condition
for i = 1:length(species)
    for j = 1:length(atoms)
     if strcmpi(species(i),atoms(j))
        mw = mw+atomic_weight(j);
        pos=j;
     end
    n=str2num(species(i));
end
    if n>1
      mw=mw+atomic_weight(pos)*(n-1)
    end
end
end
Main code:-
% a program to read the parsing the nasa theromdyanamic data
clear all
close all
clc
%universal gas constant
R=8.314;
%finding and opening the file
f1=fopen('THERMO.dat','r');
fgetl(f1);
%heading
t_line1=fgetl(f1);
%global temperature values
a=strsplit(t_line1,' ');

global_low_temp=str2double(a{2});
global_med_temp=str2double(a{3});
global_high_temp=str2double(a{4});
%skipping 3 lines
fgetl(f1);
fgetl(f1);
fgetl(f1);
%temperature selection

for i=1:53

t_line2=fgetl(f1);
A=strsplit(t_line2,' ');
species=A{1};

lt=str2double(A{end-3});
mt=str2double(A{end-1});
ht=str2double(A{end-2});


%species selection
%line1 reading
t_line6=fgetl(f1);
L=strfind(t_line6,'E');
l1=t_line6(1:L(1)+3);
l1=str2num(l1)
l2=t_line6(L(1)+4:L(2)+3);
l2=str2num(l2)
l3=t_line6(L(2)+4:L(3)+3);
l3=str2num(l3)
l4=t_line6(L(3)+4:L(4)+3);
l4=str2num(l4)
l5=t_line6(L(4)+4:L(5)+3);
l5=str2num(l5)
%line2 reading
t_line3=fgetl(f1);
L1=strfind(t_line3,'E');

l6=t_line3(1:L1(1)+3);
l6=str2num(l6)
l7=t_line3(L1(1)+4:L1(2)+3);
l7=str2num(l7)
l8=t_line3(L1(2)+4:L1(3)+3);
l8=str2num(l8)
l9=t_line3(L1(3)+4:L1(4)+3);
l9=str2num(l9)
l10=t_line3(L1(4)+4:L1(5)+3);
l10=str2num(l10)
%line3 reading
t_line8=fgetl(f1);
L2=strfind(t_line8,'E');
l11=t_line8(1:L2(1)+3);
l11=str2num(l11)
l12=t_line8(L2(1)+4:L2(2)+3);
l12=str2num(l12)
l13=t_line8(L2(2)+4:L2(3)+3);
l13=str2num(l13)
l14=t_line8(L2(3)+4:L2(4)+3);
l14=str2num(l14)


%ranging the temperature
T=linspace(lt,ht,100);


%specific heat
Cp=specific_heat(l1,l2,l3,l4,l5,l6,l7,l8,l9,l10,l11,l12,l13,l14,R,lt,mt,ht,T);
%enthalpy
H=enthalpy(l1,l2,l3,l4,l5,l6,l7,l8,l9,l10,l11,l12,l13,l14,R,lt,mt,ht,T);
%entropy
S=entropy(l1,l2,l3,l4,l5,l6,l7,l8,l9,l10,l11,l12,l13,l14,R,lt,mt,ht,T);

% Calculating Molecular Weight;
mw= molecular_weight(species);
% Creating a Plots
disp(mw)


%plotting
figure(1)
plot(T,Cp,'linewidth',2,'color','r');
xlabel('Temperature in k')
ylabel('specific heat in kj')
title('species_name')

figure(2)
plot(T,H,'linewidth',2,'color','b');
xlabel('Temperature in k')
ylabel('enthalpy in kj/(mol)')
title('species_name')

figure(3)
plot(T,S,'linewidth',2,'color','g');
xlabel('Temperature in k')
ylabel('entropy in kj/(mol)k')
title('species_name')

 % Saving jpg Data
mkdir(species)
cd(species)
saveas(1,'Temprature vs SpecificHeat.jpg');
saveas(2,'Temprature vs Enthalpy.jpg');
saveas(3,'Temprature vs Entropy.jpg');
 % saving fig Data
 % Change Current folder of data
cd ..

end
fclose(f1);
2.Use the 'fopen' command the file is used to open the file in the read mode specified by 'r' keyword in the 'fopen' command. By using fgetl(), strsplit() and str2num() command find out the global mid and high temperatures in the second line.
3.calculating the 14 coefficients for all the species in the given thermodynamic data file. In data file each species has three lines in which 14 coefficients are there .
4.The file is read line by line by using the 'fgetl' All the heading and species related information related in code. The first line represents the title if the file so it is ignored.
5.The next line has the global high, global mid and global low temperature values which is read by using 'fgetl' command and split into the three values by using the 'strsplit' command and converted into numbers. The next three lines are comments in the file so they are ignored by using fgetl() command
6.By using strfind() command, find out the number of exponential in first line, by which we can find out the number of coefficient in first line. Then the next 3 lines of the file is read which contains the high and low-temperature data of the particular
7.The low temperatures values are stored in variables ll, l2, l3, l4, l5, l6, l7 and the high temperature values are stored invariables l8, l9, l10, lll, l12, l13, l14. By doing the above steps for line two and three, we can calculate the 14 coefficients for all the species.
8.Using the 'mkdir' the current folder command a new folder is created
9.Once you find out the coefficients for a species, then calculate the entropy ,enthalpy and specific First 7 coefficients are low, mid temperature coefficients and next 7 are high temperature coef, then calculate cp, H and s.
10.The next line is the reference to specific heat(Cp) which calculates and returns the value of specific heat using the high and low-temperature values as inputs. Assuming universal gas constant R=8.314 J/mol-k and assuming temperature range from 300 to 5000 take 100 values by linspace()
Cp=R(a1+a2T+a3T"2+a4T"3+a5T"4)
11.Then we use the 'if else' conditional statement to check if the temp values are less than or equal to the global mid temperature values and select the appropriate equations with high and low-temperature coefficients is used to calculate the specific heat value denoted by 'Cp' and return that value.
12.The next line is the reference to enthalpy (H) .This uses the high-temperature coefficients, low-temperature coefficients, universal gas constant , and global minimum, global mid and global maximum temperature values as the input
H=RT(a1+a2T/2+a3T"2/3+a4T"3/4+a5T"4/5+a6T)
13.The next line is the reference to a entropy(S) which calculates and returns the value of entropy using the high and low temperature values as inputs .
S=R(a1logT+a2T+a3T"2/2+a4T"3/3+a5T"4/4+a7)
14.Hence with the given inputs enthalpy,entropy and specific heat as been calculated
15.plot the graph between entropy,enthalpy and specific heat vs temperature
16.This function for molecular weight calculations requires 'species name' as input argument and it is saved in the variable 'Mw' and the output argument is molecular mass.
17.A string array is created which contains the name of the atoms
18.A variable Atomic_weight is created which contains the atomic weight of respective atoms in the string
Constituents = ['H', 'C', 'N', 'O', 'Ar'];
20.Then used 'strcmp' command to compare the name of the element with the string
If there is a repetition of an element, 'str2num' is used to find that and (n-1) is multiplied to Atomic_weight of the element to calculate molecular
21.Hence with the given inputs enthalpy,entropy and specific heat as been calculated
22.plot the graph between entropy,enthalpy and specific heat vs temperature
Results:-
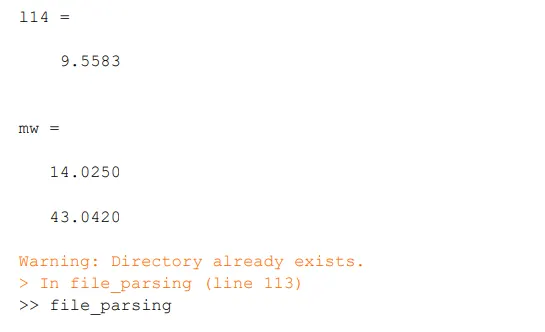
Molecular weights
Plots:-
plot of species (O2)
Plots of N2
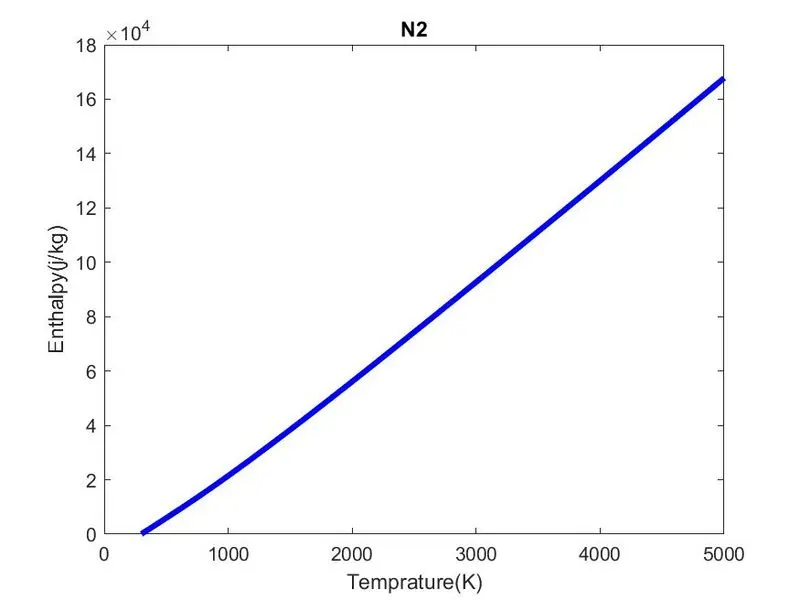
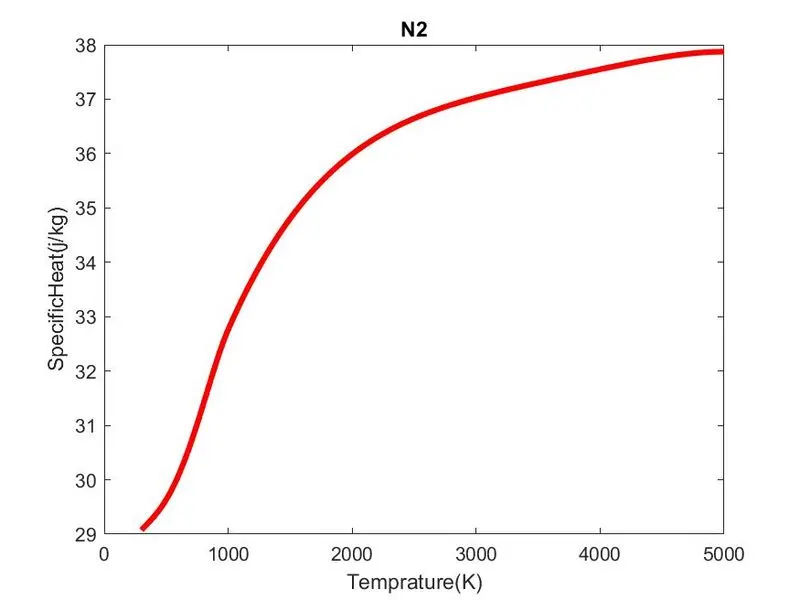
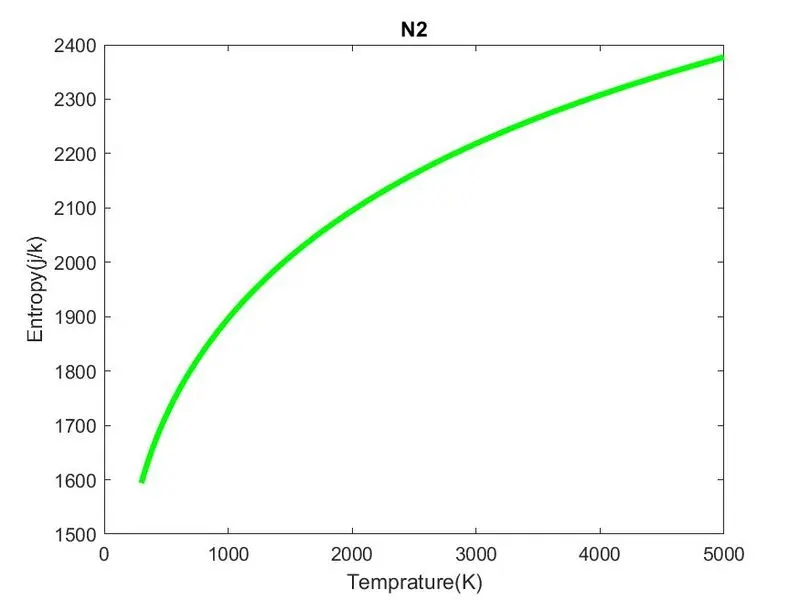
plots of co2
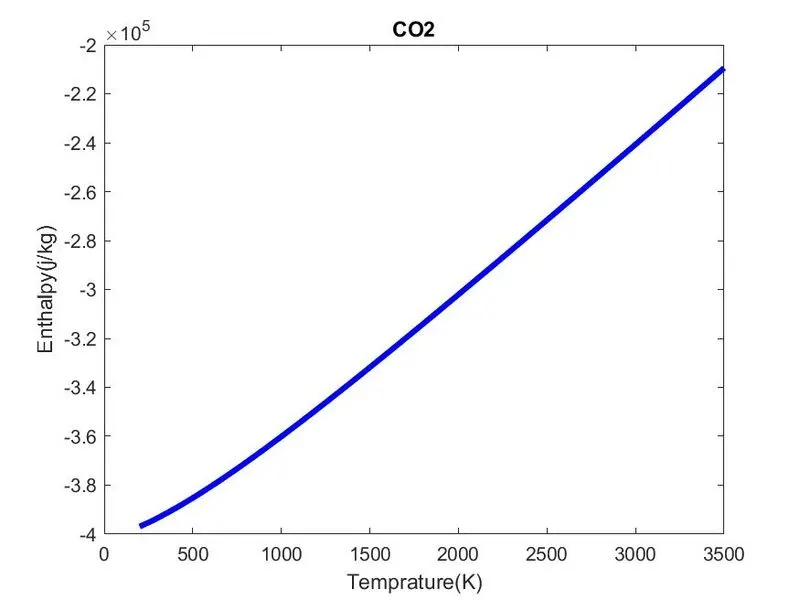
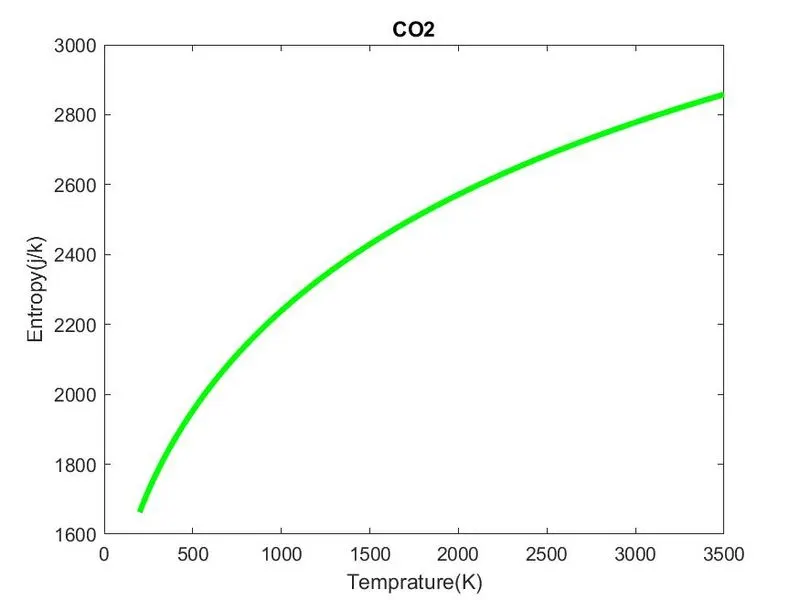
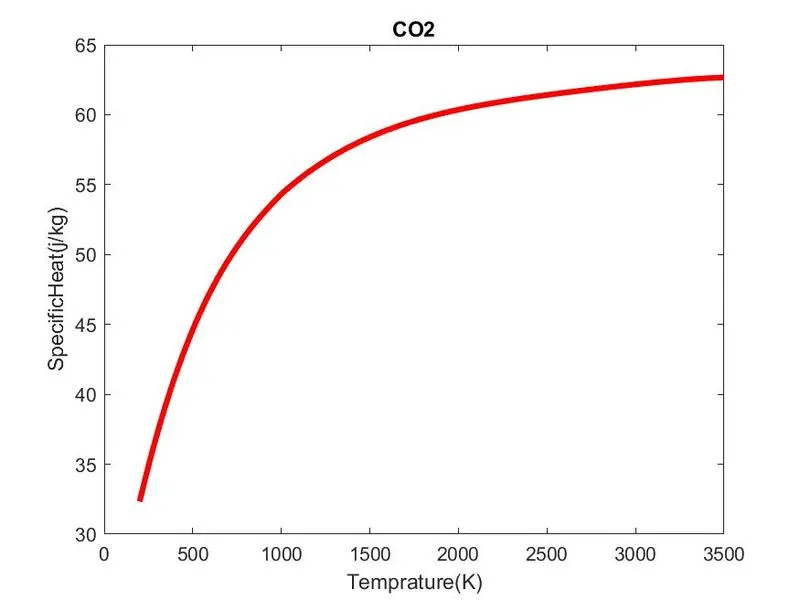
The species graphs has been saved as seperate folders with respective names

conclusion:-The progam has been executed by parsing the nasa thermodynamic data to find the enthalpy,entropy and specific heat of the species, with respect to these properties (Cp,S,H) and temperature the graphs as been plotted for each species and saved as a individual folders with naming.
Refrences:-
1.https://stackoverflow.com/questions/15750351/parse-text-file-in-matlab
3.https://sciencestruck.com/difference-between-entropy-enthalpy-in-thermodynamics