Project 1 - Parsing NASA thermodynamic data
Parsing NASA thermodynamic data -MATLAB
Aim Of The Project:-
To extract the NASA data from thermodynamics file and plot the graph b/w temparature and specific heat or enthalpy or entropy. And also calculate the value of specific heat or enthalpy or entropy from given files .
Calculate the molecular weight of each species and display it in the command window.
Plot the Cp, Enthalpy and Entropy for the local temperature range (low temperature : high temperature) specific for each species.
Save the plots as images with appropriate names and dump them in separate folders for each species with suitable name. All these should be generated automatically.
Introduction:-
Data parsing is the process of to extact the data from given files and the calculate the value of enthalpy,entropy and specific heat also .Here we can find the 14 cofficient from the files which can help for further calculation.
Formula is given below -
where
Cp= Specific Heat [J/KgK]
H= Enthalpy[Jule]
S= Entopy [J/K]
a = Coefficients
T= Temparature[K]
Here R is Universal Gas Constant
The FIRST 7 coefficients are HIGH-temperature coefficients and the SECOND 7 coefficients are LOW-temperature coefficients.
Also use the LOCAL TEMPERATURE RANGES which is unique for each individual species, not the GLOBAL TEMPERATURE RANGE.
SYNTAX USED-
fopen - This used for call the file in matlab and read the file or read the value
fgetl - use for read the particular line in data file
strsplit - it will split the string an array
str2num - it will convert numerical value from string and strore into variable
strfind - use for particular character in string
linspace - generate linear space vector
mkdir - make to new folder
strcmp - compare to string
strdouble -it convert the text into double precision value
sprintf - write data to a text file
fprintf - formate data into string
Explain to Code:-
- Program will start with close all,clear all and clc to clear the command window and work space.
- we will the data files to using of fopne and fgetl use for the read the file to line .
- usefull data extact as global temparature ,it is a header line then using the fgetl command to extracting the othe data line to line and egnore the line where not any data available.
- data will axtracted from all 53 species there are having 14 coefficient where 7 are higher and 7 are lower temparature.
- this process carried out with help of for loops.
- calculate the specific heat, enthalpy, entropy and molecular weight with help of differant function files which called by the main program.
- Then we wiil plot the enthalpy vs temparature,entopy vs temparature,specific heat vs temparature graph of 53 species and these three folder save in differant folder.
- after this we will display molecular weight of all species and all these things happend in MATLAB.
Main Code:-
close all
clear all
clc
% Parsing the data from NASA Thermodyanamic File

%Extacting the data from file

f1 = fopen('THERMO.dat','r');

%reading the line

line_1= fgetl(f1); %skiping the line
line_2= fgetl(f1);

%obtaine the global temp value and store them as a number

global_value= strsplit(line_2,' ');

glow_temp= str2num(global_value{2});
glow_mid_temp= str2num(global_value{3});
glow_high_temp= str2num(global_value{4});


line_3= fgetl(f1); %skiping the line
line_4= fgetl(f1); %skiping the line
line_5= fgetl(f1);

% Universal gas constant R in Kj/(K-mole-K)

R= 8.314;
for i= 1:53;
    T= fgetl(f1);
    % extracting the species name

    species_name= T(1:9);

    %removing blank space
    species_name= deblank(species_name)

    %extracting the local temp

    species_temp= T(49:75);

    local_value= strsplit(species_temp,' ');

local_temp= str2num(local_value{2});
local_mid_temp= str2num(local_value{3});
local_high_temp= str2num(local_value{2});
%storing the local temp in variable

temp= [local_temp,local_mid_temp,local_high_temp];
temp_range= linspace(local_temp,local_high_temp,500)

coeff= fgetl(f1);
coeff1= findstr(coeff,'E');

%extracting the coefficient

a1= coeff(1:coeff1(1)+3);
a1= str2num(a1);

a2= coeff(coeff1(1)+4:coeff1(2)+3);
a2= str2num(a2);

a3= coeff(coeff1(2)+4:coeff1(3)+3);
a3= str2num(a3);

a4= coeff(coeff1(3)+4:coeff1(4)+3)
a4= str2num(a4);

a5= coeff(coeff1(4)+4:coeff1(5)+3)
a5= str2num(a5);

new_line= fgetl(f1);

coeff2= findstr(new_line,'E')

a6= new_line(1:coeff2(1)+3);
a6= str2num(a6);

a7= new_line(coeff2(1)+4:coeff2(2)+3);
a7= str2num(a7);

a8= new_line(coeff2(2)+4:coeff2(3)+3);
a8= str2num(a8);

a9= new_line(coeff2(3)+4:coeff2(4)+3)
a9= str2num(a9);

a10= new_line(coeff2(4)+4:coeff2(5)+3)
a10= str2num(a10);

new_line1= fgetl(f1);

coeff3= findstr(new_line1,'E')

a11= new_line1(1:coeff3(1)+3);
a11= str2num(a11);

a12= new_line1(coeff3(1)+4:coeff3(2)+3);
a12= str2num(a12);

a13= new_line1(coeff3(2)+4:coeff3(3)+3);
a13= str2num(a13);

a14= new_line1(coeff3(3)+4:coeff3(4)+3)
a14= str2num(a14);

a15= new_line1(coeff3(4)+4:coeff3(5)+3)
a15= str2num(a15);

%specific heat calculation

Cp= specific_heat(a1,a2,a3,a4,a5,a8,a9,a10,a11,a12,temp,temp_range,R);

%enthalpy calculation

H= enthalpy(a1,a2,a3,a4,a5,a6,a8,a9,a10,a11,a12,13,temp,temp_range,R);

% calculation of entropy

S= entopy_1(a1,a2,a3,a4,a5,a7,a8,a9,a10,a11,a12,13,a14,temp,temp_range,R);

%calculation of mal.weight

m_weight= weight(species_name);

%saving mol. weight

species_w= fopen('species_mass.text','w');
fprintf(species_w,'molecular mass of %s is %f',species_name,m_weight);
fclose(species_w);
%ploting and saving
cur_dir=pwd;
%making a new folder for each species
mkdir(species_name);
cd(species_name);

figure(1)
plot(temp_range,cp,'linewidth',3,'color','b',[0.2345 0.4567 0.5678]);
xlabel('Temparature [K]');
ylabel('specific heat')
title(species_name);

figure(2)
plot(temp_range,H,'linewidth',3,'color','b',[0.5678 0.3423 0.7874]);
xlabel('Temparature [K]');
ylabel('Enthalpy[kj/kg]')
title(species_name);

figure(3)
plot(temp_range,S,'linewidth',3,'color','b',[0.4532 0.1234 0.3324]);
xlabel('Temparature [K]');
ylabel('Entopy [kj/k]')
title(species_name);

%saving the plot in different folder for each species

saveas(1,'specific_heat.jpg');
saveas(2,'enthalpy.jpg');
saveas(3,'entropy.jpg');

cd(cur_dir);

%printing the molecular of species

sprintf('molecular weight %s = %f', species_name,m_weight);
end
%closing the file
fclose(f1)
Function Code for Calculation of Specific Heat
function[Cp]= specific_heat(a1,a2,a3,a4,a5,a8,a9,a10,a11,a12,temp,temp_
% a1,a2,a3,a4,a5 high temparature coefficient
% a8,a9,a10,a11,a12 Low temparature coefficient
for i= 1:length(temp_range)
if temp_range(i)<=temp(2)
Cp(i)= R*(a8+(a9*temp_range(i))+(a10*(temp_range(i).^2))+(a11*(temp_range(i).^3))+(a12*(temp_range(i).^4)));
else
Cp(i)= R*(a1+(a2*temp_range(i))+(a3*(temp_range(i).^2))+(a4*(temp_range(i).^3))+(a5*(temp_range(i).^4)));
end
end
Function Code for Calculation of enthalpy
function[H]= enthalpy(a1,a2,a3,a4,a5,a6,a8,a9,a10,a11,a12,temp,a13,temp_
% a1,a2,a3,a4,a5 high temparature coefficient
% a8,a9,a10,a11,a12 Low temparature coefficient
for i= 1:length(temp_range)
if temp_range(i)<=temp(2)
H(i)= R*((a8*temp_range(i))+(a9*((temp_range(i).^2)/2))+(a10*((temp_range(i).^3)/3))+(a11*((temp_range(i).^4)/4))+(a12*((temp_range(i).^5)/5))+a13);
else
H(i)= R*((a1*temp_range(i))+(a2*((temp_range(i).^2)/2))+(a3*((temp_range(i).^3)/3))+(a4*((temp_range(i).^4)/4))+(a5*((temp_range(i).^5)/5))+a6);
end
end
Function Code for Calculation of entropy
function[H]= enthalpy(a1,a2,a3,a4,a5,a7,a8,a9,a10,a11,a12,a14,temp,temp_
% a1,a2,a3,a4,a5 high temparature coefficient
% a8,a9,a10,a11,a12 Low temparature coefficient
for i= 1:length(temp_range)
if temp_range(i)<=temp(2)
S(i)= R.*((a8*log(temp_range(i)))+(a9*temp_range(i))+(a10*((temp_range(i)).^2)/2))+(a11*((temp_range(i)).^3)/3))+(a12*((temp_range(i)).^4)/4))+a14);
else
S(i)= R.*((a1*log(temp_range(i)))+(a2*temp_range(i))+(a3*((temp_range(i)).^2)/2))+(a4*((temp_range(i)).^3)/3))+(a5*((temp_range(i)).^4)/4))+a7);
end
end
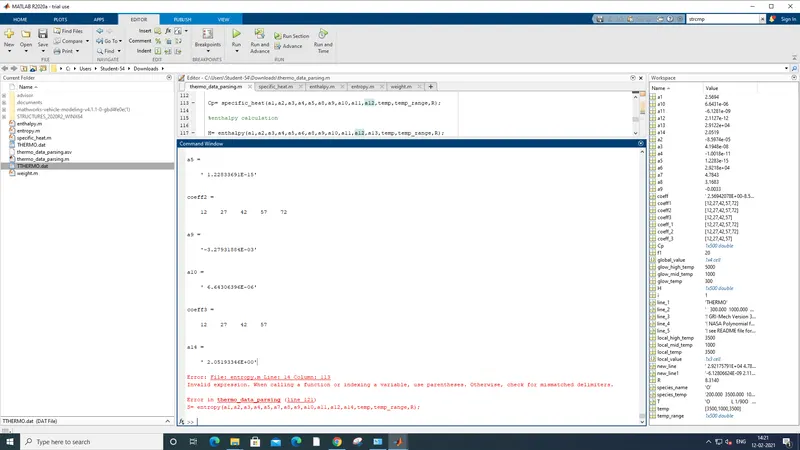
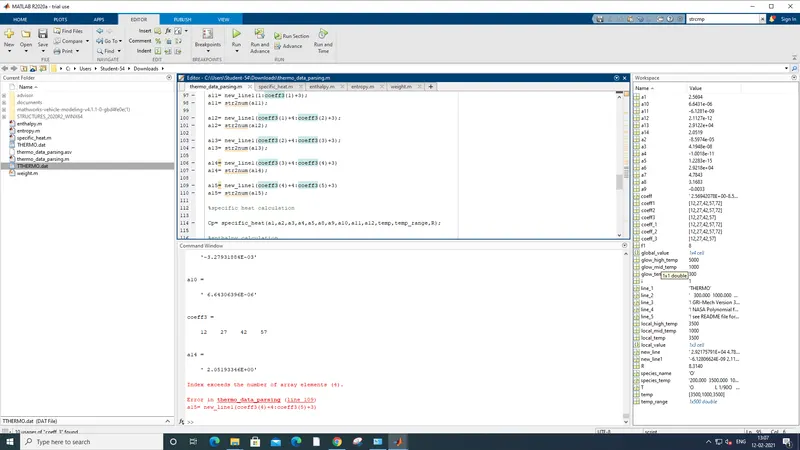
errors during the run the program
Function Code for Calculation of molecular weight
function [m_weight]= weight(species_name);
element = ('H','O','N','Ar','C','S');
atomic_mass= (1.008, 15.999, 14.007, 39.948, 12.011, 32.065)
m_weight = 0;
for i= 1:length(species_name);
for j= 1:length(element);
if strcmp= (species(i),element(j));
m_weight= m_weight+ atomic_mass(j);
end
end
b= str2num(species_name(i));
if b>1
m_weight= m_weight+ atomic_mass(a)*(b-1);
end
end
end
Output
Screen shot of each species in folder

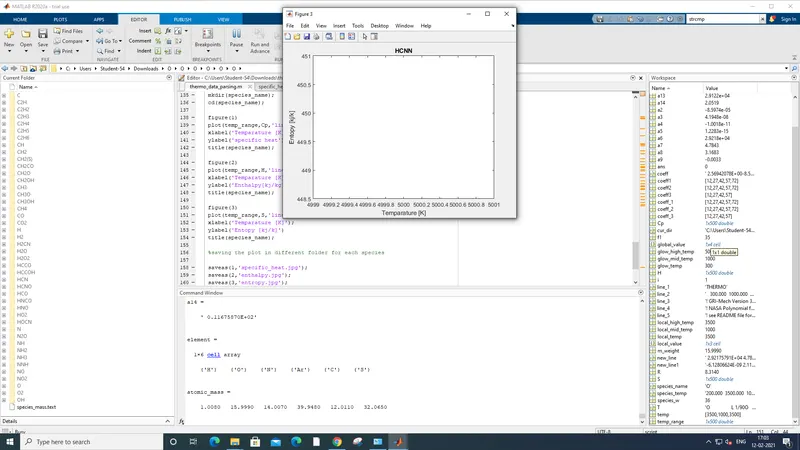
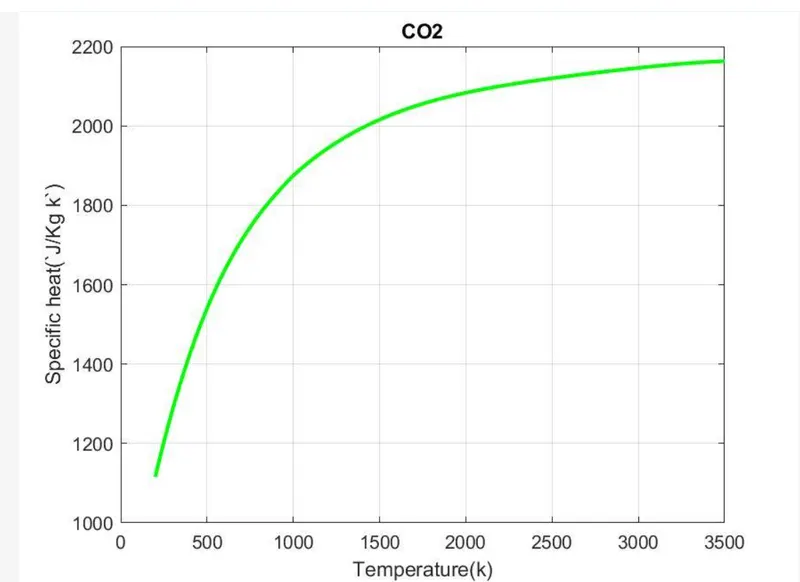
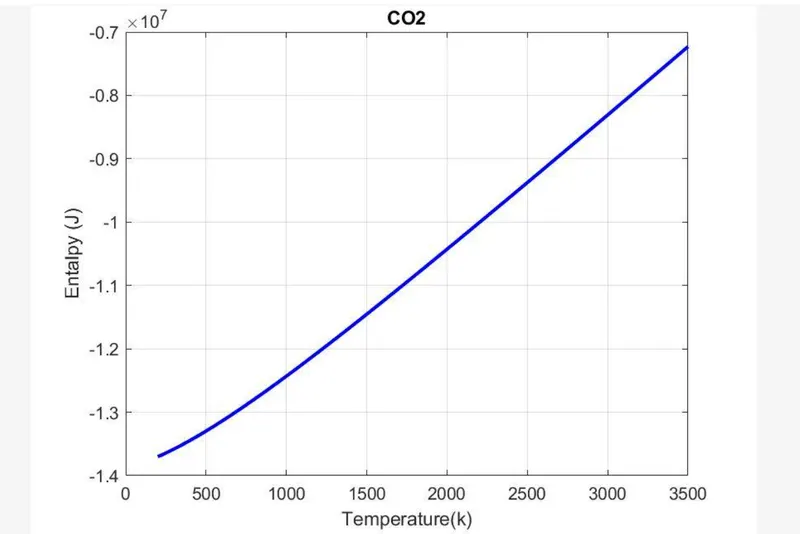
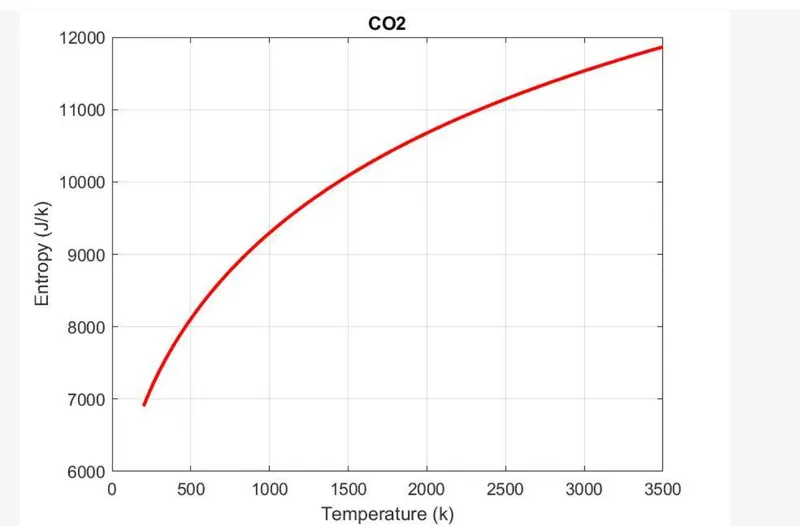
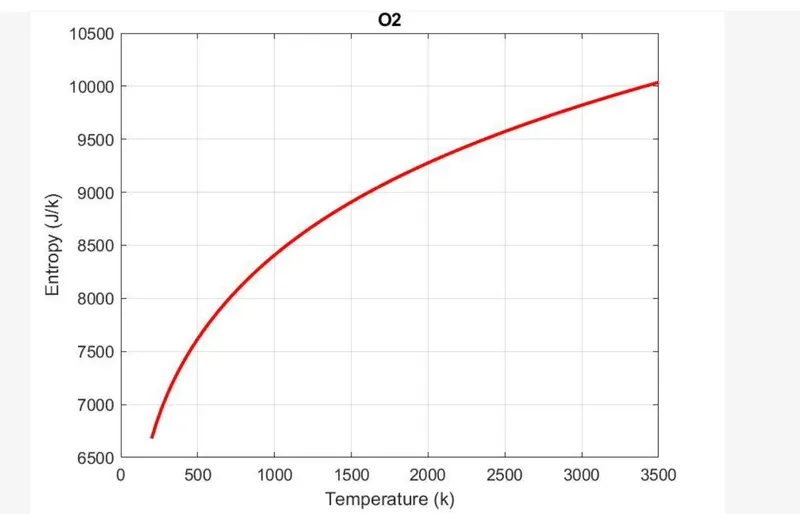
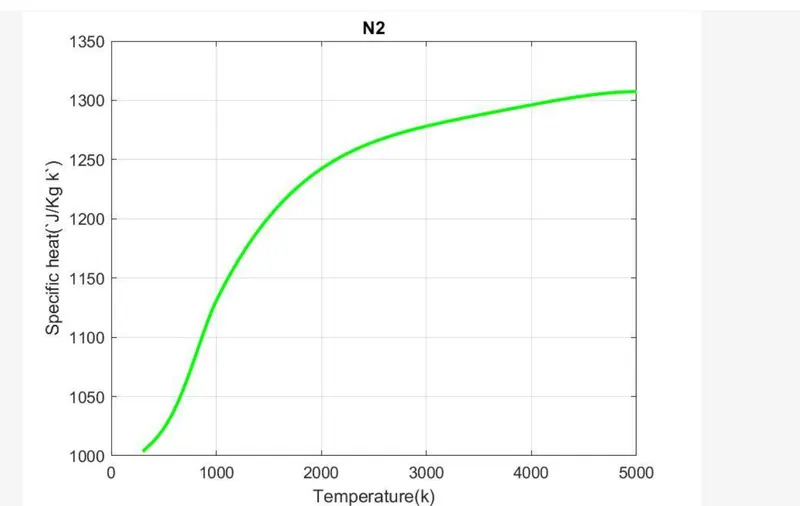
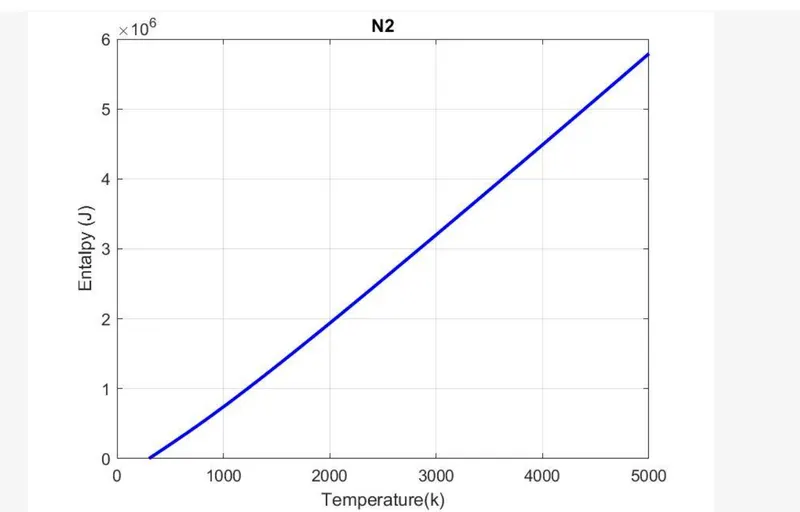
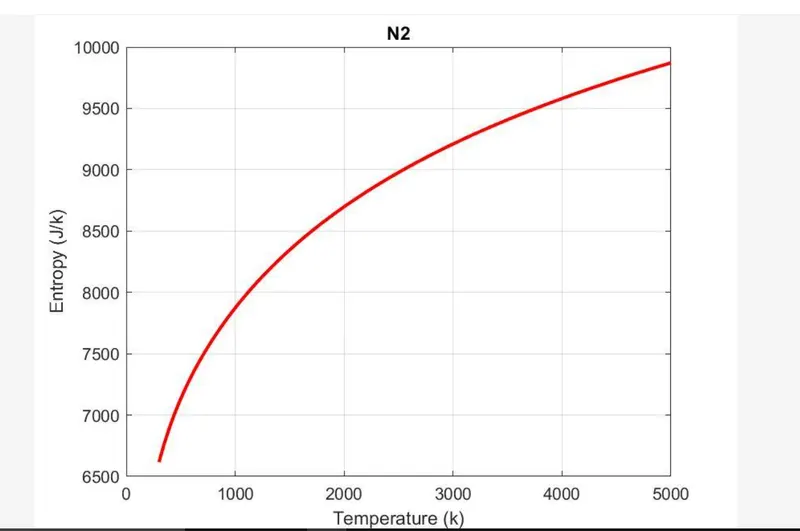
Graphs are temparature vs entropy,enthalpy, and specific heat of different species
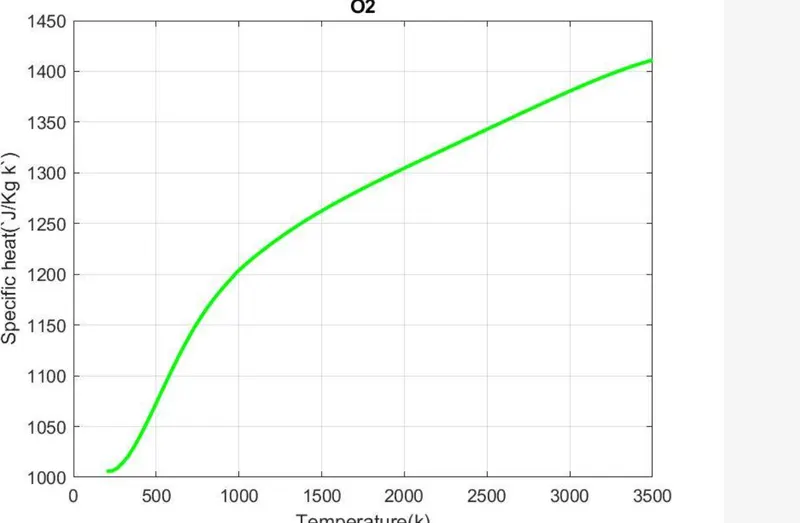
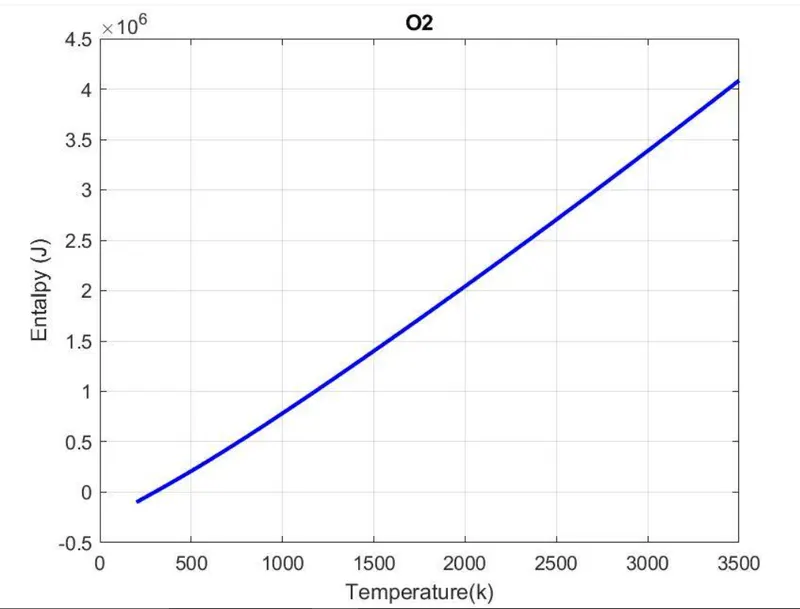
Graph of O2-
graph of N2
Graph of Co2