Parsing NASA thermodynamic data
Aim-
1. Write a function that extracts the 14 co-efficients and calculates the enthalpy, entropy and specific heats for all the species in the data file. You will be reading this file NASA thermodynamic file . The formulae are shown below.Here R is the universal gas constant, T is the temeprature
he FIRST 7 coefficients are HIGH-temperature coefficients and the SECOND 7 coefficients are LOW-temperature coefficients.
Also use the LOCAL TEMPERATURE RANGES which is unique for each individual species, not the GLOBAL TEMPERATURE RANGE.
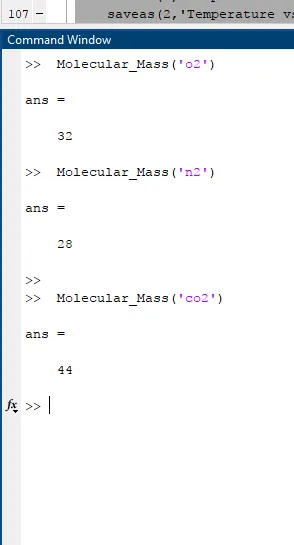
2. Calculate the molecular weight of each species and display it in the command window.
3. Plot the Cp, Enthalpy and Entropy for the local temperature range (low temperature : high temperature) specific for each species.
4. Save the plots as images with appropriate names and dump them in separate folders for each species with suitable name. All these should be generated automatically.
Theory -
Specific Heat -
Specific heat is defined by the amount of heat needed to raise the temperature of 1 gram of a substance 1 degree Celsius (°C). Water has a high specific heat capacity which we'll refer to as simply "heat capacity", meaning it takes more energy to increase the temperature of water compared to other substances . This is why water is valuable to industries and in your car's radiator as a coolant. The high heat capacity of water also helps regulate the rate at which air changes temperature, which is why the temperature change between seasons is gradual rather than sudden, especially near the oceans.
This same concept can be expanded to a world-wide scale. The oceans and lakes help regulate the temperature ranges that billions of people experience in their towns and cities. Water surrounding or near cities take longer to heat up and longer to cool down than do land masses, so cities near the oceans will tend to have less change and less extreme temperatures than inland citie . the formula can be given as

 |
= | heat energy |
 |
= | mass |
 |
= | specific heat capacity |
 |
= | change in temperature |
The SI unit for specific heat is joule per kelvin per kilogram (J/K/kg, J/(kg K), J K−1 kg−1, etc.). The symbol for specific heat is cp .
Enthalpy-
Enthalpy is a property of a thermodynamic system, defined as the sum of the system's internal energy and the product of its pressure and volume . The total enthalpy of a system cannot be measured directly because the internal energy contains components that are unknown, not easily accessible, or are not of interest in thermodynamics. In practice, a change in enthalpy (ΔH) is the preferred expression for measurements at constant pressure, because it simplifies the description of energy transfer . When matter transfer into or out of the system is also prevented, the enthalpy change equals the energy exchanged with the environment by heat . Calibration of enthalpy changes requires a reference point. Enthalpies for chemical substances at constant pressure usually refer to standard state: most commonly 1 bar (100 kPa) pressure.
The enthalpy of an ideal gas is independent of its pressure, and depends only on its temperature, which correlates to its internal energy. Real gases at common temperatures and pressures often closely approximate this behavior, which simplifies practical thermodynamic design and analysis. the formula for Enthalpy is

 |
= | enthalpy |
 |
= | internal energy |
 |
= | pressure |
 |
= | volume |
The of Enthalpy units are in J or kJ . symbol is H
Entropy -
Entropy is a measure of the energy dispersal in the system. Entropy increases when a substance is broken up into multiple parts. The process of dissolving increases entropy because the solute particles become separated from one another when a solution is formed. Entropy increases as temperature increases. Entropy is an important mental model because it applies to every part of our lives. It is inescapable, and even if we try to ignore it, the result is a collapse of some sort. Truly understanding entropy leads to a radical change in the way we see the world.Entropy is not energy; entropy is how the energy in the universe is distributed. There is a constant amount of energy in the universe, but the way it is distributed is always changing. the formula can be given as

 |
= | entropy |
 |
= | Boltzmann constant |
 |
= | natural logarithm |
 |
= | number of microscopic configurations |
Procedure-
Data parsing is a method where one string of data gets converted into a different type of data. So let’s say you receive your data in raw HTML, a parser will take the said HTML and transform it into a more readable data format that can be easily read and understood.A well-made parser will distinguish which information of the HTML string is needed, and in accordance to the parsers pre-written code and rules, it will pick out the necessary information and convert it into JSON, CSV or a table, for example.
- So we initally start the process by loading the file into the MATLAB by using the fopen command , after typing the command we have to give the file name as shown F1 = fopen('THERMO.dat','r');
- From the given file there is data in the second line so we use the fgetl command as shoen in the code a=fgetl(F1); this command is used to change the line that is once the command is used line comes into the given variable , if we give the command again the second line will be stored into the same variable .
- From the given file we observe that there are some un wanted lines we can skip them by using the fgetl command .
- In order to skip lines at a time we can we can use for loop as shown in the code for i=1:2
a=fgetl(F1);
end - Hence the line we need is in the the given variable we are storing them into a new variable , it is temp_line the code is as shown temp_line = a;
- So the line is the string format so we need to break the string so we use string split command which is as shown strsplit( syntax ,' '); the code is given as a = strsplit(temp_line,' ');
- Since the line is break we need to convert them into numbers is from cell matrix to array so we use this command str2num({}) , in the command it is given as globel_low_temperature = str2num(a{2}); in this command the data is being assigned to the globel_low_temperature .
- From the data we observe that there are unwanted lines , we slip them by using for loop and fgetl as shown for i=1:3
a=fgetl(F1);
end
by doing this we skip unwanted lines
- So now we go to the main line so now we have to repeat the same procedure to find the required data ,as shown line1 = fgetl(F1) a = line1; a = strsplit(line1,' '); specimen=a{1}; med_temp=str2num(a{end-1}); high_temp=str2num(a{end-2}); low_temp =str2num(a{end-3}); t = linspace(low_temp,high_temp,200);
- From the above code we observe that new line is assigined to the variable 'a' then we are breaking the line which is in the form of string by using string split command ,now we are storing the values in the line by using string to number command ,we declare the other data to other variables as of our requirement as shown and finally we declare all the data as our requirment the linspace command is used to show set of numbers in a given limit .
- So now we are going to break all the other strings and broken strings into numbers and assign the coefficients to the variables as shown line1 = fgetl(F1); %conversion of line to string a=line1; a=findstr(line1,'E'); line1(1:12+3) a1=line1(1:a(1)+3); a1=str2num(a1); a2=line1(a(1)+4:a(2)+3); a2=str2num(a2); a3=line1(a(2)+4:a(3)+3); a3=str2num(a3); a4=line1(a(3)+4:a(4)+3); a4=str2num(a4); a5=line1(a(4)+4:a(5)+3); a5=str2num(a5);
- From the above code we observe that line get changed and gets assigned to variable 'a' , in the string we use findstring to find E in which it gives the positions of E that is exact positions of E from the starting of the line so that we find all the numbers in the coefficient data , since we got the exact position ,we use line1(1:a(1)+3); so that we get total no of digits so that we can convert it into number by using string to number command . since there are five digits we waill do it for all off them and each and every line present in the given file .
- Comming to the other lined we need to do the same process which is as shown in below code . %going to second line
line2 = fgetl(F1);
%breaking the second line into parts
a = line2;
a = findstr(line2,'E');
a6 = line2(1:a(1)+3);
a6 = str2num(a6);
a7 = line2(a(1)+4:a(2)+3);
a7 = str2num(a7);
a8 = line2(a(2)+4:a(3)+3);
a8 = str2num(a8);
a9 = line2(a(3)+4:a(4)+3);
a9 = str2num(a9);
a10 = line2(a(4)+4:a(5)+3);
a10 = str2num(a10);
%going to third line
line3 = fgetl(F1);
%breaking the third line into parts
a = line3;
a = findstr(line3,'E');
a11 = line3(1:a(1)+3);
a11 = str2num(a11);
a12 = line3(a(1)+4:a(2)+3);
a12 = str2num(a12);
a13 = line3(a(2)+4:a(3)+3);
a13 = str2num(a13);
a14 = line3(a(3)+4:a(4)+3);
a14 = str2num(a14); - The % is used to denote the comments which are as shown below %t = temeprature
%cp = specific heat , h = enthalpy , s = entropy
%r = universal gas constan,
r = 8.314;
%calling the function - After declearing the data to the variables we need to calculate the specific heat , enthalpy , entropy so we are using a function called as thermal in this function we have defined the formulas to get specific heat , enthalpy , entropy . it is weitten as shown thermal(a1,a2,a3,a4,a5,a6, a7,a8 ,a9 ,a10, a11,a12,a13, a14,t,r);
- The sub function is given below
function [cp , h , s] = thermal(a1,a2,a3,a4,a5,a6, a7 ,a8 ,a9 ,a10 , a11 ,a12 , a13 , a14 ,t,r) % t=(200:3500) for i=1:length(t) if t(i) > 1000 % for finding specfic heat cp(i) =r*( a1 + a2*t(i) + a3*t(i)^2 + a4*t(i)^3 + a5*t(i)^4) % for finding enthalpy h(i) = r*t(i)*(a1 + a2*t(i)/2 +a3*t(i)^2/3 +a4*t(i)^3/4 + a5*t(i)^4/5 + a6/t(i)) % for finding entropy s s(i) = r*(a1*log(t(i)) +a2*t(i)+a3*t(i)^2/2 + a4*t(i)^3/3 +a5*t(i)^4/4 + a7) else % for finding specfic heat cp(i)=r*( a8 + a9*t(i) + a10*t(i)^2 + a11*t(i)^3 + a12*t(i)^4) % for finding enthalpy h(i)= r*t(i)*(a8 + a9*t(i)/2 +a10*t(i)^2/3 +a11*t(i)^3/4 + a12*t(i)^4/5 + a13/t(i)) % for finding entropy s s(i)= r*(a8*log(t(i)) +a9*t(i)+a10*t(i)^2/2 + a11*t(i)^3/3 +a12*t(i)^4/4 + a14) end end end - From the above function we observe the above given formulas are converted into code ,we also observe that temperature ranges from 200 t0 3500 . in this we use the if .... else statement so that we can get the high temp coefficient values that is first seven , if the first statement is wrong we get the values from eight to fourteen .
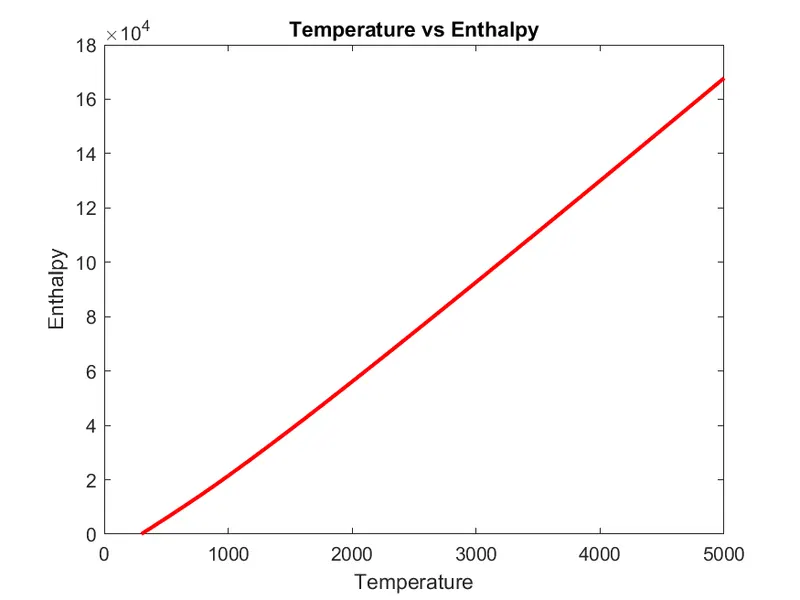
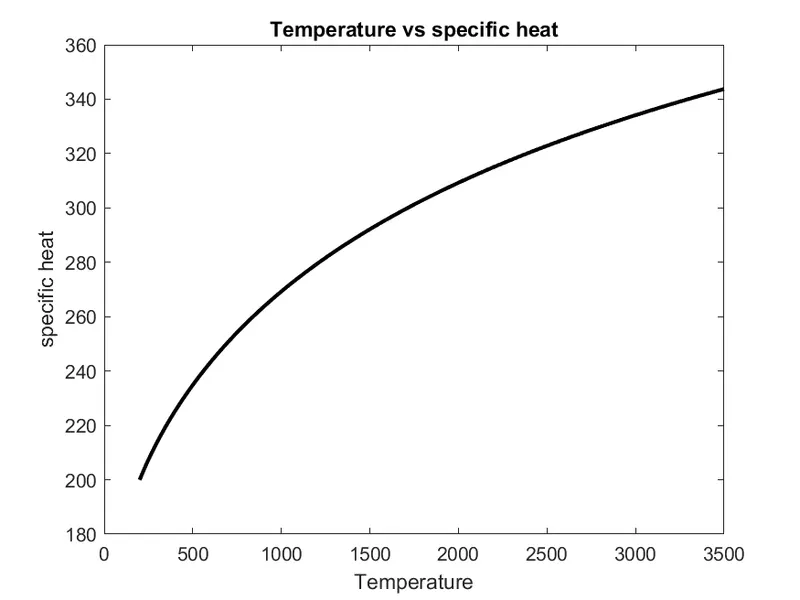
- Since the function got execuited so we need to plot the values for 1. temperature vs enthalpy 2. temperature vs specific heat The code is given below figure(1)
plot(t,h,'linewidth',2,'color', 'r')
title(sprintf('Temperature vs Enthalpy'))
xlabel('Temperature')
ylabel('Enthalpy')
figure(2)
plot(t,s,'linewidth',2,'color',' k')
title(sprintf('Temperature vs specific heat'))
xlabel('Temperature')
ylabel('specific heat')
figure(3)
plot(t,s,'linewidth',2,'color',' g')
title(sprintf('Temperature vs Entropy'))
xlabel('Temperature')
ylabel('Entropy') - Since we need to save these plots we need to creat a folder the command used to creat a folder is mkdir which is given below mkdir(specimen);
- After creating the folder we need to go into it so cd( change directory ) command is used , it is shown below cd(specimen );
- Since we have to save the plots , we use saveas command it is shown below saveas(1,'Temperature vs Enthalpy.png');
saveas(2,'Temperature vs specific heat.png');
saveas(3,'Temperature vs Entropy.png'); - After saving the file in the folder we need to come back we use cd.. command
- We need to calculate molecular weight so we need to write a seperate function (Molecular_Mass)
- In the Molecular_Mass function we need to declare the Atoms and atomic weight and we need to generate the logic to add the atomic number depending on the specimen formula , whichc is as shown below
function [MM] = Molecular_Mass(specimen) Atoms= ['H' , 'C' ,'O', 'N' , 'A']; atomic_number = [1 12 16 14 40]; MM=0; for i=1:length(specimen) for j=1:length(Atoms) if strcmpi(specimen(i),Atoms(j)) MM= MM +atomic_number(j); position= j ; end end n=str2num(specimen(i)); if n>1; MM = MM+atomic_number(position)*(n-1); % Result = sprintf('the Molecular weight of %s is %d', specimen ,MM) end end end -
In order to see the values we have to wwrite the code in the main program as shown below % calculating the molecular weight
MM= Molecular_Mass(specimen);
Result = sprintf('the Molecular weight of %s is %d', specimen ,MM)
Please find the full code below
close all
clear all
clc

% opening a file
  F1 = fopen('THERMO.dat','r');
for i=1:2
  a=fgetl(F1);
end
    temp_line = a;
    a=strsplit(temp_line,' ');
    globel_low_temperature = str2num(a{2});
    globel_medium_temperature = str2num(a{3});
    globel_high_temperature = str2num(a{4});
%   we have to got to the next line
for i=1:3
   a=fgetl(F1);
end
 for i= 1:53
    line1= fgetl(F1);

    a = line1;
    a = strsplit(line1,' ');
    specimen=a{1};
    med_temp=str2num(a{end-1});
    high_temp=str2num(a{end-2});
    low_temp =str2num(a{end-3});

    t = linspace(low_temp,high_temp,200);

    line1= fgetl(F1);

    %conversion of line to string
    a=line1;
    a=findstr(line1,'E');
    line1(1:12+3)
    a1=line1(1:a(1)+3);
    a1=str2num(a1);
    a2=line1(a(1)+4:a(2)+3);
    a2=str2num(a2);
    a3=line1(a(2)+4:a(3)+3);
    a3=str2num(a3);
    a4=line1(a(3)+4:a(4)+3);
    a4=str2num(a4);
    a5=line1(a(4)+4:a(5)+3);
    a5=str2num(a5);

    %going to second line
    line2= fgetl(F1);
    %breaking the second line into parts
    a=line2;
    a=findstr(line2,'E');
    a6=line2(1:a(1)+3);
    a6=str2num(a6);
    a7=line2(a(1)+4:a(2)+3);
    a7=str2num(a7);
    a8=line2(a(2)+4:a(3)+3);
    a8=str2num(a8);
    a9=line2(a(3)+4:a(4)+3);
    a9=str2num(a9);
    a10=line2(a(4)+4:a(5)+3);
    a10=str2num(a10);
    %going to third line
    line3 = fgetl(F1);
    %breaking the third line into parts
    a=line3;
    a=findstr(line3,'E');
    a11=line3(1:a(1)+3);
    a11=str2num(a11);
    a12=line3(a(1)+4:a(2)+3);
    a12=str2num(a12);
    a13=line3(a(2)+4:a(3)+3);
    a13=str2num(a13);
    a14=line3(a(3)+4:a(4)+3);
    a14=str2num(a14);


    %t=temeprature
    %cp = specific heat , h = enthalpy , s= entropy
    %r= universal gas constan,
    r=8.314;
    %calling the function
    [cp , h , s] =  thermal(a1,a2,a3,a4,a5,a6, a7 ,a8 ,a9 ,a10 , a11 ,a12 , a13 , a14 ,t,r);


    figure(1)
    plot(t,h,'linewidth',2,'color', 'r')
    title(sprintf('Temperature vs Enthalpy'))
    xlabel('Temperature')
    ylabel('Enthalpy')

    figure(2)
    plot(t,s,'linewidth',2,'color',' k')
    title(sprintf('Temperature vs specific heat'))
    xlabel('Temperature')
    ylabel('specific heat')

    figure(3)
    plot(t,s,'linewidth',2,'color',' g')
    title(sprintf('Temperature vs Entropy'))
    xlabel('Temperature')
    ylabel('Entropy')

    mkdir(specimen);
    cd(specimen );
    saveas(1,'Temperature vs Enthalpy.png');
    saveas(2,'Temperature vs specific heat.png');
    saveas(3,'Temperature vs Entropy.png');
    cd ..

    % calculating the molecular weight

     MM= Molecular_Mass(specimen);
     Result = sprintf('the Molecular weight of %s is %d', specimen ,MM)


 end
Results
The plots for o2
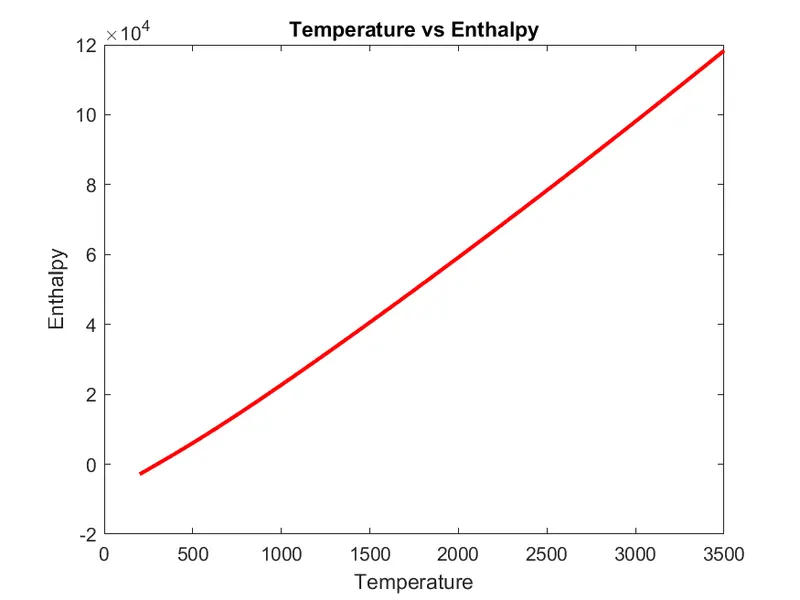
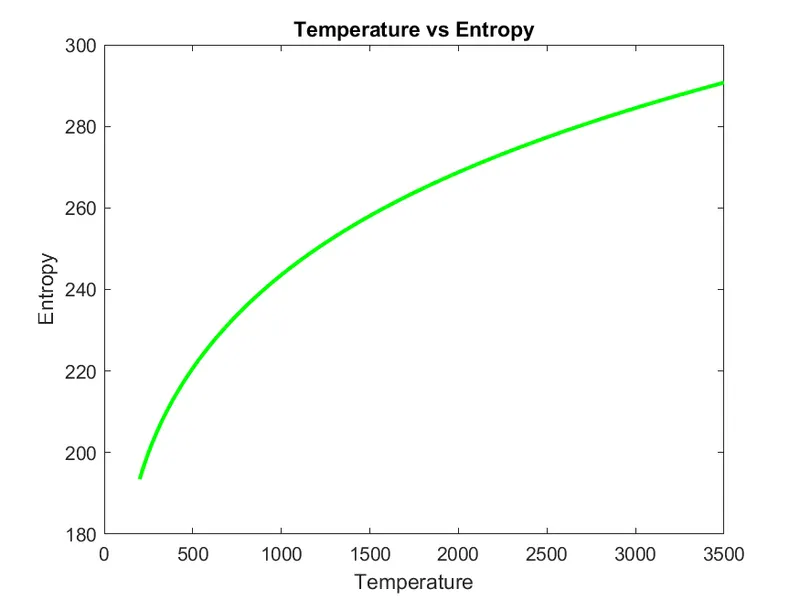
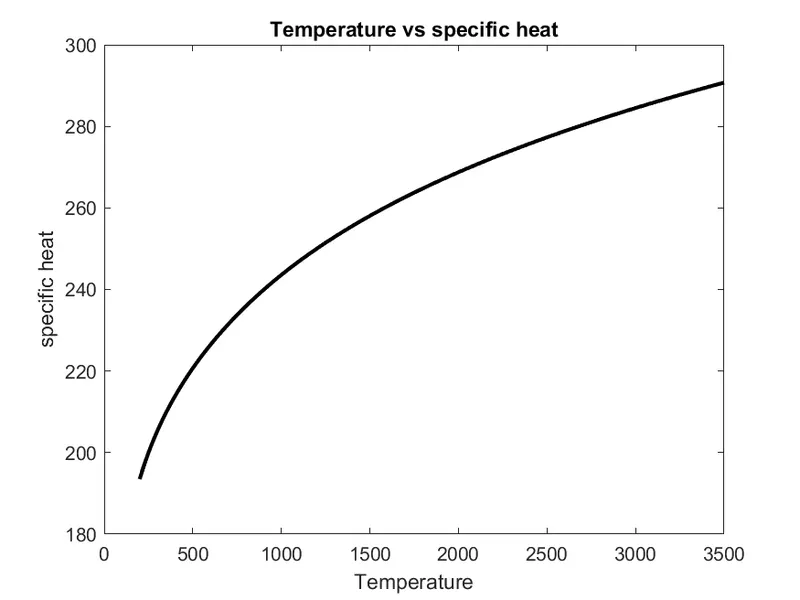
plots for n2
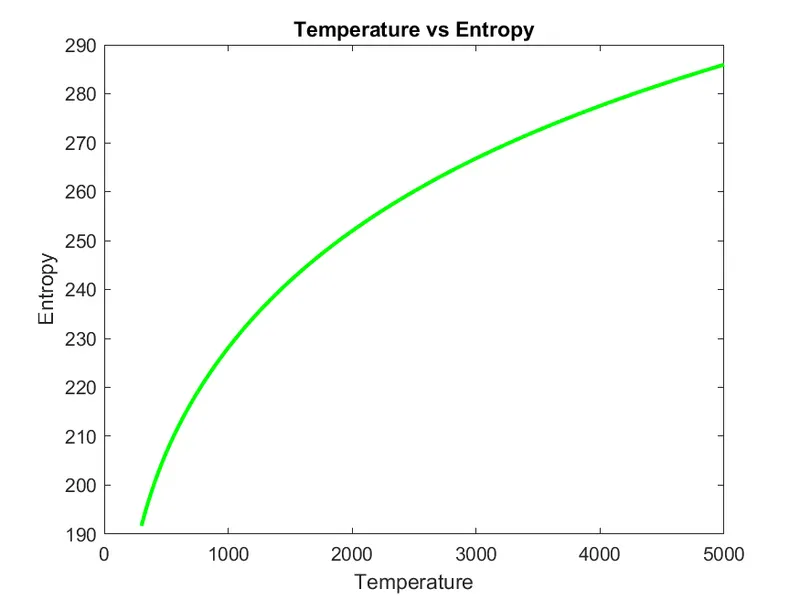
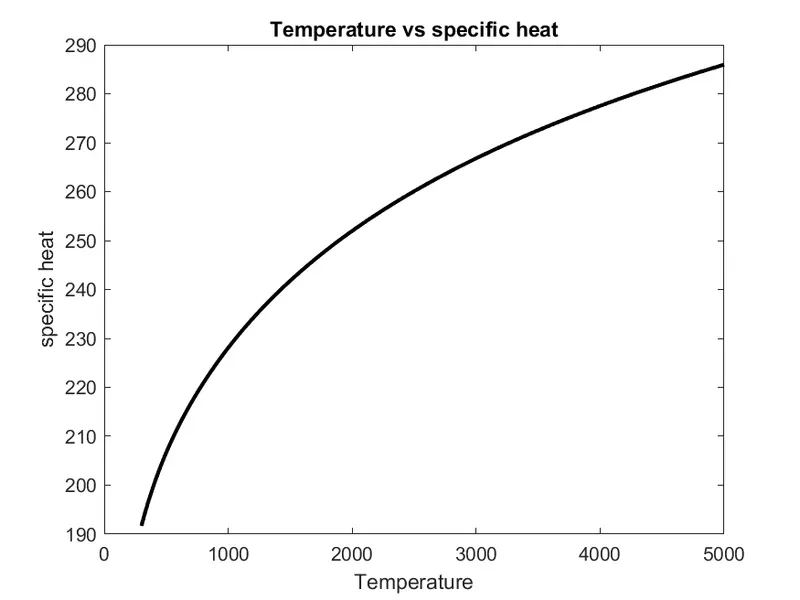
plots for co2
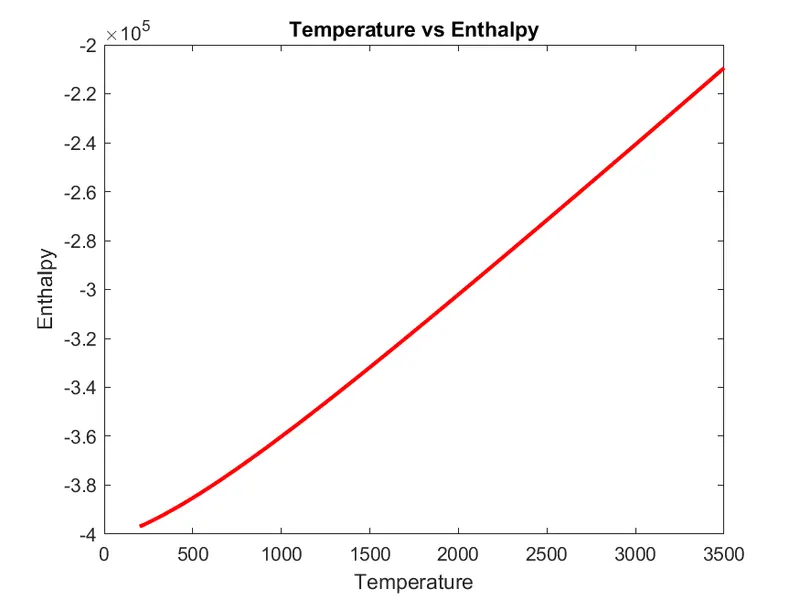
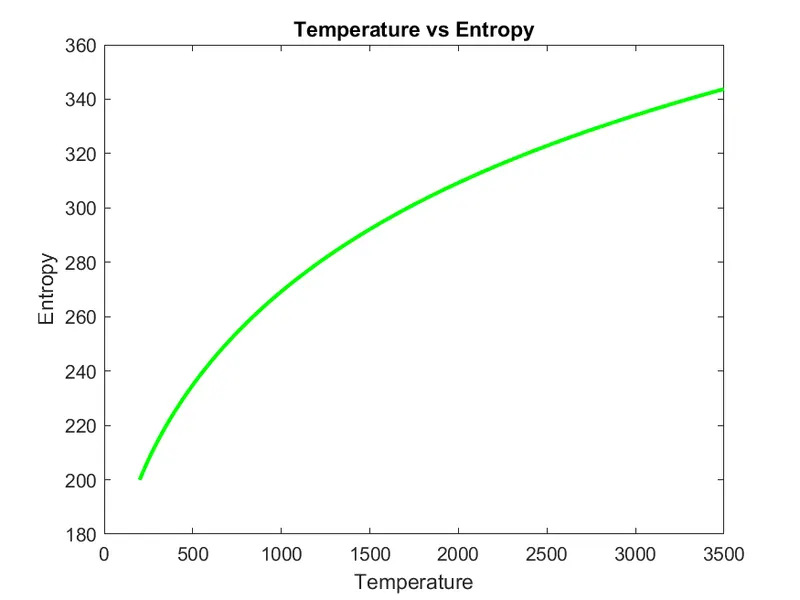
Molecular Weight of o2 , n2 , co2
Folder in which each folder is saved