Project 1 - Parsing NASA thermodynamic data
Objective:
- To write a function that extracts the 14 coefficients and calculates the enthalpy, entropy and specific heats for all the species in the data file
- To calculate the molecular weight of each species and display it in the command window
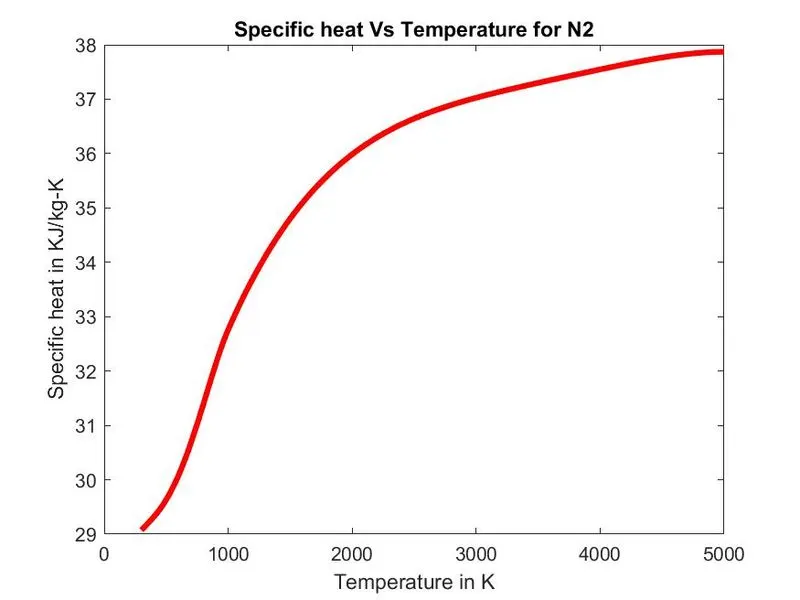
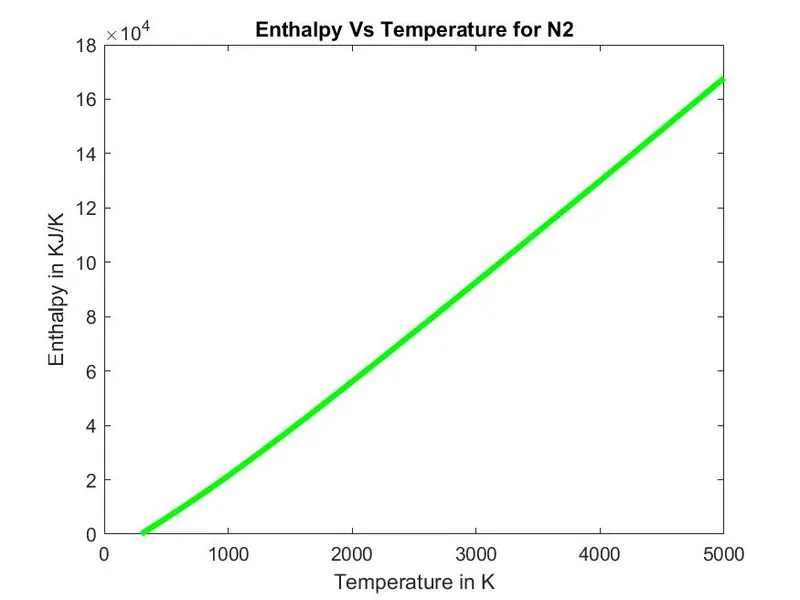
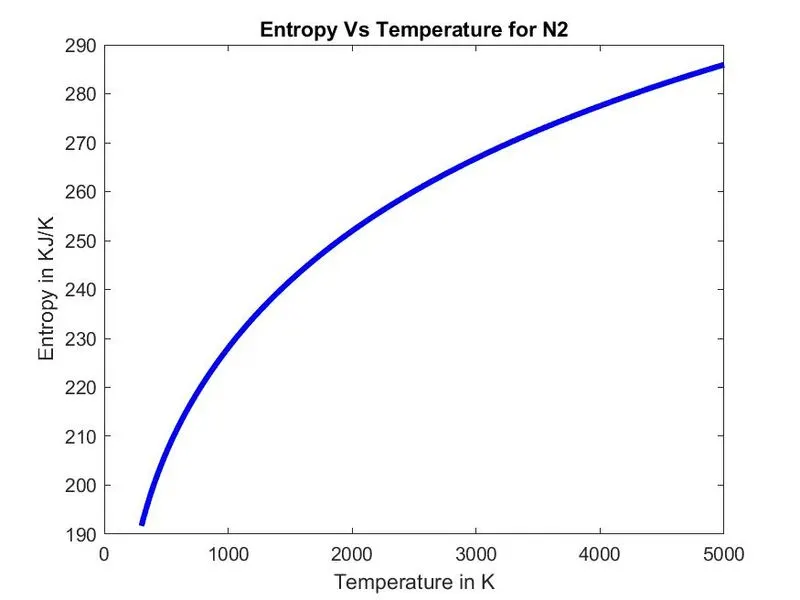
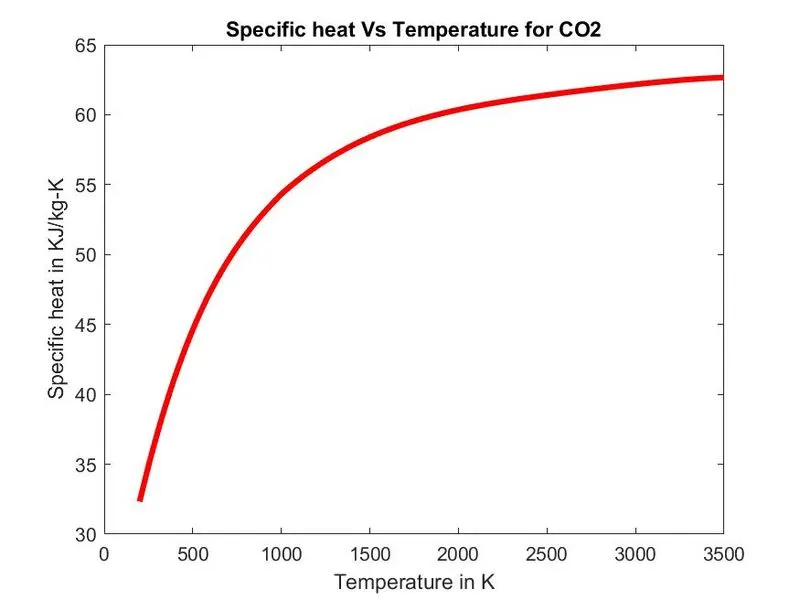
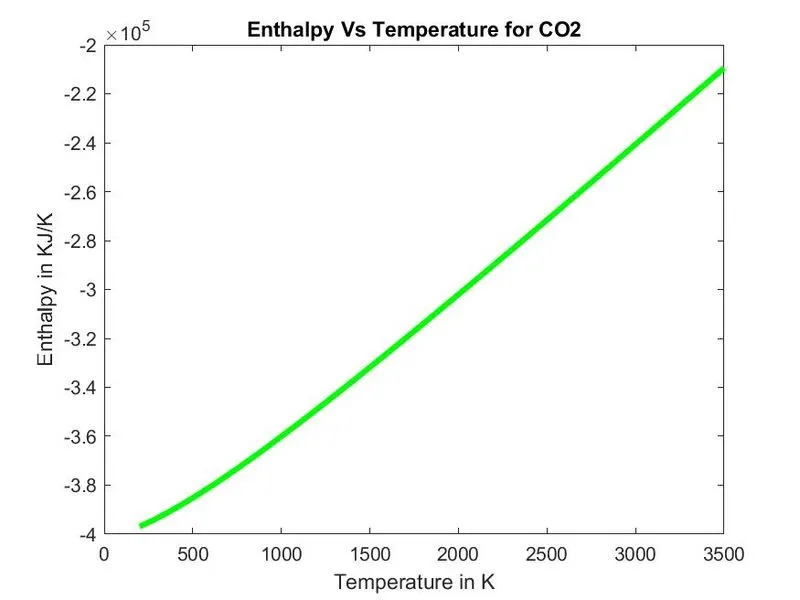
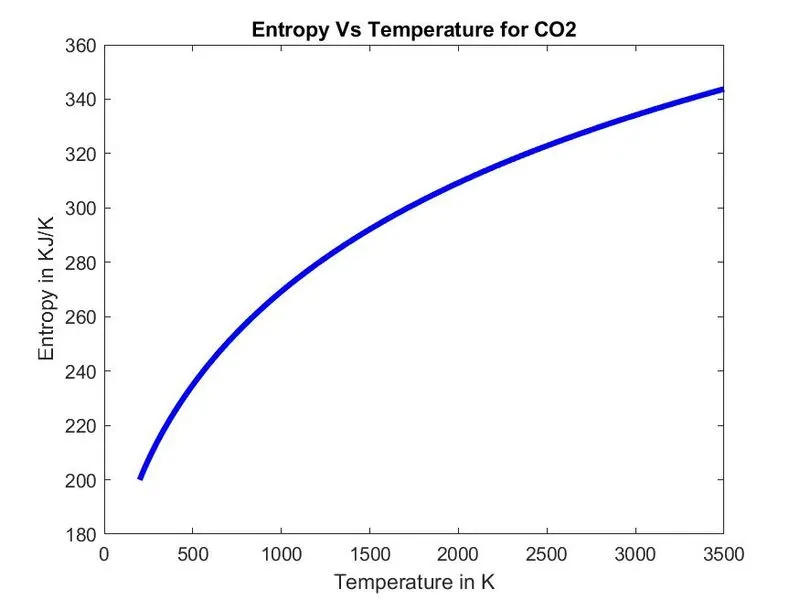
- To plot the Cp, Enthalpy and Entropy for the local temperature range for each species and save these plots in spate folders
File Parsing: The process of "parsing" can be described as reading in a data stream of some sort and building an in-memory model or representation of the semantic content of that data, in order to facilitate performing some kind of transformation on the data.
Theory:
The knowledge of thermo chemical properties, such as heat capacity, enthalpy and entropy is quite important when solving combustion-related problems. At 1961 Frank Zeleznik and Sanford Gordon invented a method for performing a simultaneous regression of the thermo chemical properties in order to approximate more than one property with a single polynomial. They ended up with the famous NASA 7 term polynomials first published by Zeleznik and Gordon (1962) and McBride et al. (1963).
Formulae to calculate Enthalpy, Entropy and Specific heat:

Where ‘R’ is the universal gas constant and also the first 7 coefficients are high temperature coefficients and second 7 coefficients are low temperature coefficients
- Specific heat is the amount of heat per unit mass required to raise the temperature by one degree Celsius.
- Enthalpy is a property of a thermodynamic system, defined as the sum of the system's internal energy and the product of its pressure and volume. It is a convenient state function standardly used in many measurements in chemical, biological, and physical systems at a constant pressure.
- Entropy is the measure of a system's thermal energy per unit temperature that is unavailable for doing useful work. Because work is obtained from ordered molecular motion, the amount of entropy is also a measure of the molecular disorder, or randomness, of a system.
MATLAB code:
- Main code
clear all close all clc f1 = fopen('THERMO.dat','r'); %Opening the file l_1 = fgetl(f1); %Skipping this line l_2 = fgetl(f1); %Reading content from this line global_temp_values = strsplit(l_2,' '); %Global temperature values GLT = str2double(global_temp_values{2}); %Global low temperature GMT = str2double(global_temp_values{3}); %Global mid temperature GHT = str2double(global_temp_values{4}); %Global high temperature l_3 = fgetl(f1); %Skipping this line l_4 = fgetl(f1); %Skipping this line l_5 = fgetl(f1); %Reading content from this line %Creating a text file for storing mass values of all species element_mass = fopen('molecular_mass.txt','w'); for k = 1:53 Line = fgetl(f1); element_name = Line(1:7); element_name = deblank(element_name); %Species name local_temp = Line(49:75); local_temp_values = strsplit(local_temp,' ');%Local Temperature values LLT = str2double(local_temp_values{1}); %Local low temperature LMT = str2double(local_temp_values{3}); %Local mid temperature LHT = str2double(local_temp_values{2}); %Local high temperature coeff_line1 = fgetl(f1); %Reading coefficients data from line1 coeff1 = strfind(coeff_line1,'E'); a1 = coeff_line1(1:coeff1(1)+3); a1 = str2double(a1); a2 = coeff_line1(coeff1(1)+4:coeff1(2)+3); a2 = str2double(a2); a3 = coeff_line1(coeff1(2)+4:coeff1(3)+3); a3 = str2double(a3); a4 = coeff_line1(coeff1(3)+4:coeff1(4)+3); a4 = str2double(a4); a5 = coeff_line1(coeff1(4)+4:coeff1(5)+3); a5 = str2double(a5); coeff_line2 = fgetl(f1); %Reading coefficients data from line2 coeff2 = strfind(coeff_line2,'E'); a6 = coeff_line2(1:coeff2(1)+3); a6 = str2double(a6); a7 = coeff_line2(coeff2(1)+4:coeff2(2)+3); a7 = str2double(a7); a8 = coeff_line2(coeff2(2)+4:coeff2(3)+3); a8 = str2double(a8); a9 = coeff_line2(coeff2(3)+4:coeff2(4)+3); a9 = str2double(a9); a10 = coeff_line2(coeff2(4)+4:coeff2(5)+3); a10 = str2double(a10); coeff_line3 = fgetl(f1); %Reading coefficients data from line3 coeff3 = strfind(coeff_line3,'E'); a11 = coeff_line3(1:coeff3(1)+3); a11 = str2double(a11); a12 = coeff_line3(coeff3(1)+4:coeff3(2)+3); a12 = str2double(a12); a13 = coeff_line3(coeff3(2)+4:coeff3(3)+3); a13 = str2double(a13); a14 = coeff_line3(coeff3(3)+4:coeff3(4)+3); a14 = str2double(a14); %a1 a2 a3 a4 a5 a6 a7 are high temperature coefficients %a8 a9 a10 a11 a12 a13 a14 are low temperature coefficients temperatures = [LLT LMT LHT]; T_range = linspace(LLT,LHT,500); %Temperature range R = 8.314; %Universal gas constant Cp = specific_heat(a1,a2,a3,a4,a5,a8,a9,a10,a11,a12,temperatures,T_range,R); %Specific heat H = enthalpy(a1,a2,a3,a4,a5,a6,a8,a9,a10,a11,a12,a13,temperatures,T_range,R);%Enthalpy S = entropy(a1,a2,a3,a4,a5,a7,a8,a9,a10,a11,a12,a14,temperatures,T_range,R); %Entropy mol_wt = weight(element_name); %Molecular weight fprintf(element_mass,'molecular mass of %s is %f\n',element_name,mol_wt); %Saving molecular weight cur_dir = pwd; %Plotting and saving mkdir(element_name) %Creating a new folder for new species cd(element_name) figure(1) plot(T_range,Cp,'linewidth',3,'color','r'); xlabel('Temperature in K'); ylabel('Specific heat in KJ/kg-K'); title(['Specific heat Vs Temperature for ', element_name]); saveas(1,'specific heat.jpg'); figure(2) plot(T_range,H,'linewidth',3,'color','g'); xlabel('Temperature in K'); ylabel('Enthalpy in KJ/K'); title(['Enthalpy Vs Temperature for ', element_name]); saveas(2,'enthalpy.jpg'); figure(3) plot(T_range,S,'linewidth',3,'color','b'); xlabel('Temperature in K'); ylabel('Entropy in KJ/K'); title(['Entropy Vs Temperature for ', element_name]); saveas(3,'entropy.jpg'); cd(cur_dir) sprintf('molecular weight of %s = %f',element_name,mol_wt) %Keeping record of mass values end fclose(element_mass); %Closing the textfile with mass values of all species fclose(f1); %Closing the file - Function code for Specific heat
function [Cp] = specific_heat(a1,a2,a3,a4,a5,a8,a9,a10,a11,a12,temperatures,T_range,R) for i = 1:length(T_range) if T_range(i)<=temperatures(2) Cp(i)= R*(a8+(a9*T_range(i))+(a10*(T_range(i).^2))+(a11*(T_range(i).^3))+(a12*(T_range(i).^4))); else Cp(i)= R*(a1+(a2*T_range(i))+(a3*(T_range(i).^2))+(a4*(T_range(i).^3))+(a5*(T_range(i).^4))); end end
- Function code for Enthalpy
function [H] = enthalpy(a1,a2,a3,a4,a5,a6,a8,a9,a10,a11,a12,a13,temperatures,T_range,R) for i = 1:length(T_range) if T_range(i)<=temperatures(2) H(i)= R*((a8*T_range(i))+(a9*((T_range(i).^2)/2))+(a10*((T_range(i).^3)/3))+(a11*((T_range(i).^4)/4))+(a12*((T_range(i).^5)/5))+a13); else H(i)= R*((a1*T_range(i))+(a2*((T_range(i).^2)/2))+(a3*((T_range(i).^3)/3))+(a4*((T_range(i).^4)/4))+(a5*((T_range(i).^5)/5))+a6); end end - Function code for Entropy
function [S] = entropy(a1,a2,a3,a4,a5,a7,a8,a9,a10,a11,a12,a14,temperatures,T_range,R) for i = 1:length(T_range) if T_range(i)<=temperatures(2) S(i)= R*((a8*log(T_range(i)))+(a9*T_range(i))+(a10*((T_range(i).^2)/2))+(a11*((T_range(i).^3)/3))+(a12*((T_range(i).^4)/4))+a14); else S(i)= R*((a1*log(T_range(i)))+(a2*T_range(i))+(a3*((T_range(i).^2)/2))+(a4*((T_range(i).^3)/3))+(a5*((T_range(i).^4)/4))+a7); end end - Function code for weight calculation
function [mol_wt] = weight(element_name) atoms = {'H','C','N','O','S','A'}; %For Argon "Ar" = "A" atomic_mass = [1, 12, 14, 16, 32, 40]; mol_wt = 0; for i = 1:length(element_name) for j = 1:length(atoms) if strcmp(element_name(i),atoms(j)) mol_wt = mol_wt + atomic_mass(j); m = j; end end n = str2double(element_name(i)); if n>1 mol_wt = mol_wt + atomic_mass(m)*(n-1); end end
Code Explanation:
- Commands used:
- fopen :- fileID = fopen(filename) opens the file.
- fgetl :- tline = fgetl(fileID) returns the next line of the specified file.
- strsplit :-
C = strsplit(str)splitsstrat whitespace. - str2double :- X = str2double(str) converts the text in str to double precision values.
- deblank :- str = deblank(str) removes the trailing blanks from the end of a character string str.
- strfind :- k = strfind(str, pattern) searches the string str for occurrences of a shorter string.
- currentFolder = pwd returns the path to current folder
- mkdir :- make new folder
- cd :- cd newFolder changes the current folder to newFolder
- THERMO.dat file has all the 14 coefficients for each of the mentioned species in the file
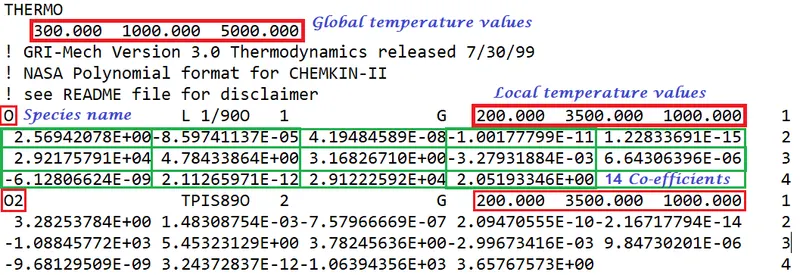
- Everytime fgetl command is used, data is taken as a string line by line.
- strsplit, str2double, strfind commands reads and converts the data from string accordingly.
- Every species/element in the .dat file has 14 coefficients which should be read in the way as represented in green boxes in the above figure.
- All the species in the .dat file provided has combination of 'H','C','N','O','S' and 'AR' elements only.
- In general, atomic masses for the elements 'H','C','N','O','S' and 'AR' are 1,12,14,16,32 and 40 respectively. These values are considered to calculate masses for all the given species.
- By using for loop, coefficients for each species is read and taken into account to calculate the functions specific heat, enthalpy and entropy which are called in the main function code.
- If-else command is also used to apply coefficient values basing on temperature values. High temperature coefficients for temperature values greater than mid temperature and low temperature coefficients for temperature values lesser than mid temperature values.
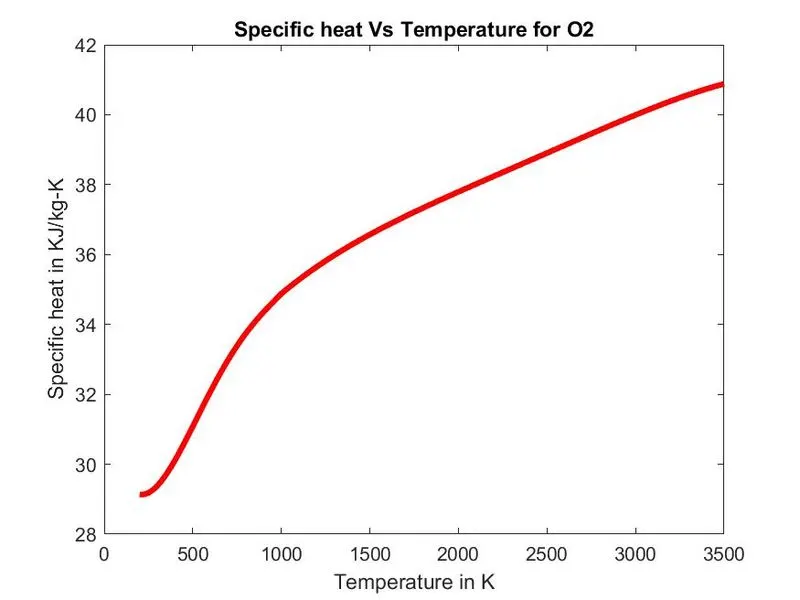
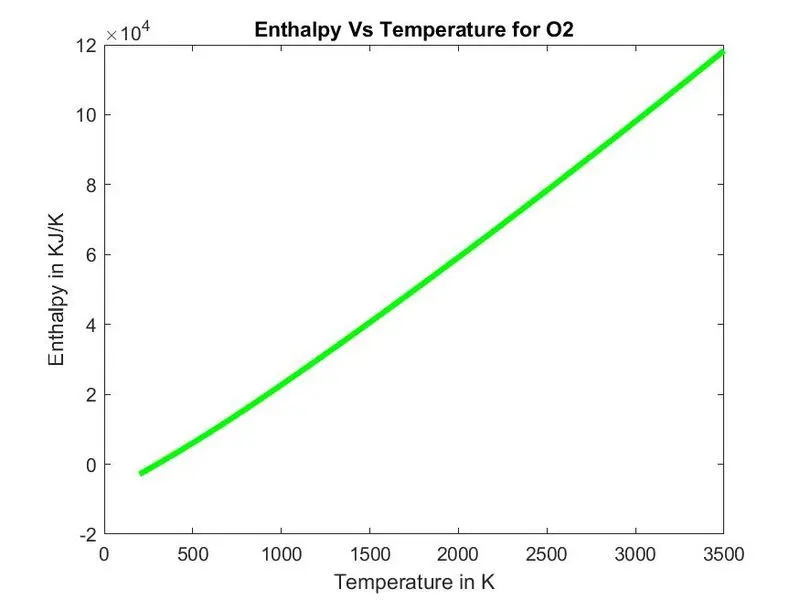
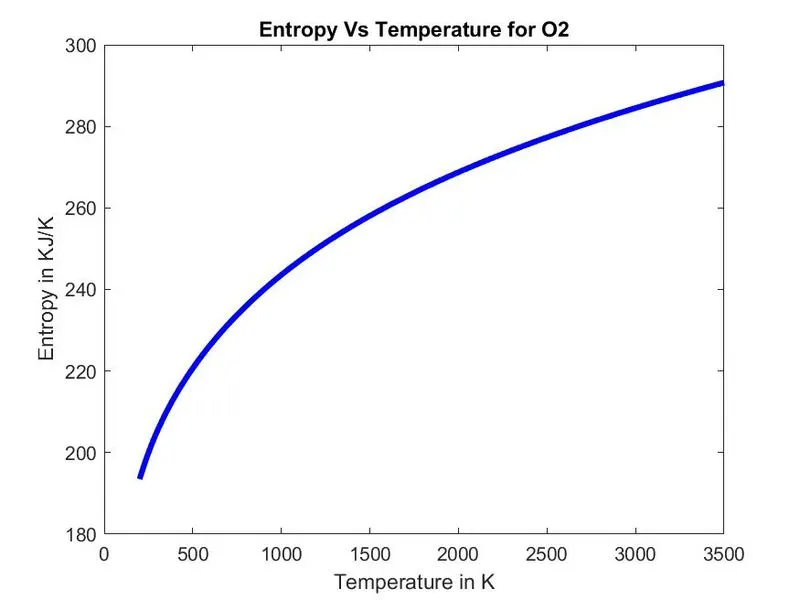
- Plots are generated for each species and stored in a new folder named according to species name with mkdir command.
Output:

- Display of molecular weights in command window
| ans = 'molecular weight of O = 16.000000' ans = 'molecular weight of O2 = 32.000000' ans = 'molecular weight of H = 1.000000' ans = 'molecular weight of H2 = 2.000000' ans = 'molecular weight of OH = 17.000000' ans = 'molecular weight of H2O = 18.000000' ans = 'molecular weight of HO2 = 33.000000' ans = 'molecular weight of H2O2 = 34.000000' ans = 'molecular weight of C = 12.000000' |
ans = |
ans = |
| ans = 'molecular weight of CH2CO = 42.000000' ans = 'molecular weight of HCCO = 41.000000' ans = 'molecular weight of HCCOH = 42.000000' ans = 'molecular weight of H2CN = 28.000000' ans = 'molecular weight of HCN = 27.000000' ans = 'molecular weight of HNO = 31.000000' ans = 'molecular weight of N = 14.000000' ans = 'molecular weight of NNH = 29.000000' ans = 'molecular weight of N2O = 44.000000' |
ans = 'molecular weight of NH = 15.000000' ans = 'molecular weight of NH2 = 16.000000' ans = 'molecular weight of NH3 = 17.000000' ans = 'molecular weight of NO = 30.000000' ans = 'molecular weight of NO2 = 46.000000' ans = 'molecular weight of HCNO = 43.000000' ans = 'molecular weight of HOCN = 43.000000' ans = 'molecular weight of HNCO = 43.000000' ans = 'molecular weight of NCO = 42.000000' |
ans = |
- Plots for O2 , N2 and CO2
 |
 |
 |
 |
 |
 |
 |
 |
 |
- No major errors except some typo errors have occured which are rectified immediately.
Conclusion:
- File parsing is sucessfully completed.
- Plots are generated and saved in seperate folders.
- Molecular weights are calculated for all species.
References: