Project 1 - Parsing NASA thermodynamic data
Aim
To write a function which extracts the co-efficients from the NASA thermodynamic data file and calculate the specific heat, enthalpy and entropy for all the species in the given thermodynamic file.
Objectives
- Calculation of Specific heat, Enthalpy and entropy for all species.
- Calculation of molecular weight for all species.
- Ploting the graph for Temperatures vs specific heat, Enthalpy , Entropy.
Formula
For Specific heat
`(Cp)/R = a1 + a2*T + a3.T^2 + a4.T^3 + a5.T^4`
For Enthalpy
`H/(RT) = a1 + (a2.T)/2 + (a3.T^2)/3 + (a4.T^3)/4 + (a5.T^4)/5 + (a6)/T`
For Entropy
`S/R = a1.lnT + a2.T + a3.T^2 + (a4.T^3)/3 + (a5.T^4)/4 + a7`
Procedure
Specific heat
The specific heat is the amount of heat per unit mass required to raise the temperature by one degree Celsius. The relationship between heat and temperature change is usually expressed in the form shown below where c is the specific heat. The relationship does not apply if a phase change is encountered, because the heat added or removed during a phase change does not change the temperature.
Enthalpy
It is a property of a thermodynamic system, defined as the sum of the system's internal energy and the product of its pressure and volume. It is a convenient state functiom standardly used in many measurements in chemical, biological, and physical systems at a constant pressure. The pressure-volume term expresses the work required to establish the system's physical dimensions, i.e. to make room for it by displacing its surroundings. As a state function, enthalpy depends only on the final configuration of internal energy, pressure, and volume, not on the path taken to achieve it.
Entropy
The entropy of an object is a measure of the amount of energy which is unavailable to do work. Entropy is also a measure of the number of possible arrangements the atoms in a system can have. In this sense, entropy is a measure of uncertainty or randomness. The higher the entropy of an object, the more uncertain we are about the states of the atoms making up that object because there are more states to decide from. A law of physics says that it takes work to make the entropy of an object or system smaller; without work, entropy can never become smaller – you could say that everything slowly goes to disorder (higher entropy).
Molecular Weight
The sum of the atomic masses of all atoms in a molecule, based on a scale in which the atomic masses of hydrogen, carbon, nitrogen, and oxygen are 1, 12, 14, and 16, respectively. For example, the molecular weight of water, which has two atoms of hydrogen and one atom of oxygen, is 18 (i.e., 2 + 16). Also called molecular mass.
Main code
clear all
close all
clc

% Loading and reading the file
file = fopen('THERMO.dat', 'r');
fgetl(file);

% Getting global temperatures
Global_temperature = str2num(fgetl(file));
Global_low_temperatute = Global_temperature(1);
Global_mid_temperatute = Global_temperature(2);
Global_high_temperatute = Global_temperature(3);

% Skipping the unwanted lines
for i = 1:3
    fgetl(file);
end

for i = 1:53

    % saving the first line in a variable
    first_line = fgetl(file);
    % Split the line for getting individual values
    line_split = strsplit(first_line, '  ');
    line_place = length(line_split);
    species = line_split{1};

    % Getting local temperatures
    local_low_temperature = str2double(line_split(line_place-3));
    local_high_temperature = str2double(line_split(line_place-2));
    local_medium_temperature = str2double(line_split(line_place-1));

    % saving the second line in a variable
    second_line = fgetl(file);
    % Getting the position of E for finding individual coefficients in
    % second line
    x = strfind(second_line,'E');
    % Getting the individual coefficient from second line
    a1 = str2double(second_line(1:(x(1)+3)));
    a2 = str2double(second_line((x(1)+4):(x(2)+3)));
    a3 = str2double(second_line((x(2)+4):(x(3)+3)));
    a4 = str2double(second_line((x(3)+4):(x(4)+3)));
    a5 = str2double(second_line((x(4)+4):(x(5)+3)));

    % saving the third line in a variable
    third_line = fgetl(file);
    % Getting the position of E for finding individual coefficients in
    % third line
    y = strfind(third_line,'E');
    % Getting the individual coefficient from third line
    a6 = str2double(third_line(1:(y(1)+3)));
    a7 = str2double(third_line((y(1)+4):(y(2)+3)));
    a8 = str2double(third_line((y(2)+4):(y(3)+3)));
    a9 = str2double(third_line((y(3)+4):(y(4)+3)));
    a10 = str2double(third_line((y(4)+4):(y(5)+3)));

    % saving the fourth line in a variable
    fourth_line = fgetl(file);
    % Getting the position of E for finding individual coefficients in
    % fourth line
    z = strfind(fourth_line,'E');
    % Getting the individual coefficient from fourth line
    a11 = str2double(fourth_line(1:(z(1)+3)));
    a12 = str2double(fourth_line((z(1)+4):(z(2)+3)));
    a13 = str2double(fourth_line((z(2)+4):(z(3)+3)));
    a14 = str2double(fourth_line((z(3)+4):(z(4)+3)));

    % Getting the various temperature value
    low_temperature = linspace(local_low_temperature,local_medium_temperature,100);
    high_temperature = linspace(local_medium_temperature,local_high_temperature,100);
    % Universal gas constant
    R = 8.314;


    for m = 1:100
        % Calculation of Specific heat(Cp_1), Enthalpy(H_1), Entropy(S_1) at low
        % temperatures
        Cp_1(m) = (a8 + (a9*low_temperature(m)) + a10*(low_temperature(m)^2) + a11*(low_temperature(m)^3) + a12*(low_temperature(m)^4))*R;
        H_1(m) = (a8 + (a9*low_temperature(m))/2 + (a10*low_temperature(m)^2)/3 + (a11*low_temperature(m)^3)/4 + (a12*low_temperature(m)^4)/5 + (a13/low_temperature(m)))*(R*low_temperature(m));
        S_1(m) = (a8*log(low_temperature(m)) + a9*low_temperature(m) + (a10*low_temperature(m)^2/2) + (a11*low_temperature(m)^3/3) + (a12*low_temperature(m)^4/4) + a14)*R;
        % Calculation of Specific heat(Cp_2), Enthalpy(H_2), Entropy(S_2) at high
        % temperatures
        Cp_2(m) = (a1 + a2*(high_temperature(m)) + a3*(high_temperature(m)^2) + a4*(high_temperature(m)^3) + a5*(high_temperature(m)^4))*R;
        H_2(m) = (a1 + (a2*high_temperature(m))/2 + (a3*high_temperature(m)^2)/3 + (a4*high_temperature(m)^3)/4 + (a5*high_temperature(m)^4)/5 + (a6/high_temperature(m)))*(R*high_temperature(m));
        S_2(m) = (a1*log(high_temperature(m)) + a2*high_temperature(m) + (a3*high_temperature(m)^2/2) + (a4*high_temperature(m)^3/3) + (a5*high_temperature(m)^4/4) + a7)*R;
    end

    % Creating a folder
    mkdir(species);
    current = pwd;
    cd(species)

    % Plotting the graph for Variable temperatures Vs Specific heat
    figure(1)
    plot(low_temperature,Cp_1,'linewidth',3,'color','b')
    hold on
    plot(high_temperature,Cp_2,'linewidth',3,'color','r')
    hold off
    grid on
    xlabel('Variable Temperatures in K')
    ylabel('Specific Heat (J/mol.K)')
    legend('Low Temperature', 'High Temperature')
    title(['Temperature Vs Specific heat for ', species])
    fig = sprintf('cp of %s.png', species);
    saveas(gca, fig);

    % Plotting the graph for Variable temperatures Vs Enthalpy
    figure(2)
    plot(low_temperature, H_1,'linewidth',3,'color','b')
    hold on
    plot(high_temperature,H_2,'linewidth',3,'color','r')
    hold off
    grid on
    xlabel('Variable Temperatures in K')
    ylabel('Enthalpy (J)')
    legend('Low Temperature', 'High Temperature')
    title(['Temperature Vs Enthalpy for ', species])
    fig = sprintf('h of %s.png', species);
    saveas(gca, fig);

    % Plotting the graph for Variable temperatures Vs Entropy
    figure(3)
    plot(low_temperature,S_1,'linewidth',3,'color','b')
    hold on
    plot(high_temperature,S_2,'linewidth',3,'color','r')
    hold off
    grid on
    xlabel('Variable Temperatures in K')
    ylabel('Entropy (J/K')
    legend('Low Temperature', 'High Temperature')
    title(['Temperature Vs Entropy for ', species])
    fig = sprintf('s of %s.png', species);
    saveas(gca, fig);
    cd(current)

    % Calculation of molecular weight of different species
    molw = mol_weights(species);
    k = sprintf('molecular weight of %s is %f', species, molw);
    disp(k)
end
Explanation
This operation is done by the program language MATLAB.
Open Matlab software and start to type the command.
Write clear all, close all and clc command to clear previous command and close previous figure windows.
First load the thermodynamic file which was given and read it by using fopen command.
Skip the first line using fgetl command hence it is not used in this program.
Store the values of next line as global temperratures.
Separate the values as low mid and hig temperature and convert them into a number by sing str2num command.
Hence the next three lines are comments skip those line by using fgetl command in a for loop.
The next four lines are stored as first_line second_line third_line and fourth_line by using fgetl command.
The first line gives the name of species and values of local temperatures to that specific species.
Inorder to obtain those values split the entire lines into different section using strsplit command.
And now store the species name and local temperature in variable from the line in the file.
Use str2double command to convert the local temperatures into numerical value.
The second_line, third_line and fourth_line contains the coefficients for finding specific heat, enthalpy and entropy.
Inorder to get the coefficient we need to find the position of E from the line in to obtain single value of co-efficients.
To find position of E use strfind command to locate it.
Once values of co-efficients are obtained use sre2double command to convert them into a number and then stored in the variable a1-a14 by using same process.
By using linspace get variable local temperature values.
With the help of the above formula find the variable values of specific heat, Enthalpy and entropy with different temperatures.
Plot the graph between variable Temperatures with Specific heat, Enthalpy and entropy.
Save the graph as image format and store it in a desired location.
Create a folder and store it in the same directory using cd and mkdir command.
With the help of funtion mol_weights the molecular weights of all species can be calculated.
Repeat the process for all species one by one by using for loop.
Function to calculate Molecular weight
function M = mol_weights(species)

speciess = species;
atom = [ 'H', 'C', 'N', 'O', 'A' ];
atm_weight = [1 12 14 16 40 ];
M = 0;

for i = 1:length(speciess)
    for j = 1:length(atom)
        if strcmp(speciess(i),atom(j))
            M = M + atm_weight(j);
            X = j;
        end
    end
    n = str2num(speciess(i));
    if n>1
        M = M+(atm_weight(X)*(n-1));
    end
end
end
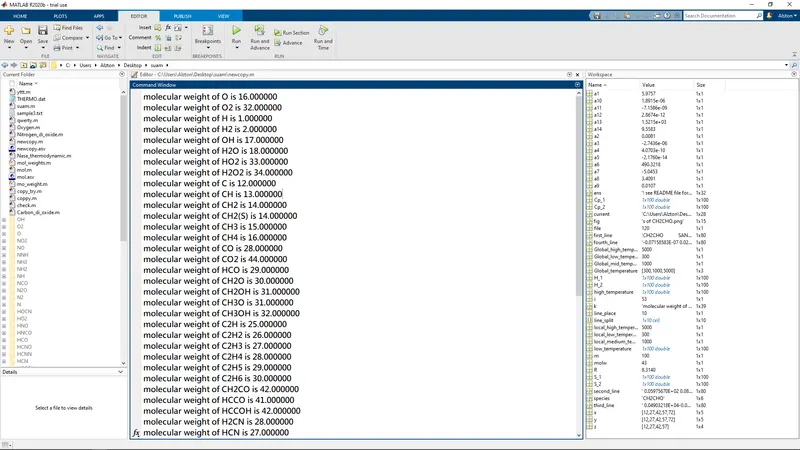
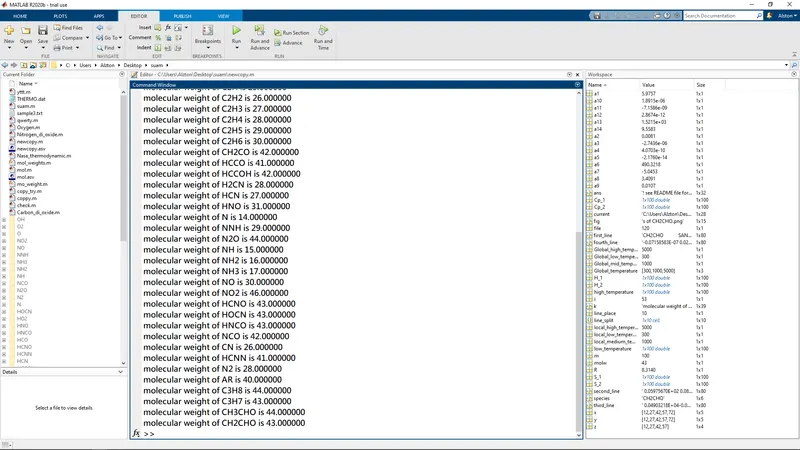
Molecular weight for all species
Window where all the folders are saved

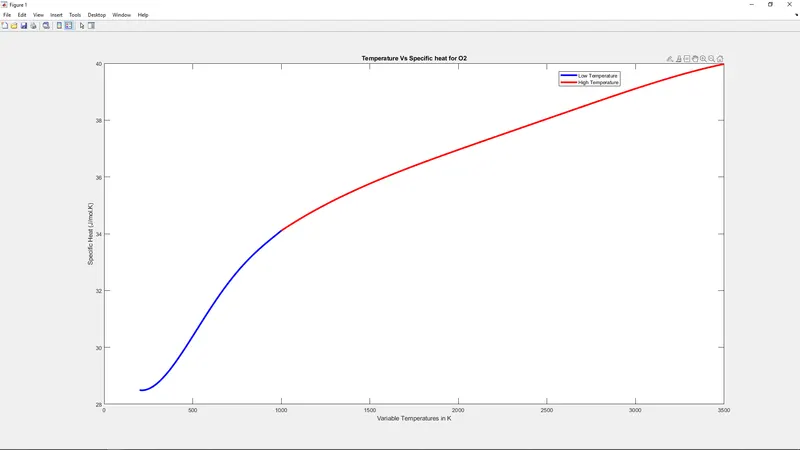
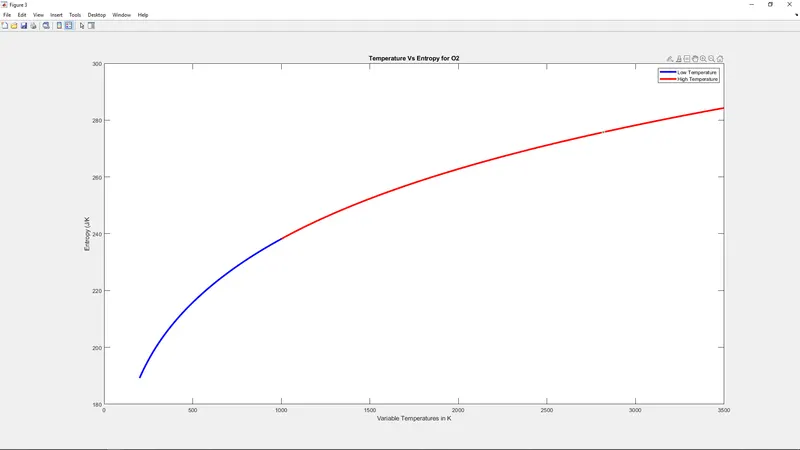
Ploting the graph for Temperatute vs Specific heat of O2
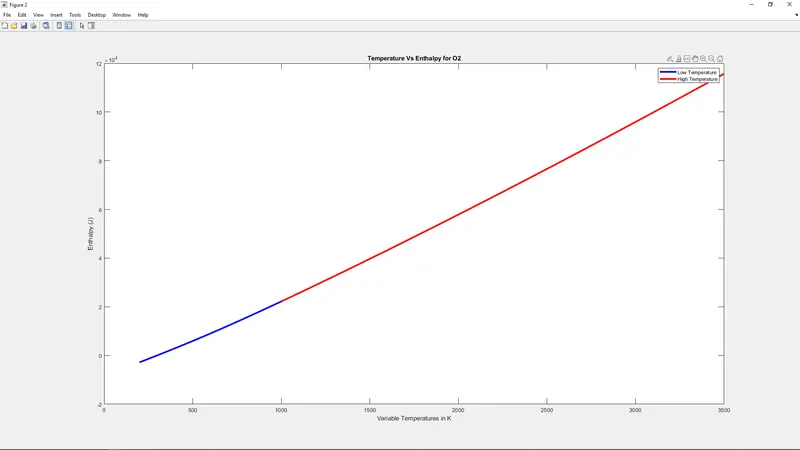
Ploting the graph for Temperatute vs Enthalpy of O2
Ploting the graph for Temperatute vs Entropy of O2
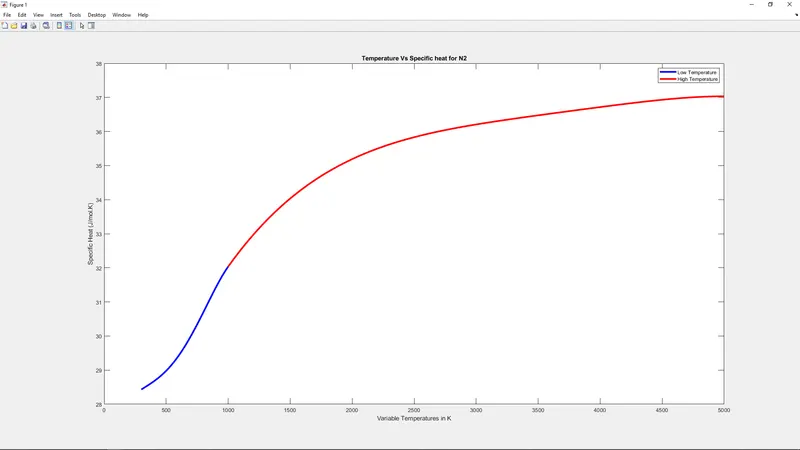
Ploting the graph for Temperatute vs Specific heat of N2
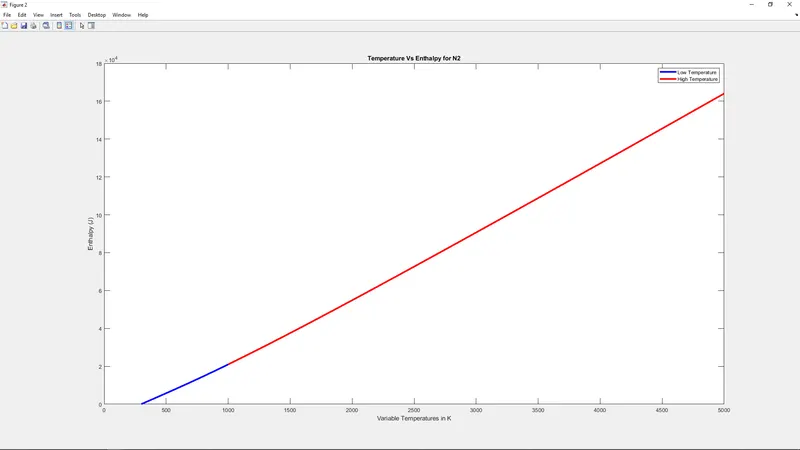
Ploting the graph for Temperatute vs Enthalpy of N2
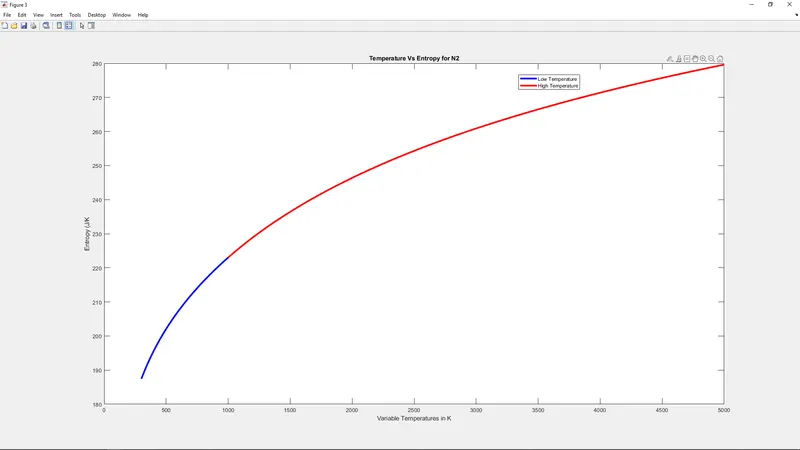
Ploting the graph for Temperatute vs Entropy of N2
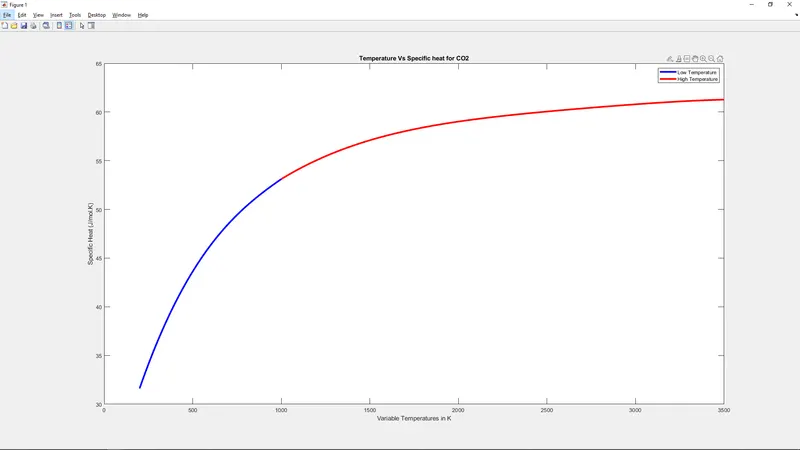
Ploting the graph for Temperatute vs Specific heat of CO2
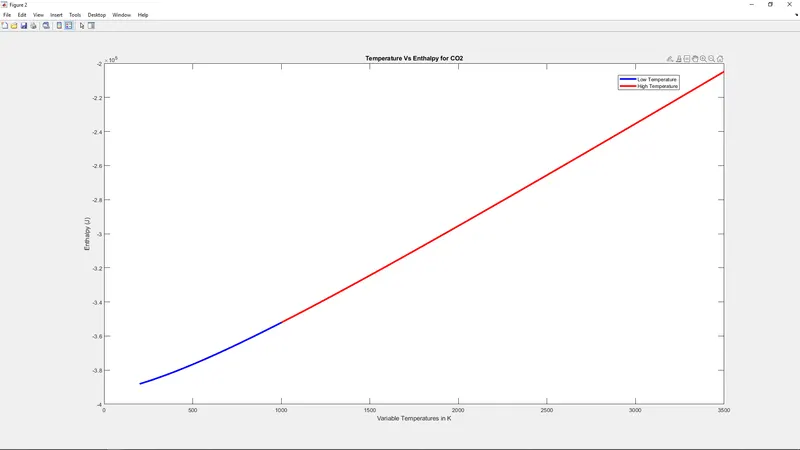
Ploting the graph for Temperatute vs Enthalpy of CO2
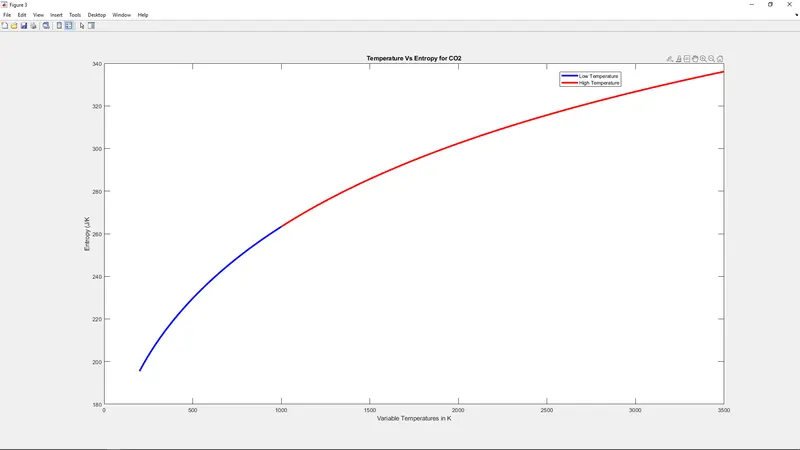
Ploting the graph for Temperatute vs Entropy of CO2
Errors faced
I forgot to add bracket in the code
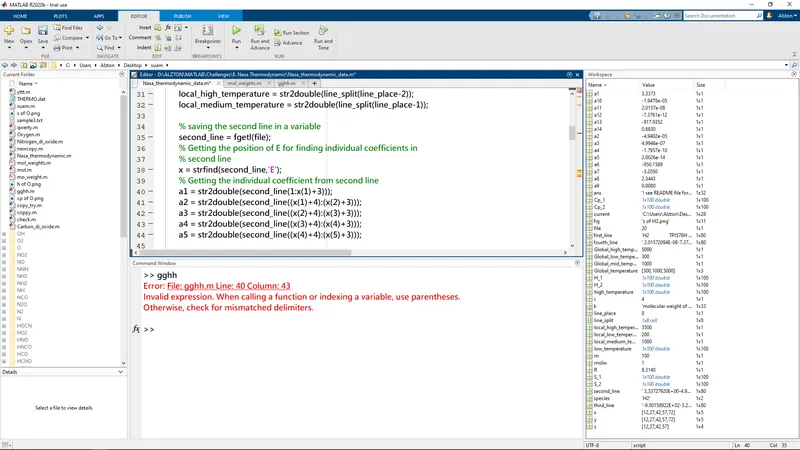
I fixed by adding the bracket in it.
The graph intercollide with itself for all species
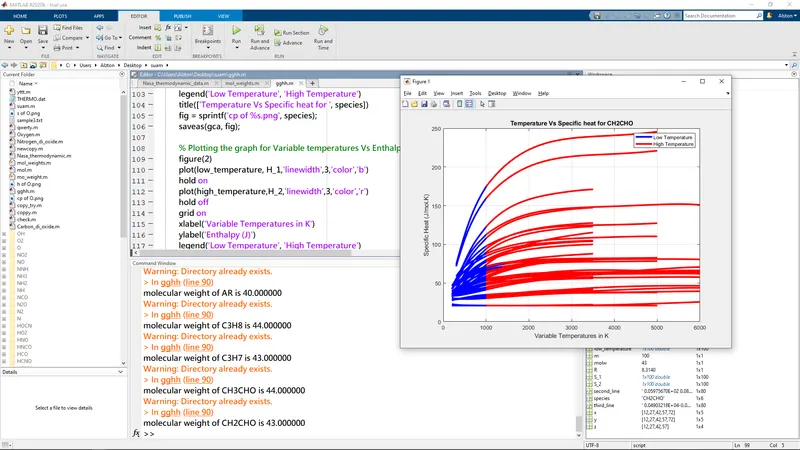
Inorder to overcome this error i used hold off command to separate the graph for individual species.
Conclusion
The values for Specific heat, Enthalpy and entropy for all species were calculated.
The values for molecular weight for all species were calculated and displayed in the command window.
The graph of Temperatures vs specific heat, Enthalpy , Entropy for all species were plotted and the folders which they are stored are shown above.
The graph for Temperatures vs specific heat, Enthalpy , Entropy for species O2, N2, CO2 were shown above.
References
Link to the folder
Google drive Images of Temperature vs (Specific heat, Enthalpy, Entropy)