Project 1 - Parsing NASA thermodynamic data
Aim: - To parse NASA’s thermo.dat file and extract the data so as to calculate thermodynamic properties of given elements.
Objective: -A. To extract the name and respective coefficients to calculate
- Molecular weight of each element
- Heat capacity at constant pressure
- Enthalpy
- Entropy
B.To plot the graph between the heat capacity, entropy, enthalpy individually with respect to temperature and to store the data in the directory.
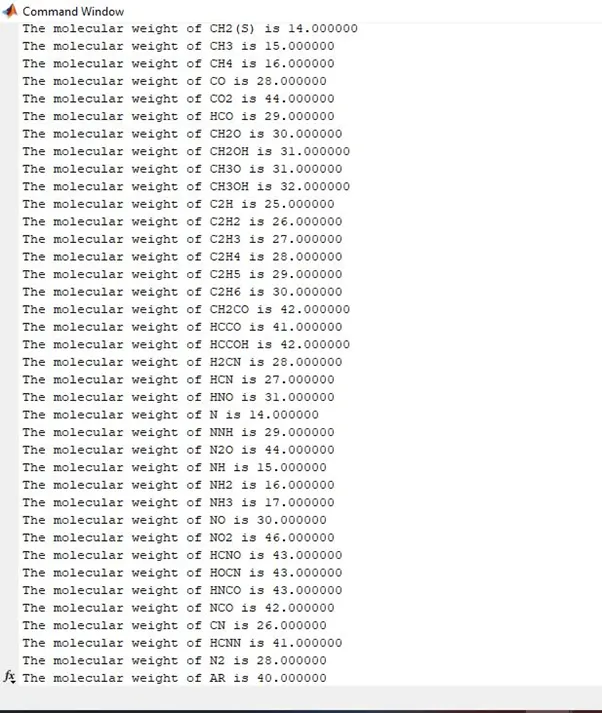
C.to show the molecular weight of the elements on the command screen
Theory: -
File Parsing: It means to read the data and to break it down to its component part so as the data can be manipulated as required and transformed. It is to computers what reading to human.
NASA came up with polynomials that can be used to evaluate thermodynamic properties such as Cp, H and S. They have also documented the coefficients that are required to evaluate these polynomials for 1000+ species.
There are 14 coefficients of the polynomial where 1st 7 are for high temperature and the rest are for higher temperature.
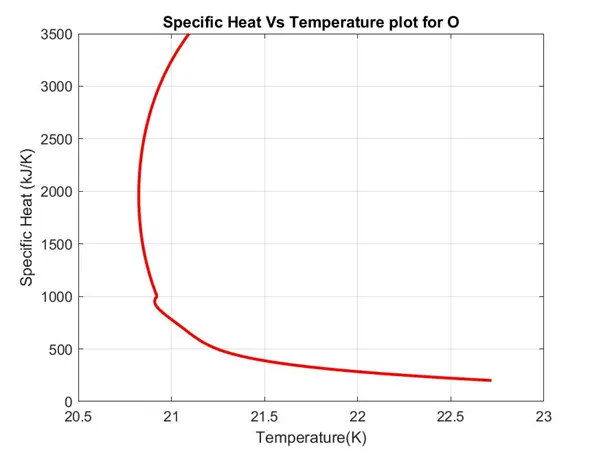
Specific Heat (Cp): Specific Heat capacity is the amount of heat to be supplied to (or taken out of) the unit mass of a system in order to increase (or decrease) its temperature by one degree in a thermodynamic process. Its unit is KJ/Kg-k
Formula involving the coefficients in the data:
`(Cp)/R=a1+a2 T+a3 T^2+a4 T^3+a5 T^4`
Where R is gas constant, T is temperature and a1, a2, a3, a4 and a5 are coefficients.
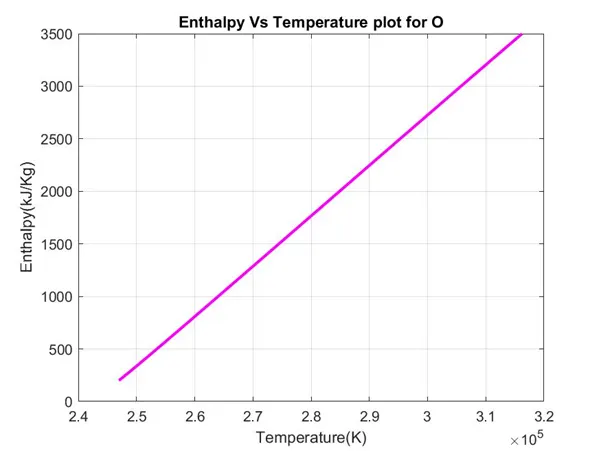
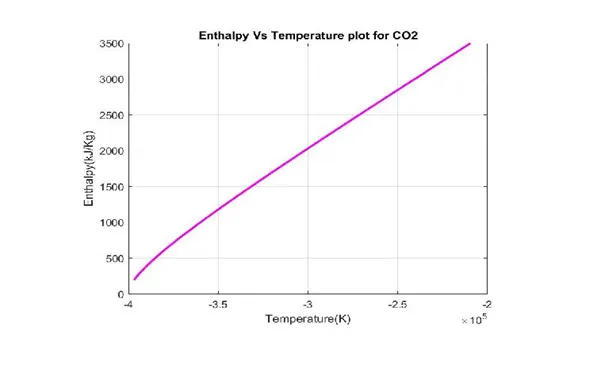
Enthalpy (H): It is defined as sum of internal energy and product of pressure and volume. It tells us how much heat or work is added or removed from the system. Its unit is K-Joule.
Formula involving the coefficients in the data:
`H/(RT)=a1+a2 T/2+a3 T^2/3+a4 T^3/4+a5 T^4/5+a6 1/T`
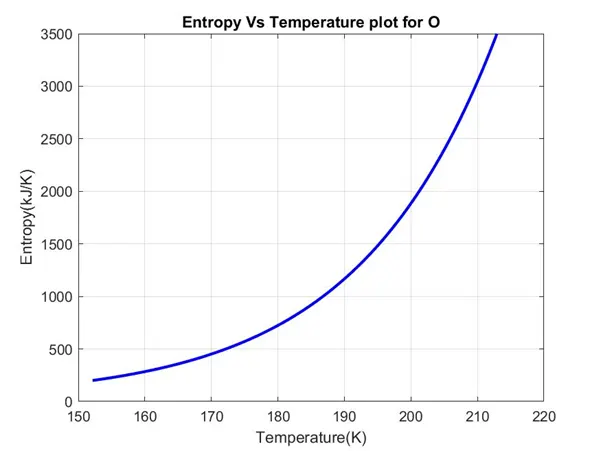
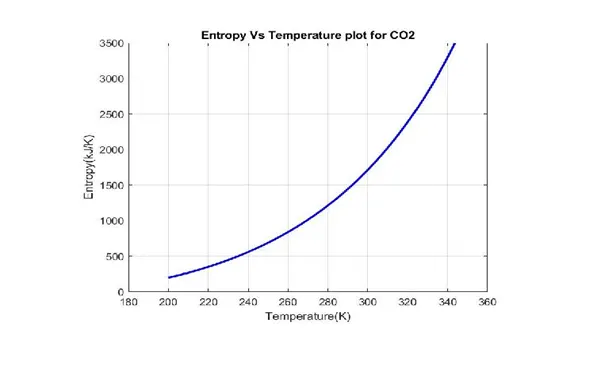
Entropy (S): It is defined as measure of degree of randomness. Entropy is the measure of a systems thermal energy per unit temperature that is unavailable for doing useful work.
Formula involving the coefficients in the data:
`S/R=a1 lnT+a2 T+a3 T^2/2+a4 T^3/3+a5 T^4/4+a7`
MATLAB Code: - The main body of the code is accompanied with 6 user defined function each used for a certain purpose .
The main body:
clear all
close all
clc
%opening the thermo file
f1=fopen('THERMO.dat');
fgetl(f1);
%taking 2nd line and storing the global temperatures
t=fgetl(f1);
temp=strsplit(t,' ');
g_lowtemp = str2num(temp{1});
g_midtemp = str2num(temp{2});
g_hightemp = str2num(temp{3});
global_temp=[g_lowtemp,g_midtemp,g_hightemp];
clear t temp ans;
%skipping 3 lines
for i=1:3
 s= fgetl(f1);
end
%counting no. of lines as to get the no. of elements
ct=0;
while (strcmp(s,'END')==0)
    s = fgetl(f1);
    ct=ct+1;
end
species_ct=(ct-1)/4;%no of elements
frewind(f1)     % positioning the pointer to the begning of file
for i=1:5
    s=fgetl(f1);
end
%%extracting coefficients
R=8.314;
for i=1:species_ct
    s=fgetl(f1);
    t=strsplit(s,' ');% spliting the line into cell array
    species_name=(t{1}); %storing the first element as name

    l_lowtemp=str2double(t{end-3}); % storing other elements as local temperature
    l_hightemp=str2double(t{end-2});
    l_midtemp=str2double(t{end-1});
    local_temp=[l_lowtemp,l_midtemp,l_hightemp];

    s=fgetl(f1); %getting the 2nd data line
    pos=strfind(s,'E'); %finding the position of e

    %storing the coefficients of 2nd line
    a1=str2double(s(1:pos(1)+3));
    a2=str2double(s(pos(1)+4:pos(2)+3));
    a3=str2double(s(pos(2)+4:pos(3)+3));
    a4=str2double(s(pos(3)+4:pos(4)+3));
    a5=str2double(s(pos(4)+4:pos(5)+3));

    %storing the coefficients of 3rd line
    s=fgetl(f1);
    pos=strfind(s,'E');

    a6=str2double(s(1:pos(1)+3));
    a7=str2double(s(pos(1)+4:pos(2)+3));
    a8=str2double(s(pos(2)+4:pos(3)+3));
    a9=str2double(s(pos(3)+4:pos(4)+3));
    a10=str2double(s(pos(4)+4:pos(5)+3));

    %storing the coefficients of 4th line
    s=fgetl(f1);
    pos=strfind(s,'E');

    a11=str2double(s(1:pos(1)+3));
    a12=str2double(s(pos(1)+4:pos(2)+3));
    a13=str2double(s(pos(2)+4:pos(3)+3));
    a14=str2double(s(pos(3)+4:pos(4)+3));
    clear pos s t;

    %storing the coefficients as an array
    coeff=[a1,a2,a3,a4,a5,a6,a7,a8,a9,a10,a11,a12,a13,a14];

    %creating a data variable table and storing different variable to be calculate of each element
    data(i).Name=species_name;
    data(i).local_temp=[l_lowtemp,l_midtemp,l_hightemp];
    data(i).global_temp=[g_lowtemp,g_midtemp,g_hightemp];
    data(i).coeff=coeff;

    cp=cpcalc(coeff,local_temp,R);
    data(i).cp=cp;
    t=linspace(l_lowtemp,l_hightemp,200);
    data(i).temperature=t;

    M = m_wtcalc(species_name);
    data(i).M_weight= M;
    str= fprintf('\nThe molecular weight of %s is %f',species_name, M );
    %% plotting the specific heat vs temperature
    figure((4*i)-3)
    p1=plot(cp,t,'linewidth',2,'color','r');
    xlabel('Temperature(K)')
    ylabel('Specific Heat (kJ/K)')
    title(sprintf('Specific Heat Vs Temperature plot for %s',species_name))
    grid on

    H=enthalpy_calc(coeff,local_temp,R);
    data(i).Enthalpy=H;

    %plotting enthalpy vs temperature
    figure((4*i)-2)
    p2=plot(H,t,'linewidth',2,'color','m');
    xlabel('Temperature(K)')
    ylabel('Enthalpy(kJ/Kg)')
    title(sprintf('Enthalpy Vs Temperature plot for %s',species_name))
    grid on

    S = entropy_calc(coeff,local_temp,R);
    data(i).Entropy=S;

    %plotting Entropy vs temperature
    figure((4*i)-1)
    p3=plot(S,t,'linewidth',2,'color','b');
    xlabel('Temperature(K)')
    ylabel('Entropy(kJ/K)')
    title(sprintf('Entropy Vs Temperature plot for %s',species_name))
    grid on

    %plotting combining plots
    figure(4*i);
    p4=supl(data,i);


    %saving and storing the files in the D directory
    n=data(i).Name;
    mkdir('D:\skilllync\projects\parsing',n)
    folder = 'D:\skilllync\projects\parsing';
    plot_1 = fullfile(folder,n,'Specific_Heat_vs_Temperature_Plot.jpg');
    plot_2 = fullfile(folder,n,'Enthalpy_vs_Temperature_Plot.jpg');
    plot_3 = fullfile(folder,n,'Entropy_vs_Temperature_Plot.jpg');
    plot_4 = fullfile(folder,n,'combined_Plot.jpg');

    saveas(figure((4*i)-3),plot_1)
    saveas(figure((4*i)-2),plot_2)
    saveas(figure((4*i)-1),plot_3)
    saveas(figure(4*i),plot_4)


end
fclose(f1);
%%calling the show case of saved data
data_plot_showcase(data);
steps involved in the program
- The data file is open using fopen and lines are extracted using fgetl command.
- The 2nd line contains the global temp. extracted by fgetl and splited by strsplit command and stored in appropriate variable
- Then counting the number of lines from 5th line till “End” keyword is found then dividing the count by 4 after extracting 1 since line made by End word and each element has 4 line dedicated to it. The number of elements found out to be 53.
- Getting the file pointer to begning by frewind command, and againg skipping first 5 lines
- Running the loop for 53 times and each line is extracted by fgetl . Then first line is broken by the spaces between then and first broken string is stored in name of the element, and last 3 are stored as local temperature
- From 2nd to 4th line position of “E” is found and with reference with it the numbers are grouped to form the coefficient and stored appropriately.
- Then the appropriate function was called to calculate the properties one by one and plotted simultaneously.
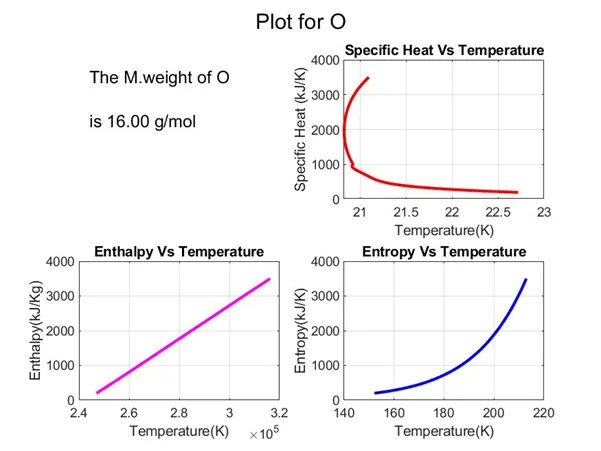
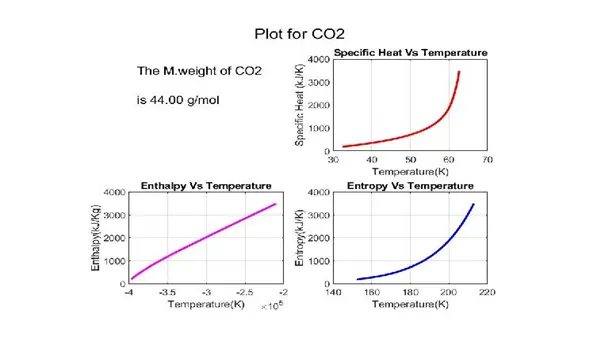
- A combined plot is also made to show all the data calculate al together.
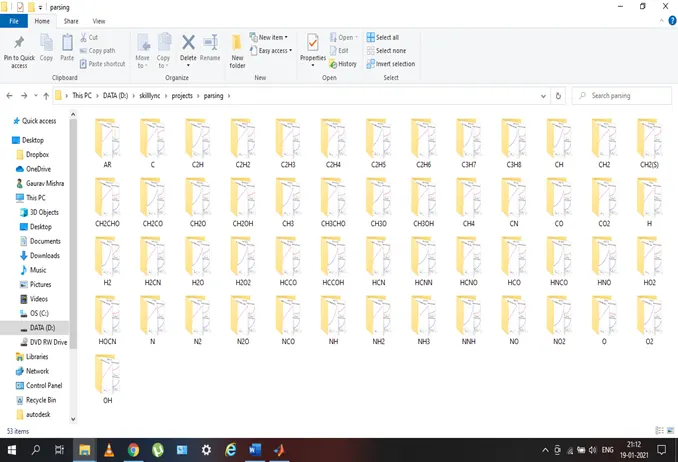
- A directory is opend in D drive to save the plots using mkdir command
- The name of file is givens by fullfile command and plots were saved in it using saveas command.
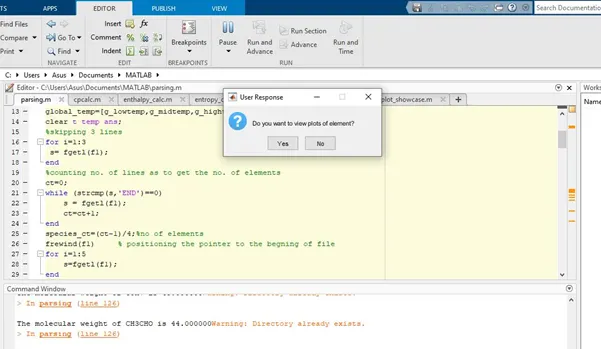
- A data plot showcase is also called if the user is interested to view the plot of his choice.
A.Function to calculate the specific heat:
function [cp]=cpcalc(coeff,local_temp,R)
%defining the temperature range
llt=local_temp(1);
lmt=local_temp(2);
lht=local_temp(3);
t=linspace(llt,lht,200);
a=coeff;          %storing coefficient in a


for k = 1:length(t)
    %checking if temperature is on the higher side or lower so as to use
    %coefficien accordingily
    if t(k)<lmt
        cp(k)=(a(8)+a(9)*t(k)+a(10)*t(k)^2+a(11)*t(k)^3+a(12)*t(k)^4)*R;
    else
        cp(k)=(a(1)+a(2)*t(k)+a(3)*t(k)^2+a(4)*t(k)^3+a(5)*t(k)^4)*R;
    end


end

end
B.Function to calculate the enthalpy:
function [H]=enthalpy_calc(coeff,local_temp,R)

llt=local_temp(1);
lmt=local_temp(2);
lht=local_temp(3);
t=linspace(llt,lht,200);
a=coeff;


for k = 1:length(t)
    %checking if temperature is on the higher side or lower so as to use
    %coefficien accordingily
    if t(k)<lmt
        H(k)=(a(8)+a(9)*t(k)/2+a(10)*(t(k)^2)/3+a(11)*(t(k)^3)/4+a(12)*(t(k)^4)/5+a(13)/t(k))*R*t(k);
    else
        H(k)=(a(1)+a(2)*t(k)/2+a(3)*(t(k)^2)/3+a(4)*(t(k)^3)/4+a(5)*(t(k)^4)/5+a(6)/t(k))*R*t(k);
    end


end

end
C.Function to calculate the entropy:
function [S]=entropy_calc(coeff,local_temp,R)

llt=local_temp(1);
lmt=local_temp(2);
lht=local_temp(3);
t=linspace(llt,lht,200);
a=coeff;


for k = 1:length(t)
    %checking if temperature is on the higher side or lower so as to use
    %coefficien accordingily
    if t(k)<lmt
        S(k)=(a(8)*log(t(k))+a(9)*t(k)+a(10)*(t(k)^2)/2+a(11)*(t(k)^3)/3+a(12)*(t(k)^4)/4+a(14))*R;
    else
        S(k)=(a(1)*log(t(k))+a(2)*t(k)+a(3)*(t(k)^2)/2+a(4)*(t(k)^3)/3+a(5)*(t(k)^4)/4+a(7))*R;
    end


end

end
D.Function to calculate molecular weight:
function M=m_wtcalc(species_name)
%creating a string array for single element compound present alone or
%combined in the data
n=['H','C','N','O'];
%creating a numerical array of atomic weight in the same order as the string array
wt=[1,12,14,16];
name=species_name;
M=0;
%for Argon directly giving its atomic weightas it's symbol as two char combined
if strcmp(name,'AR')==1
    M=M+40;
end

for i=1:length(name)
    for j=1:length(n)
        %comparing element names and string array char by char and
        %recording the position in the string array
        if strcmp(name(i),n(j))==1
        M = M + wt(j);
        p = j;

        end
    end
    % if a numeric value comes up as char then it is checked and
    % accordingly used to determine the atomic weight
    nu=str2num(name(i));
    if (nu>1)
     M = M + wt(p)*(nu-1);
    end
end

end
E.Function to make combined plots:
function spl=supl(data,i)

    name=data(i).Name;
    t=data(i).temperature;
    cp=data(i).cp;
    h=data(i).Enthalpy;
    s=data.Entropy;
    m=data(i).M_weight;

   % writing M_wt on the empty region of the subplot
    ax=subplot(2,2,1);
    sgtitle(sprintf('Plot for %s',name))
    text(.05,.725,sprintf('The M.weight of %s \n\nis %.2f g/mol',name, m ),'fontsize',12);
    set(ax,'visible','off')

    %plotting specific heat vs temperature
    subplot(2,2,2)
    plot(cp,t,'linewidth',2,'color','r');
    xlabel('Temperature(K)')
    ylabel('Specific Heat (kJ/K)')
    title('Specific Heat Vs Temperature')
    grid on

   %plotting Enthalpy vs temperature
    subplot(2,2,3)
    plot(h,t,'linewidth',2,'color','m');
    xlabel('Temperature(K)')
    ylabel('Enthalpy(kJ/Kg)')
    title('Enthalpy Vs Temperature')
    grid on

    %plotting Entropy vs temperature
    subplot(2,2,4)
    plot(s,t,'linewidth',2,'color','b');
    xlabel('Temperature(K)')
    ylabel('Entropy(kJ/K)')
    title('Entropy Vs Temperature')
    grid on
    spl=ax;
end
F.Function to make plot showcase:
function []=data_plot_showcase(data)

sname={data.Name};
%asking question from the user using question dialog box
ans=questdlg('Do you want to view plots of element?','User Response','Yes','No','No') ;
cntrl=0;
 while cntrl==0;
     switch ans
          %cases for the answer from the question dialog
         case 'Yes'
             %entering the list of element in the data
          [indx,tf]=listdlg('PromptString',{'Select the Element'},'SelectionMode','single', 'ListString',sname);
               if tf ==1;
                 if indx~=0
                     %show the file for element index chosen by user
                      name=data(indx).Name;
                      path='D:\skilllync\projects\parsing';

                      file1 = fullfile(path,name,'combined_Plot.jpg');
                      img1 = imread(file1);
                      figure (213);
                      imshow(img1)

                      file2 = fullfile(path,name,'Enthalpy_vs_Temperature_Plot.jpg');
                      img2 = imread(file2);
                      figure (214);
                      imshow(img2)

                      file3 = fullfile(path,name,'Entropy_vs_Temperature_Plot.jpg');
                      img3 = imread(file3);
                      figure (215);
                      imshow(img3)

                      file4 = fullfile(path,name,'Specific_Heat_vs_Temperature_Plot.jpg');
                      img4 = imread(file4);
                      figure (216);
                      imshow(img4)

                      %askinf if user wants to view again

                      ans=questdlg('Do you want to view plots of element?','User Response','Yes','No','No');


              end

             end
                      if tf==0;
                          cntrl=1;

                          break;

                      end


           case 'No'
                cntrl=1;
                break;

     end
 end
end
Results: -
Molecular weight displayed on command window:
Specific heat, Enthalpy, Entropy and combined plot of element ‘O’:
Screenshot of the directory where the files are stored
Screenshot of data_plot_showcase:
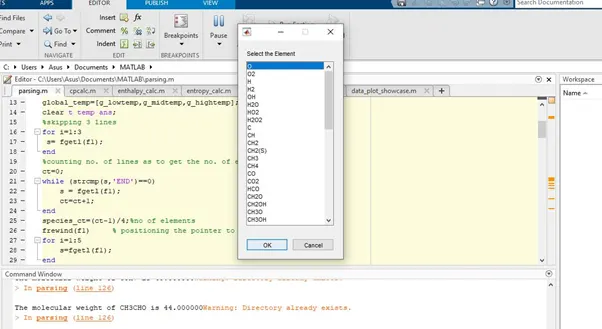
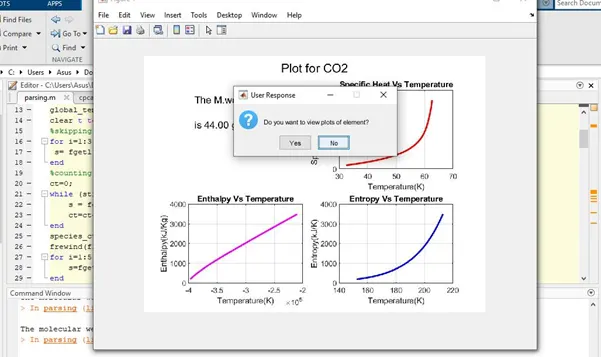
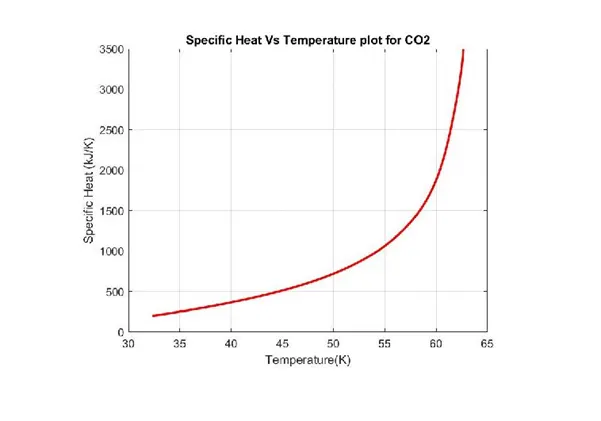
When asked for CO2 plot from the list following are the output:
Conclusion: - The NASA’s ‘THERMO.dat’ file is parsed and all the useful coefficient and values are extracted and used to calculate different thermodynamic properties and to represent it through plots.
Refferences:-
1.https://in.mathworks.com/matlabcentral/answers/317006-create-new-folders-by-mkdir
2.MATLAB help
3.Google