Project 1 - Parsing NASA thermodynamic data
AIM:
To write a code in matlab to file parsing for NASA thermodynamics data file and then calculate thermodynamics properties of various gas speices.
Objectives:
. Write a function that extracts the 14 co-efficients and calculates the enthalpy, entropy and specific heats for all the species in the data file.
You will be reading this file NASA thermodynamics data(use fopen and fgetl)
. Here R is the universal gas constant, T is the temeprature
. The main program that you will submit will just take the "THERMO.dat" file as an input and generate Cp, H and S plots.
. The first 7 coefficients are high-temperature coefficients and the second 7 coefficients are low-temperature coefficients.
use the local temperatures range which is unique for each individual species, not the global temperature range
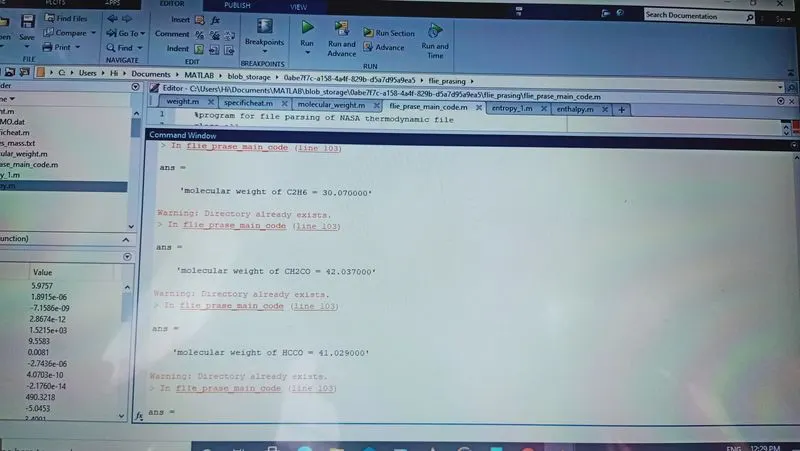
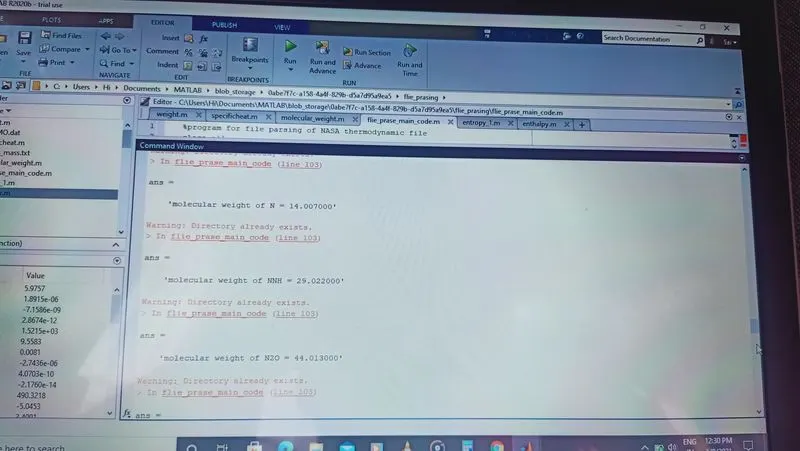
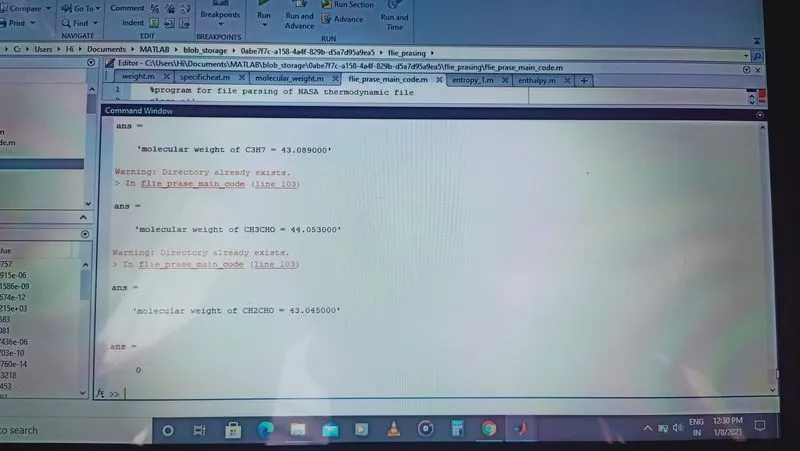
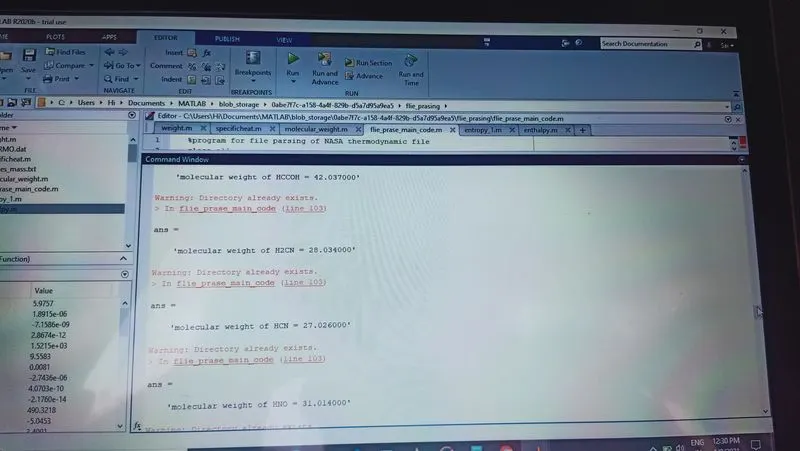
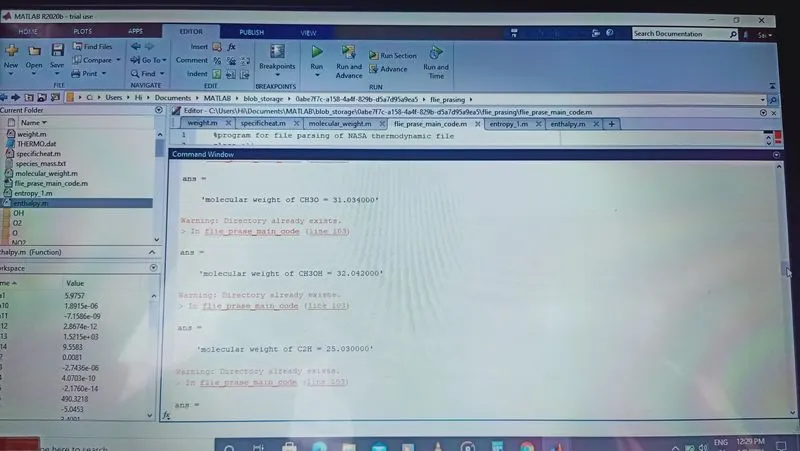
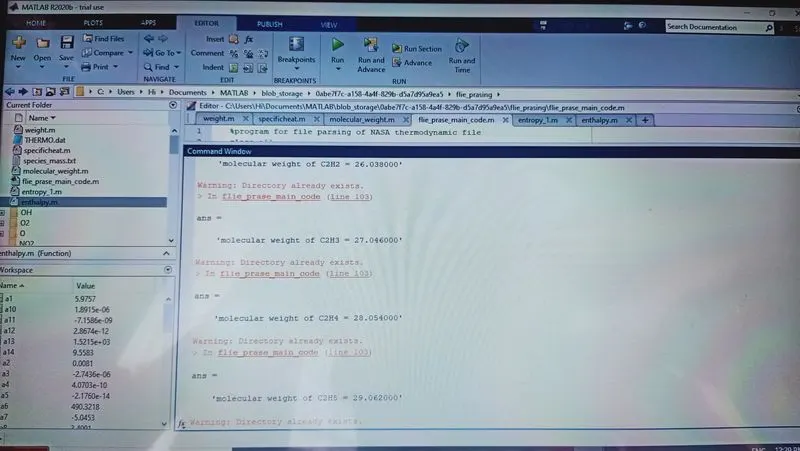
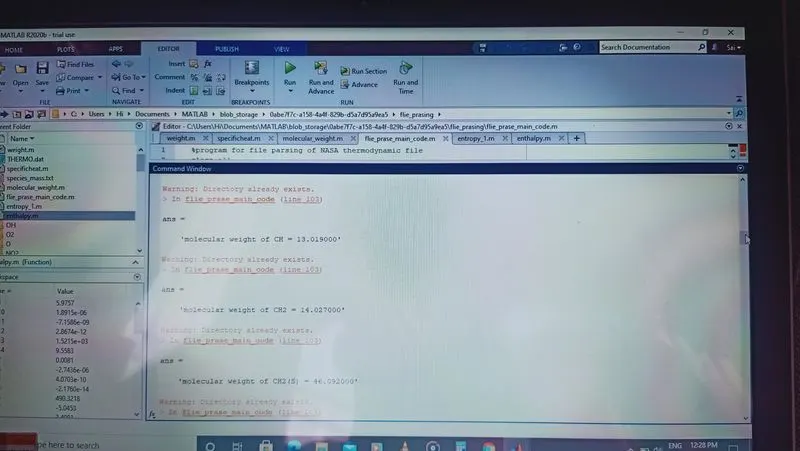
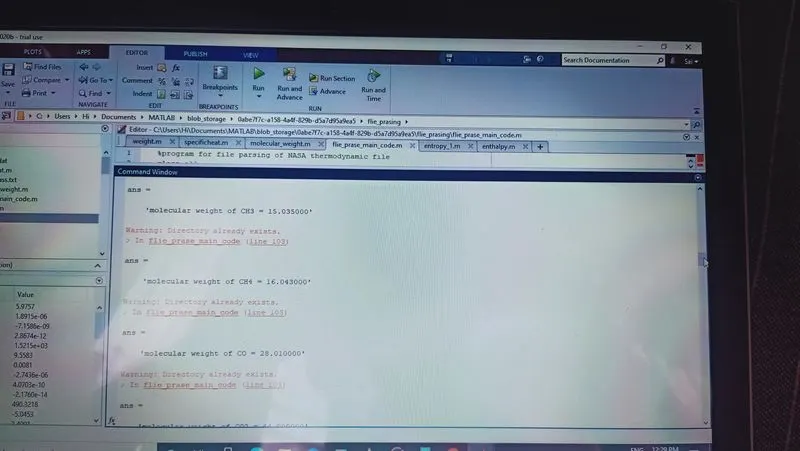
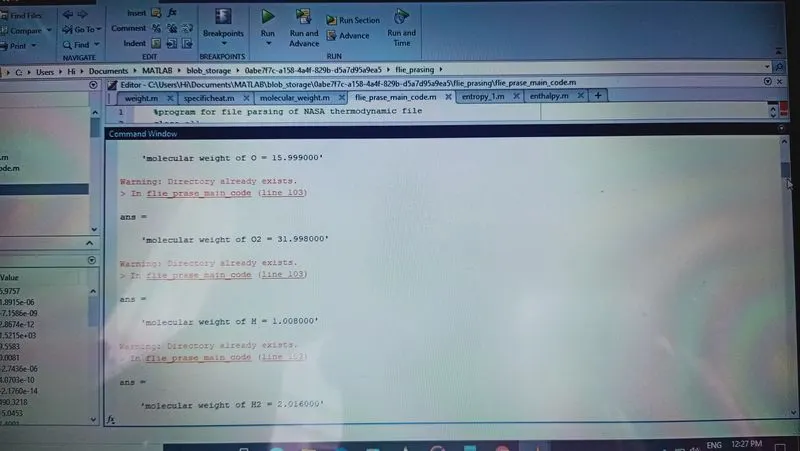
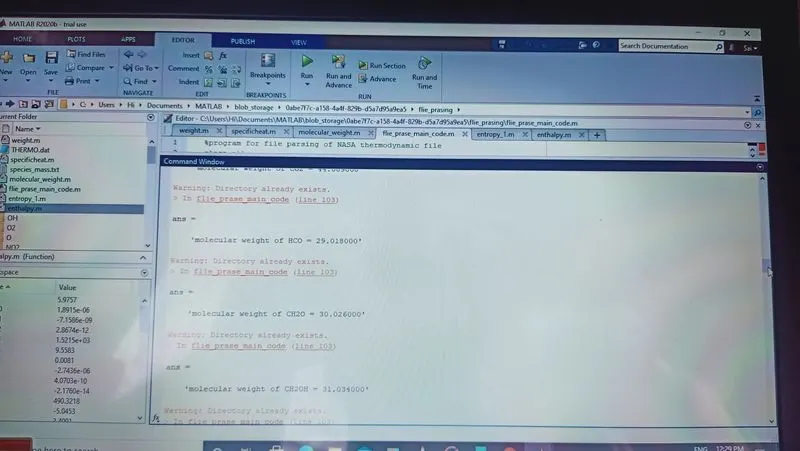
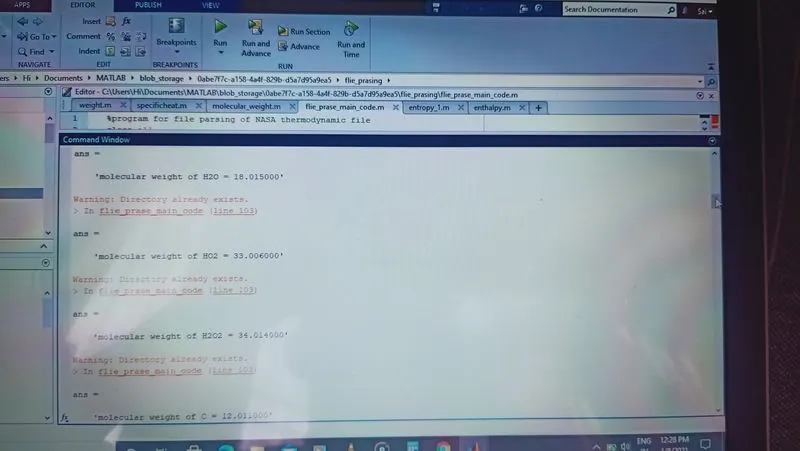
. Calculate the molecular weight of each species and dispaly it in command window
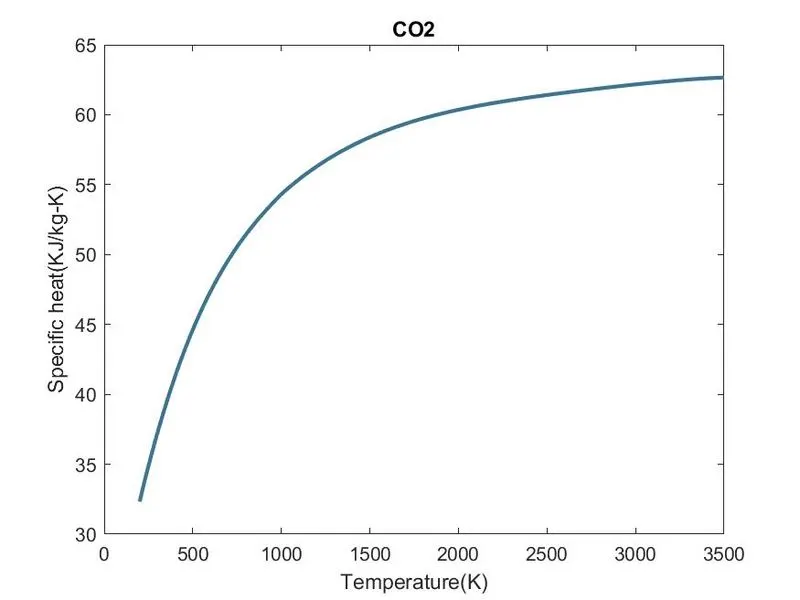
. Plot the Cp, Enthalpy and Entropy for the local temperature range (low temperature : high temperature) specific for each species.
. Save the plots as images with appropriate names and dump them in separate folders for each species with suitable name.
Theory:
Parsing:
Parsing in computer languages refers to syntactic analysis of the input code into its components parts in order to facilitate the writing of compilers and interpreters.
It can be used to describe split or separation.
Parsing a file means reading in a data stream of some sort and building an in memory model of the semantic content of that data.
parsing usually applies to text - the act of reading text and converting it into a more useful in-memory format, "understanding" is what it means to some extent.
Within computer science, the term is used in the analysis of computers languages referring to the syntactic analysis of the input code into its component parts
in order to facilitate the writing of compliers and interpreters.
For example, HTML parser analyses HTML Pages and extracts information from that page based on the various methods used on the HTML parser
(which may be DOM methods like getElementById(), getElementByTagName etc). The extracted information can be used for various purposes.
NASA Thermodynamic File:
NASA thermodynamics file which is THERMO.dat file in which there are temperature range and 53 species are given in these data and each species
contains 14 coefficients and temperature ranges and we have to parse these 14 coefficients to find Specific heat, Entropy and Enthalpy using formula as:
where,
R = Universal Gas constant
T = Temperature
Cp = Specific heat (KJ)
S = Entropy(KJ/mol-K)
H = Enthalpy(KJ/mol)
a(i) = Coefficients
where, i = 1 to 14
Specific Heat:
The specific heat is the amount of heat per unit mass required to raise the temperature by one degree Celsius. The relationship between heat and temperature
change is usually expressed in the form shown below where c is the specific heat.
Cp = R*(a1 + (a2*T) + (a3*(T).^2) + (a4*(T).^3) + (a5*(T).^4))
Entropy:
Matlab main code:
%program for file parsing of NASA thermodynamic file
close all
clear all
clc

%opening the external file
f1= fopen('THERMO.dat','r')
line_1= fgetl(f1); %skipping this line
line_2= fgetl(f1);

%obtaining global temperature values
%storing them as numbers in seperate values
global_values= strsplit(line_2,' ');
g_low_temp= str2num(global_values{2})
g_mid_temp= str2num(global_values{3})
g_high_temp= str2num(global_values{4})

line_3= fgetl(f1);%skipping the line
line_4= fgetl(f1);%skipping the line
line_5= fgetl(f1);

%defining input universal gas constant in KJ/K-mol-K
R= 8.314;

for i= 1:53
    T= fgetl(f1);

    %extracting the species name
    species_name= T(1:9);
    species_name= deblank(species_name); %removing blank spaces

    %extracting local temperatures
    species_temp= T(49:75);
    local_values= strsplit(species_temp,' ');
    l_low_temp= str2num(local_values{1});
    l_mid_temp= str2num(local_values{3});
    l_high_temp= str2num(local_values{2});
    %storing the local temperatures in a variable
    temp= [l_low_temp l_mid_temp l_high_temp];

    temp_range=linspace(l_low_temp,l_high_temp,500);

    coeff= fgetl(f1);
    coeff1= findstr(coeff,'E');

    %extracting the coefficients
    a1= coeff(1:coeff1(1)+3);
    a1= str2num(a1);
    a2= coeff(coeff1(1)+4:coeff1(2)+3);
    a2= str2num(a2);
    a3= coeff(coeff1(2)+4:coeff1(3)+3);
    a3= str2num(a3);
    a4= coeff(coeff1(3)+4:coeff1(4)+3);
    a4= str2num(a4);
    a5= coeff(coeff1(4)+4:coeff1(5)+3);
    a5= str2num(a5);

    new_line= fgetl(f1);
    coeff2= findstr(new_line,'E');
    a6= new_line(1:coeff2(1)+3);
    a6= str2num(a6);
    a7= new_line(coeff2(1)+4:coeff2(2)+3);
    a7= str2num(a7);
    a8= new_line(coeff2(2)+4:coeff2(3)+3);
    a8= str2num(a8);
    a9= new_line(coeff2(3)+4:coeff2(4)+3);
    a9= str2num(a9);
    a10= new_line(coeff2(4)+4:coeff2(5)+3);
    a10= str2num(a10);

   new_line1= fgetl(f1);
   coeff_3= findstr(new_line1,'E');
   a11= new_line1(1:coeff_3(1)+3);
   a11= str2num(a11);
   a12= new_line1(coeff_3(1)+4:coeff_3(2)+3);
   a12= str2num(a12);
   a13= new_line1(coeff_3(2)+4:coeff_3(3)+3);
   a13= str2num(a13);
   a14= new_line1(coeff_3(3)+4:coeff_3(4)+3);
   a14= str2num(a14);

  %specific heat calculation
  Cp= specificheat(a1,a2,a3,a4,a5,a8,a9,a10,a11,a12,temp,temp_range,R);

  %enthalpy calculation
  H= enthalpy(a1,a2,a3,a4,a5,a6,a8,a9,a10,a11,a2,a13,temp,temp_range,R);

  %entropy calculation
  S= entropy_1(a1,a2,a3,a4,a5,a7,a8,a9,a10,a11,a12,a14,temp,temp_range,R);

  %calculation of molecular weight
  m_weight= weight(species_name);

  %saving molecular weight
  species_w= fopen('species_mass.txt','w');
  fprintf(species_w,'molecular mass of %s is %f',species_name,m_weight);
  fclose(species_w);

%plotting and saving
cur_dir=pwd;

%making a new folder for each species
mkdir(species_name);
cd(species_name);


figure(1)
plot(temp_range,Cp,'linewidth',2,'color',[0.2345 0.4567 0.5678])
xlabel('Temperature(K)');
ylabel('Specific heat(KJ/kg-K)');
title(species_name);

figure(2),
plot(temp_range,H,'LineWidth',2,'color',[0.5678 0.3423 0.7874])
xlabel('Temperature(K)');
ylabel('Enthalpy(KJ/Kg)');
title(species_name);

figure(3)
plot(temp_range,S,'LineWidth',2,'color',[0.4532 0.1234 0.3324])
xlabel('Temperature(K)');
ylabel('Entropy(KJ/K)');
title(species_name);


%saving the plots in spearate folder for each species
saveas(1,'specific heat.jpg');
saveas(2,'enthalpy.jpg');
saveas(3,'entropy.jpg');

cd(cur_dir);

%printing the molcular weight of the species
sprintf('molecular weight of %s = %f',species_name,m_weight)


end

%closing the file
fclose(f1)
2. Using fgetl command the first line data is taken and stored in a variable line1.
3. Again using the fgetl command results in reading the next consecutive line in the data file. Thus using this command 5 times
4. we can extarct the first five lines (title, Global temp and comments) and store them in variables for our understanding.
5. In order to extract the global temperatures separately, 'strsplit' command is used( since extracted data even if number is stored as a string).
6. The spacing between each global temp is used as an indicator for the str split command.
7. There are totally 53 species as explained below,
total lines = 218 irrelevant lines = 6 [first 5 lines as explained above and the last line which has 'END'].
8. total relevant species lines = 218-6 = 212. each species has 4 lines of data. so, number of species = 212/4 = 53 species.
9. Using a 'for' loop with the 53 species, and with fgetl command each line of species is read and the coefficient values are stored from c1 to c14.
10. The coeff values can be found using the 'E' as an indicator and with strfind command.
11. Using a nested 'for' loop the Cp, H and S values are calculated as explained above.
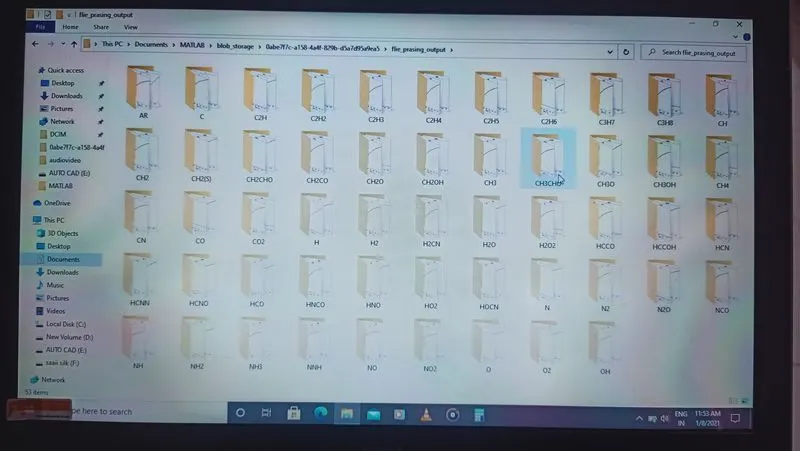
12. Now the extracted data is saved in a directory with the species name using the 'mkdir' command.
13. The graphs for each species are plotted and the images are saved in the directory using the saveas command.
14. To calculate the molecular weight a separate function is used with name 'molecular_weight'.
15. The value of universal gas constant is taken as 8.314 J/mol-K.
Specific heat code:
function[Cp]= specific_heat(a1,a2,a3,a4,a5,a8,a9,a10,a11,a12,temp,temp_range,R)
    %a1 a2 a3 a4 a5 are high temperature coefficients
    %a8 a9 a10 a11 a12 are low temperature coefficients
    for i= 1:length(temp_range)
    if temp_range(i)<=temp(2)
        Cp(i)= R*(a8 + (a9*temp_range(i)) + (a10*(temp_range(i).^2)) + (a11*(temp_range(i).^3)) + (a12*(temp_range(i).^4)));
    else
        Cp(i)= R*(a1 + (a2*temp_range(i)) + (a3*(temp_range(i).^2)) + (a4*(temp_range(i).^3)) + (a5*(temp_range(i).^4)));

    end
    end
Enthalpy code:
function[H]= enthaply(a1,a2,a3,a4,a5,a6,a8,a9,a10,a11,a12,a13,temp,temp_range,R)
    %a1 a2 a3 a4 a5 are high temperature coefficients
    %a8 a9 a10 a11 a12 are low temperature coefficients

    for i= 1:length(temp_range)
        if temp_range(i)<=temp(2)
            H(i)= R*((a8*temp_range(i)) + (a9*((temp_range(i).^2)/2)) + (a10*((temp_range(i).^3)/3)) + (a11*((temp_range(i).^4)/4)) + (a12*((temp_range(i).^5)/5)) + a13);

        else
            H(i)= R*((a1*temp_range(i)) + (a2*((temp_range(i).^2)/2)) + (a3*((temp_range(i).^3)/3)) + (a4*((temp_range(i).^4)/4)) + (a5*((temp_range(i).^5)/5)) + a6);
        end
end
Entropy code:
  function[S]= entropy_1(a1,a2,a3,a4,a5,a7,a8,a9,a10,a11,a12,a14,temp,temp_range,R)

    %a1 a2 a3 a4 a5 are high temperature coefficients
    %a8 a9 a10 a11 a12 are low temperature coefficients

    for i= 1:length(temp_range)
        if temp_range(i)<=temp(2)
            S(i)= R.*((a8*log(temp_range(i))) + (a9*temp_range(i)) + (a10*((temp_range(i).^2)/2)) + (a11*((temp_range(i).^3)/3)) + (a12*((temp_range(i).^4)/4)) + a14);

        else
            S(i)= R.*((a1*log(temp_range(i))) + (a2*temp_range(i)) + (a3*((temp_range(i).^2)/2)) + (a4*((temp_range(i).^3)/3)) + (a5*((temp_range(i).^4)/4)) + a7);

        end
end
Molecular weight code:
Below is the function to calculate the Molecular weight of each species.
1.First step is to assign the value for each element using an array.
2.Then using 'strcmp' command the species name and array elements are compared. Then the atomic weight is added according to the compared string element value.
3.To find the repetiton of elements of the same species, the numerical value(n) is extracted using the str2 num and then the
atomic weight of the previous element is added to 'b-1' times.
function[m_weight]= weight(species_name)

    element= {'H','O','N','Ar','C','S'};
    atomic_mass= [1.008, 15.999, 14.007, 39.948, 12.011, 32.065];
    m_weight=0;
    for i= 1:length(species_name)
        for j= 1:length(element)
            if strcmp(species_name(i),element(j))
                m_weight= m_weight + atomic_mass(j);
                a= j;
            end

            end

        b= str2num(species_name(i));
        if b>1
            m_weight= m_weight + atomic_mass(a)*(b-1);
        end
    end
end
RESULTS:
Plots of oxygen(O2):
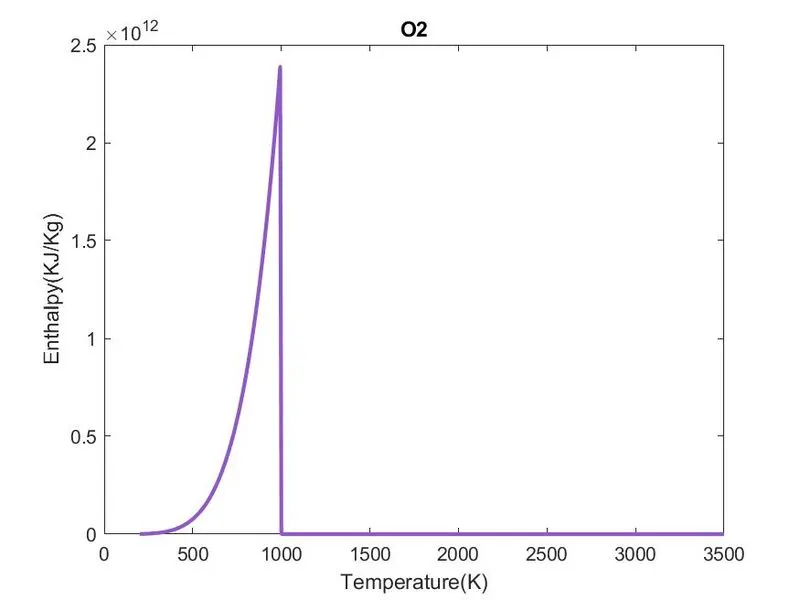
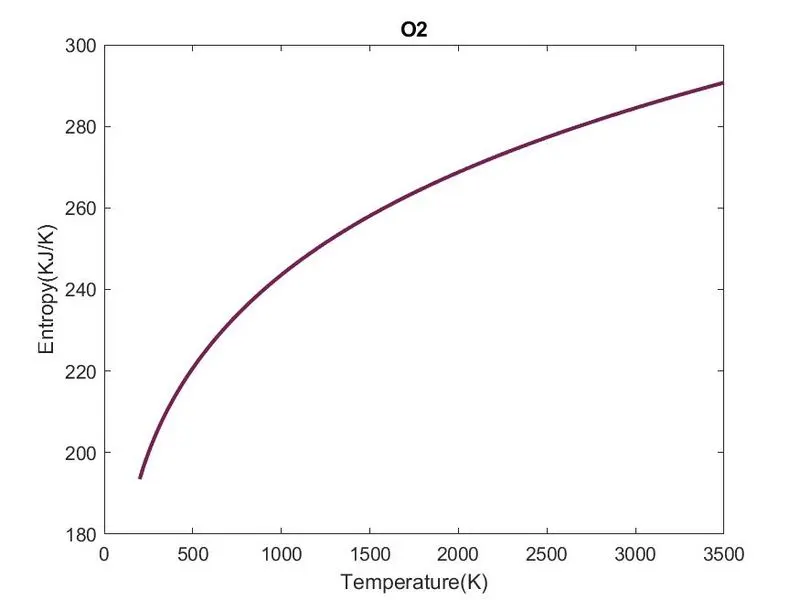
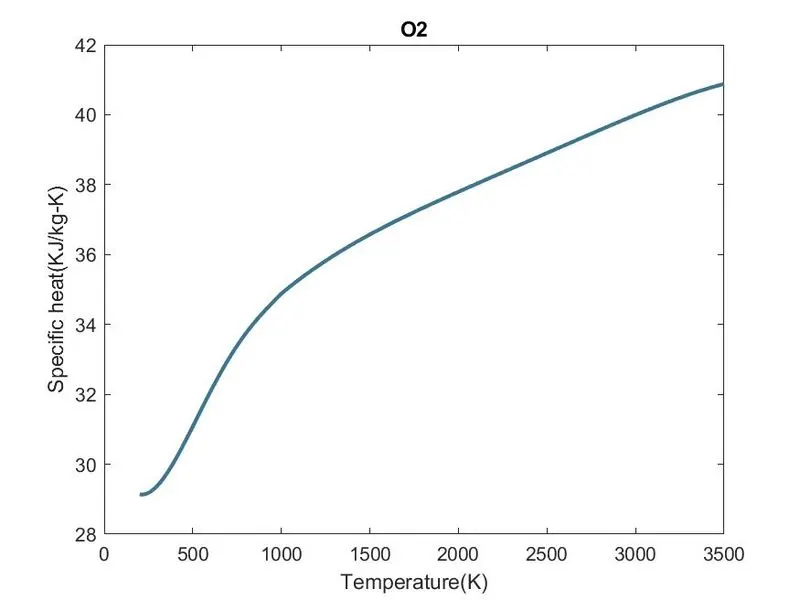
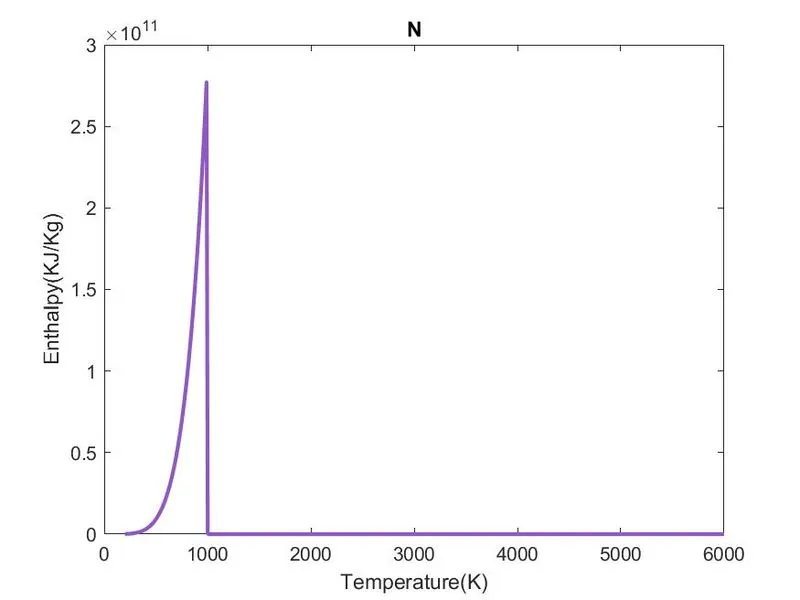
Plots of Nitrogen(N2):
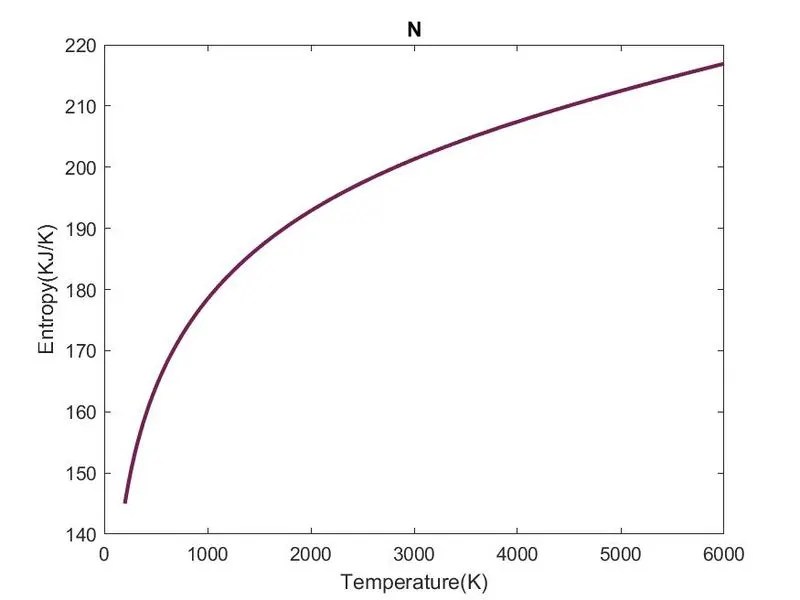
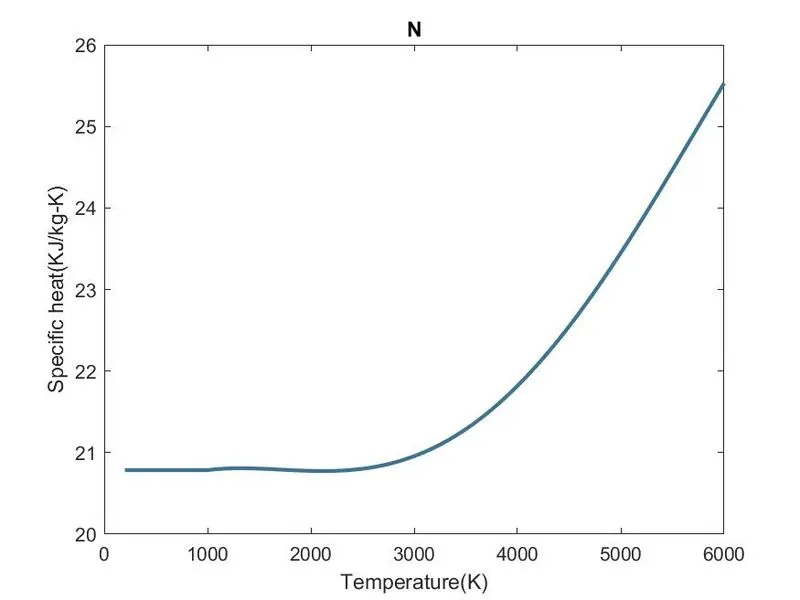
Plots of Carbon dioxide(CO2):
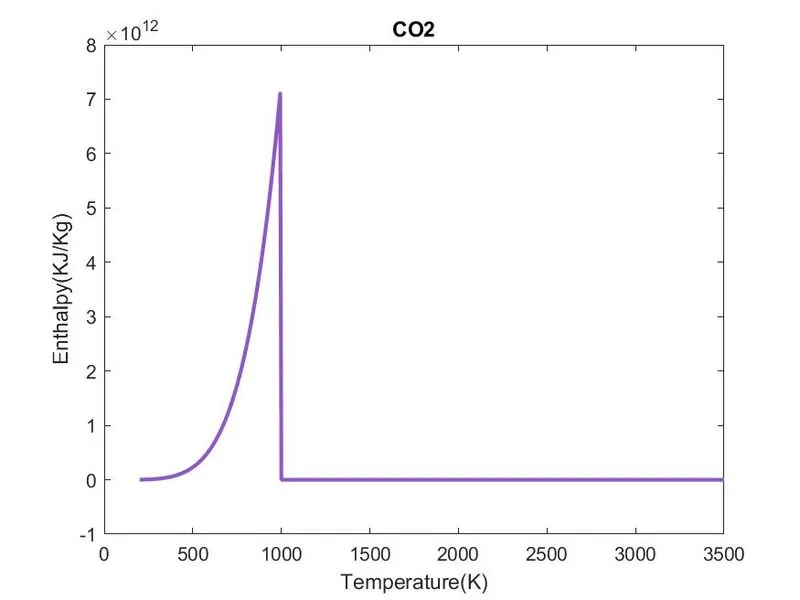
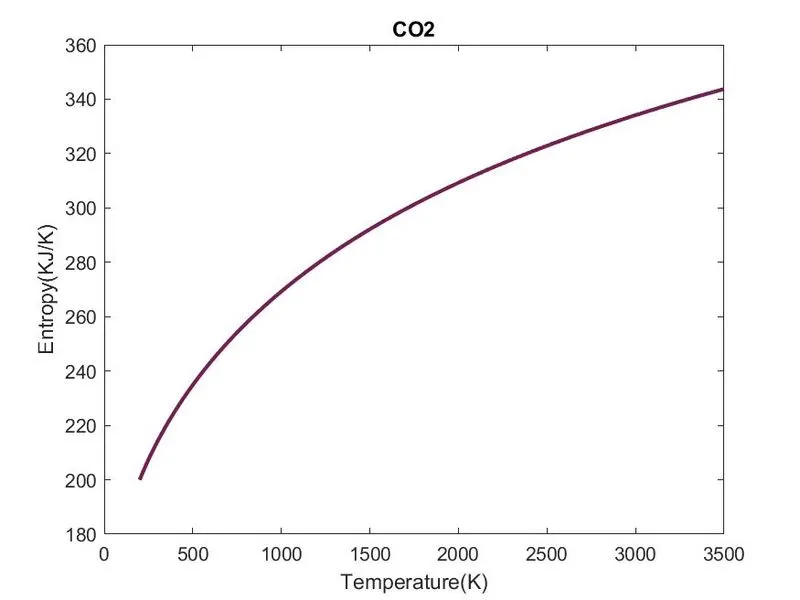
Command output of molecular weight:
Location of species thermodynamic properties:
ERRORS:
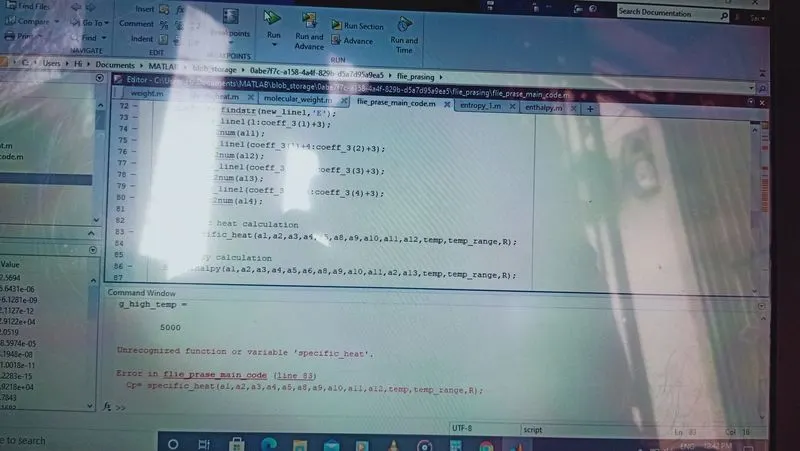
The first error was i get function variable in samll typo error main function code name.
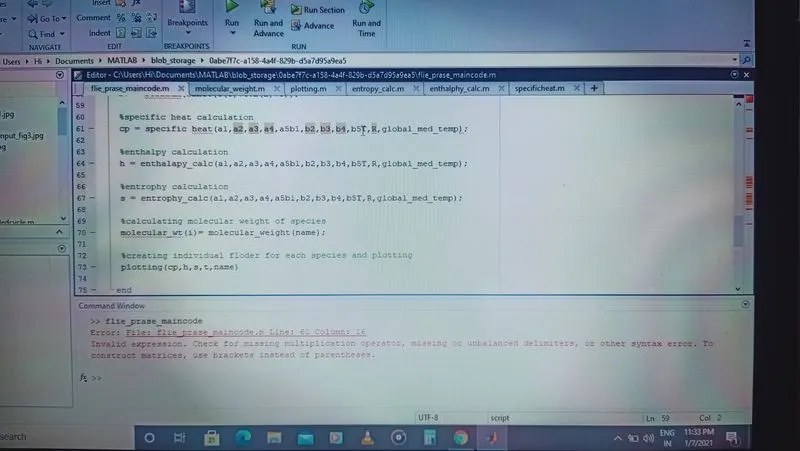
The second error occured because of synatx exprsession comma .so done replace the error.
Reference:
https://www.quora.com/What-is-parsing-How-do-you-parse-json-or-xml-files
https://en.wikipedia.org/wiki/Parsing
https://blogs.mathworks.com/loren/2016/09/26/indexing-with-curly-braces/
https://in.mathworks.com/matlabcentral/answers/35684-help-using-fgetl-function
Conclusion:
Thus File parsing is done for NASA Thermodynamic Data and the thermodynamic properties like specific heat , enthalpy and entropy are calculated.
Also plotting is done for the same and stored in the seperate directory by using matlab code.