Project 1 - Parsing NASA thermodynamic data
AIM:
1)To write a function that extracts the 14 co-efficients and calculates the enthalpy, entropy and specific heats for all the species in the data file.
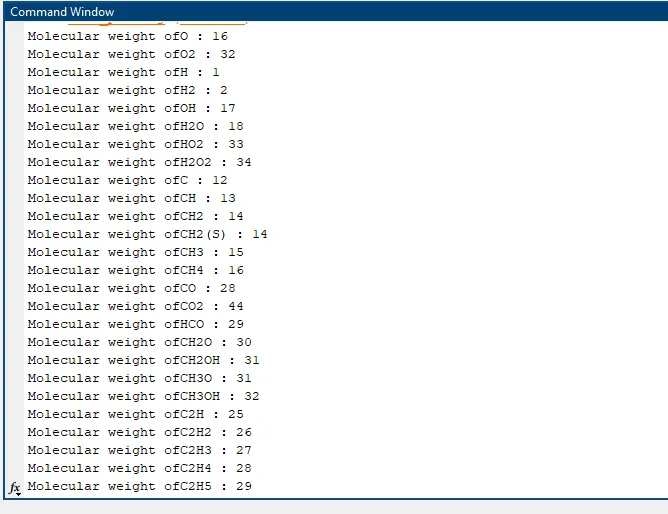
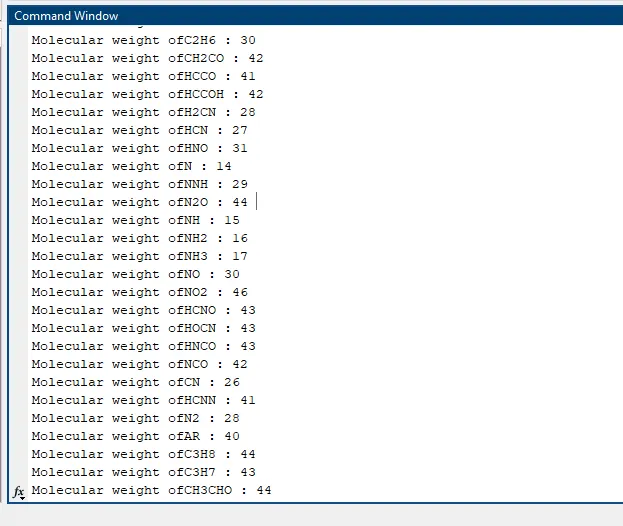
2)Calculate the molecular weight of each species and display it in the command window.
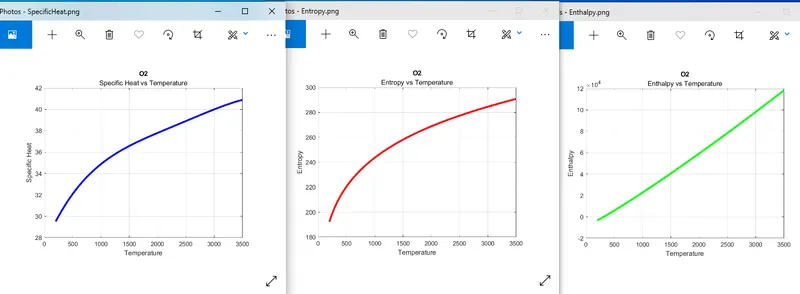
3)Plot the Cp, Enthalpy and Entropy for the local temperature range (low temperature : high temperature) specific for each species.
4)Save the plots as images with appropriate names and dump them in separate folders for each species with suitable name.
OBJECTIVE:
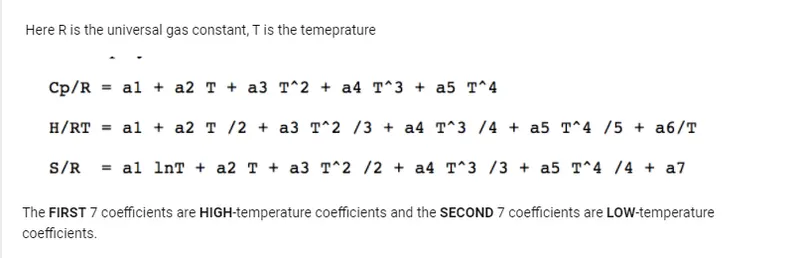
The main objective of this project is to read the given NASA data file and to get the 14 coefficients for each species and to calculate the enthalpy,entropy,specific heat with reference to the below formula. And to plot graphs of Cp,h,s vs temp for each specimens and to save it in different files.
FORMULAE :
Commands Used In This Program :
fopen - This command is used to open the file and here 'r' is used to read the file.
2) fgetl - This command is used to get the lines from the data file.
3) strsplit - This command is used to split the group of words into seperate words.
4) str2num - This command is used to convert the string into numbers for further opertions.
5) strfind -This command is used to find a letter in the line.
6) mkdir - This command is used to make a new folder.
7) saveas - This command is used to save the plots as images.
The main program :
clear all
close all
clc

%to read the file
f = fopen('THERMO.dat','r');
%to get the first line of the file
Header=fgetl(f);

%to get the second line
temp_range = fgetl(f);

%to split and conver it to string
global_temp = strsplit(temp_range,' ');

%getting the global minimum,maximum and mid temperature
global_min_temp = str2num(global_temp{2});
global_mid_temp = str2num(global_temp{3});
global_max_temp = str2num(global_temp{4});

%universal gas constant
R = 8.314;

%skipping the three comments
for i = 1:3
    skip = fgetl(f);
end

%running loop for each species that is 53 species in the file
for j = 1:53
    % reading the first line that tells which species it is
    % working temp range and no of molecules
     line_1=fgetl(f);
    x=strsplit(line_1,' ');
    species_name=x{1};%getting species names
    z=length(x);
    local_low_temp=str2double(x{z-3}); %storing the temp values as numbers
    local_mid_temp=str2double(x{z-1});
    local_high_temp=str2double(x{z-2});

%giving the local temp values%
    t1=local_low_temp;
    t2=local_mid_temp;
    t3=local_high_temp;
    t=linspace(t1,t3,200);

    %reading the three lines which contains 7 high temp coeff
    %and 7 low temp coeff
    line1 = fgetl(f);
    line2 = fgetl(f);
    line3 = fgetl(f);

    %finding the position of E so we can locate the coefficients
    l1 = strfind(line1,'E');
    l2 = strfind(line2,'E');
    l3 = strfind(line3,'E');

    %extracting high temp coeffs
    a1 = str2num(line1(1:11+3));
    a2 = str2num(line1(l1(1)+4:l1(2)+3));
    a3 = str2num(line1(l1(2)+4:l1(3)+3));
    a4 = str2num(line1(l1(3)+4:l1(4)+3));
    a5 = str2num(line1(l1(4)+4:l1(5)+3));
    a6 = str2num(line2(1:l2(1)+3));
    a7 = str2num(line2((l2(1)+4):l2(2)+3));

    %extracting low temp coeffs
    b1 = str2num(line2(l2(2)+4:l2(3)+3));
    b2 = str2num(line2(l2(3)+4:l2(4)+3));
    b3 = str2num(line2(l2(4)+4:l2(5)+3));
    b4 = str2num(line3(1:l3(1)+3));
    b5 = str2num(line3(l3(1)+4:l3(2)+3));
    b6 = str2num(line3(l3(2)+4:l3(3)+3));
    b7 = str2num(line3(l3(3)+4:l3(4)+3));

    %calling Specific Heat function
    Cp = function_specificheat(a1,a2,a3,a4,a5,b1,b2,b3,b4,b5,t,R,t2);

    %calling Enthaply Function
    h = function_enthalpy(a1,a2,a3,a4,a5,a6,b1,b2,b3,b4,b5,b6,R,t,t2);

    %calling Entropy function
    s = function_entropy(a1,a2,a3,a4,a5,a7,b1,b2,b3,b4,b5,b7,t,R,t2);

    %plotting the graph between temp vs Cp
    figure(1)
    plot(t,Cp,'linewidth',3,'color','b');
    xlabel('Temperature')
    ylabel('Specific Heat')
    title(species_name,'Specific Heat vs Temperature')
    grid on
%
%     %plotting the graph between temp vs enthalpy
    figure(2)
    plot(t,h,'linewidth',3,'color','g');
    xlabel('Temperature')
    ylabel('Enthalpy')
    title(species_name,'Enthalpy vs Temperature')
    grid on
%
%     %plotting the graph between temp vs entropy
%
    figure(3)
    plot(t,s,'linewidth',3,'color','r');
    xlabel('Temperature')
    ylabel('Entropy')
    title(species_name,'Entropy vs Temperature')
    grid on
%
    %creating folders for specific species name
    program = (['D:\NASA\',species_name]);
    mkdir(program)
    cd(program)
%
    %saving the figure
    saveas(1,'SpecificHeat.png')
    saveas(2,'Enthalpy.png')
    saveas(3,'Entropy.png')

    cd ..
%
    %to print the molecular weight of each element
    Mw = function_molecularweight(species_name);
%     mol= fprintf('Molecular weight of %s : %d',species_name,Mw);
    disp(' ')
end
fclose(f);
Program Description:
* First the NASA thermodynamic data file is downloaded.
* Then the program is started with fopen command to read the data file.
* Then using the fgetl command the lines in the data file are get in the program.
* The three main global temperatures were given in the second line in the data file.Those temperature were get in the command and assigned it as global min, mid and max temperature.
* Then using for loop the further operations were carried out.
* There are 53 species in total and each species has 14 coefficients under them.
* 14 coefficients were extracted in the main program and 3 function programs were written to calculate the Specific heat,Enthalpy and Entropy for all the species in the data file.First 7 coefficients are High Temperature coefficients and second 7 coefficients are Low Temperature coefficients.
* Function program were called in the main program.
* And graphs were plotted for all the species of Cp vs T, h vs T, s vs T and all the graphs were saved using saveas command.
* All the plots were saved as images with appropriate names and saved in seperate folders for each species with suitable name.
* Another function program is written to calculate the molecular weight for all the 53 species an that function program is called in the main program and molcecular weight of the each species were displayed in the command window.
Function of Enthalpy:
%function for calculating enthalpy

function[h] = function_enthalpy(a1,a2,a3,a4,a5,a6,b1,b2,b3,b4,b5,b6,R,t,t2)
if t<t2
    h = R*t.*(b1+b2.*(t./2)+b3.*(t.^2)./3+b4.*(t.^3)./4+b5.*(t.^4)./5+(b6./t));

else
     h = R*t.*(a1+(a2.*t./2)+a3.*(t.^2)./3+a4.*(t.^3)./4+a5.*(t.^4)./5+(a6./t));
end
This function uses the high temperature coefficients,low temperature coefficients,Universal gas constant,global min,mid and max temperatures values as input parameters.
Then using the if else condition statement the temperature valus is compared with the global mid temp values and the appropriate equation with the proper maximum or min temperature coefficient is selected and the enthalpy is calculated and its values is represented by H.
Function of Entropy:
% function for calculating entropy

function[s] = function_entropy(a1,a2,a3,a4,a5,a7,b1,b2,b3,b4,b5,b7,t,R,t2)
if t<t2
     s = R*(b1.*log(t)+b2.*t+b3.*(t.^2)./2+b4.*(t.^3)./3+b5.*(t.^4)./4+b7);
else

    s = R*(a1.*log(t)+a2.*t+a3.*(t.^2)./2+a4.*(t.^3)./3+a5.*(t.^4)./4+a7);
end
This function uses the high temperature coefficients,low temperature coefficients,Universal gas constant,global min,mid and max temperatures values as input parameters.
Then using the if else condition statement the temperature valus is compared with the global mid temp values and the appropriate equation with the proper maximum or min temperature coefficient is selected and the entropy is calculated and its values is represented by s.
Function of Specific Heat:
%function for calculating specific heat

function[Cp] = function_specificheat(a1,a2,a3,a4,a5,b1,b2,b3,b4,b5,t,R,t2)
if t<t2
    Cp = R*(b1+b2.*(t)+b3.*(t.^2)+b4.*(t.^3)+b5.*(t.^4));

else
     Cp = R*(a1+a2.*(t)+a3.*(t.^2)+a4.*(t.^3)+a5.*(t.^4));
end
This function uses the high temperature coefficients,low temperature coefficients,Universal gas constant,global min,mid and max temperatures values as input parameters.
Then using the if else condition statement to check if the temperature values is less than the global mid temp values and the appropriate equation with the proper maximum or min temperature coefficient is selected and the Specific Heat is calculated and its values is represented by Cp.
Function to find Molecular Weight:
function[Mw] = function_molecularweight(species_name)
s = {'H' 'C' 'N' 'O' 'R'};
fprintf('Molecular weight of');
fprintf(species_name);
fprintf(' : ');

%atomic weight of each individuals
atomicweight = [1 12 14 16 40];
Mw = 0;
for i = 1:length(species_name)
    for j = 1:length(s)
        if strcmp(species_name(i),s(j))
            Mw = Mw + atomicweight(j);
            %storing the position of matched element
            position = j;
        end
    end
    n = str2num(species_name(i));
    if n > 1
        Mw = Mw + atomicweight(position)*(n-1);
    end
end
fprintf('%d',Mw);
disp('');
end
Molecular weight is calculated in different function and displayed in the command window.
RESULTS:
Molecular Weight:
PLOTS:
For O2 :
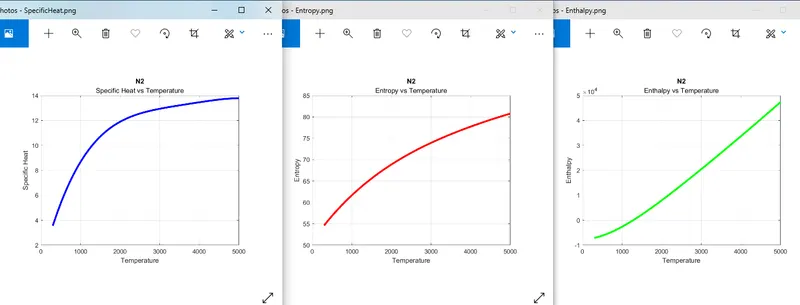
For N2:
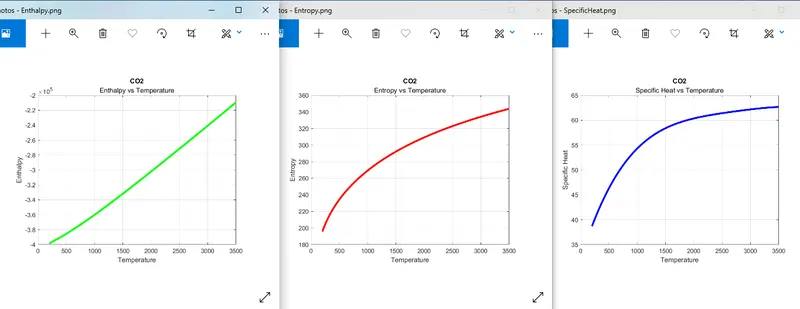
For Co2:
Folder Window:

Result Conclusion:
* Function to extract the 14 coefficients and to calculate the enthalpy ,entropy and specific heat was written.
*Function to calculate the molecular weight of each species was written and display it in command window.
*Plots of Specific heat, Enthalpy and Entropy for local temp range specific for each species.
*Screenshot of the window with the files was attached.
*Plots for O2,N2,Co2 Molecules attached.
Errors:
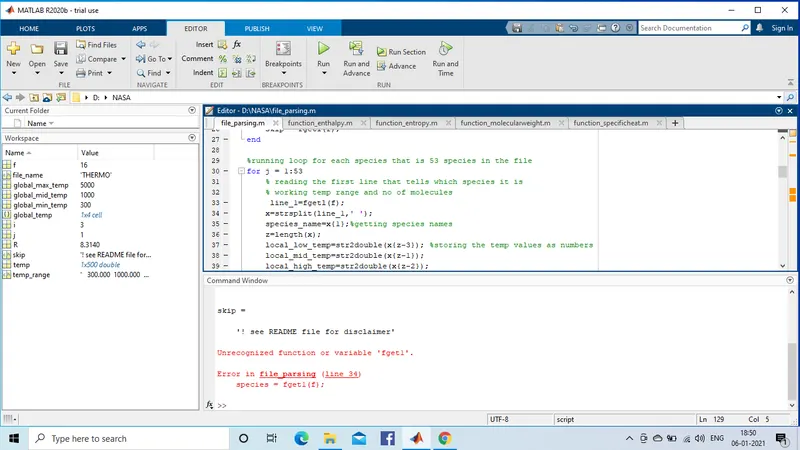
*Had Few Errors in the functions and in the main program which was rectified but forgot to take screenshots.