Project 1 - Parsing NASA thermodynamic data
Problem Statement:
1. Write a function that extracts the 14 coefficients and calculates the enthalpy, entropy and specific heats for all the species in the data file. You will be reading this file NASA thermodynamic data(Tip: use fopen and fgetl).
The FIRST 7 coefficients are HIGH-temperature coefficients and the SECOND 7 coefficients are LOW-temperature coefficients.
Also use the LOCAL TEMPERATURE RANGES which is unique for each individual species, not the GLOBAL TEMPERATURE RANGE.
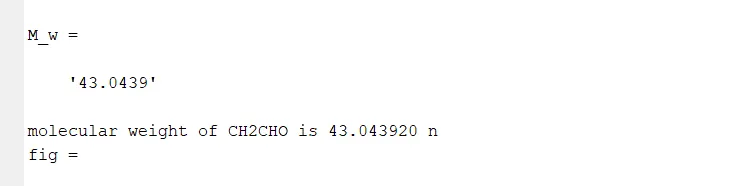
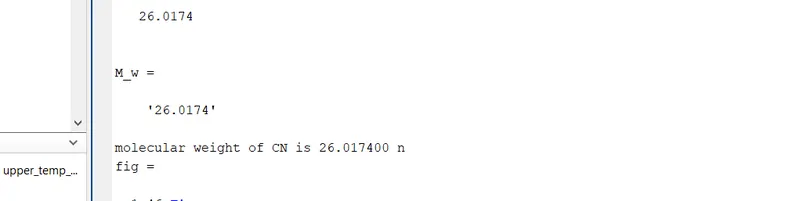
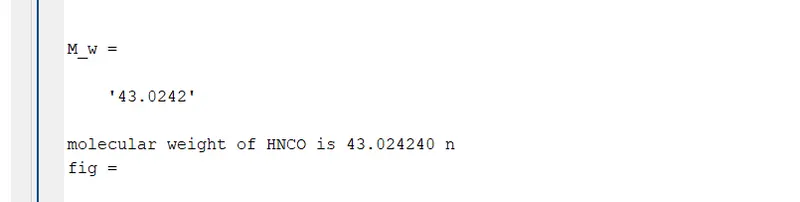
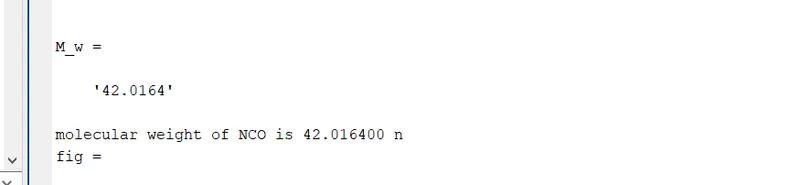
2. Calculate the molecular weight of each species and display it in the command window.
3. Plot the Cp, Enthalpy and Entropy for the local temperature range (low temperature: high temperature) specific for each species.
4. Save the plots as images with appropriate names and dump them in separate folders for each species with a suitable name. All of these should be generated automatically.
5. The main program that you will submit will just take the "THERMO.dat" file as an input and generate Cp, H and S plots.
6. Please write a detailed report to describe your logic.
Theory:
NASA came up with an idea of polynomial which can be used to evaluate the CP, H, S i.e specific heat, enthalpy, entropy. To calculate the CP,,H,S the coefficients of species are as follows.
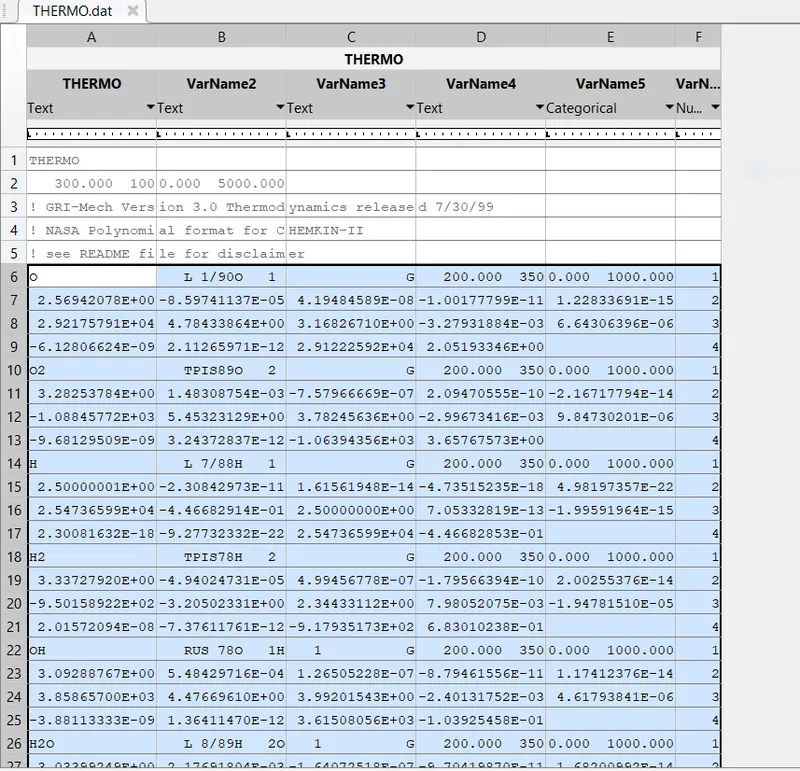
This is the screenshot of the THERMO file.
- The first line THERMO is the file name.
- The second line is the Global temperature range the first value 300 is the Global low temperature and 1000 is the mid global temperature and 5000 is the global high temperature.
- The next three lines are the file header lines which are comments we can skip them.
- Next four lines are data which belongs to one species and consecutive next four lines belong to the next species.
- The first line of each species represents the local temperature range of a particular species.
- The next three lines contain the 14 coefficients of a species. The second line contains the 5 coefficients of high-temperature range out of 7 coefficients.
- The third line contains two high-temperature range coefficients and three low-temperature coefficients out of seven low-temperature coefficients.
- The fourth line contains four low-temperature coefficients.
The main aim is to extract the 14 coefficients of a species and to calculate the CP, H, S values using the following formulas.
The commands used in this Matlab code is as follows:
fopen open file.
FID = fopen(FILENAME) opens the file FILENAME for read access.FILENAME is the name of the file to be opened.
FID is a scalar MATLAB integer-valued double, called a file Identifier. If the file is not found then it returns -1.
FID = fopen(FILENAME,PERMISSION)opens the file FILENAME in the mode specified by the PERMISSION.
'r' = Open file for reading.
'w' = open file for writing.
'a'= open or create a file for writing.
'r+'= open file for reading and writing.
'w+'=open or create a file for creating and writing.
'a+'=open or create a file for reading and writing.
'W'= open file for writing without automatic flushing.
'A'= open file for appending without automatic flushing.
fclose close file.
fclose(FID) closes the file associated with file identifier FID, which is an integer value obtained from an earlier call to fopen.fclose returns 0 if successful or -1 if not.
fprintf write formatted data to a text file.
fprintf(FID, FORMAT, A..)applies the FORMAT to all elements of array A and any additional array arguments in column order, and write the data to the text file.
fprintf(FORMAT, A..)formats data and display the results on the screen.
COUNT = fprintf(...) returns the number of bytes that fprintf writes.
FORMAT is a character vector that describes the format of the output fields and can include combinations of the following.
*conversion specifications,which include a % character,a conversion character(such as d,i,o,u,x,f,e,g,c or s),and optional flags,width,and precision fields.
Escape characters including.
\b Backspace '' single quotation mark
\f Form feed %% percentage character
\n Newline \\ Backslash
\r carriage return \XN Hexadecimal number N
\t Horizontal tab \N Octal number N.
fscanf Read data from a text file.
[A,COUNT] = fscanf(FID,FORMAT) reads and converts data from txt file into array A in column order.FID is a file identifier obtained from FOPEN.
COUNT is an optimal output argument that returns the number of elements successfully read.
[A,COUNT] = fscanf(FID,FORMAT,SIZEA) reads SIZEA elements into A. valid forms for SIZEA are:
inf read to the end of the file.
N read at most N elements into a column vector.
[M, N] read at most M*N elements filling at least an M-by-N matrix in column order. N can be infinity but M cannot.
fgetl Read line from the file, discard newline character.
TLINE = fgetl(FID)returns the next line of a file associated with file identifier FID as a MATLAB character vector. The line terminated is not included, to include terminated line use FGETS command.
If an error occurs then fgets returns an empty vector.
strcmp compares strings or character vectors
TF = strcmp(s1,s2) compares s1,s2 and returns logical 1 (true) if they are identicl, and returns logical 0 (false) otherwise. Either text input can be character vector or a string scalar.
TF = strcmp(S, A) compares S to each element of array A, where S is a character vector, a string scalar, or a cell array with one element, returns TF, a logical array that is the same size as and contains logical 1
(true) for those elements of A that are a match, and logical 0 (false) for those elements that are not. TF = strcmp(A,S) returns the same result.
strtok
strtok split string into tokens.
[TOKEN, REMAIN] = strtok(str) returns the first token in STR delimited by whitespace characters and the rest of STR in REMAIN.strtok ignores any leading whitespace. If STR is a cell array of character vectors,
TOKEN is a cell array of tokens. If STR is a string array, TOKEN is a string array.
Matlab Codes:
Step1: Function program to calculate the CP, H, S.
The properties specific heat, enthalpy, entropy (CP, H, S) are calculated using the
formulas as shown above, which are calculating by using a function and called in the main
function.
%% Function program to calculate CP,H,S

% The function takes temp, coefficients and calculates CP,H,S
function [CP,H,S]= thermo_data_calculate(Temp,coefficient_value)

R = 8.314;% universal gas constant value

%Distribute the input coefficient value vector into individual coefficients.
a1 = coefficient_value(1);
a2 = coefficient_value(2);
a3 = coefficient_value(3);
a4 = coefficient_value(4);
a5 = coefficient_value(5);
a6 = coefficient_value(6);
a7 = coefficient_value(7);

% i is an iterative loop calculates cp, H,s for every temperature.

for i = 1:length(Temp)

% Input temperature
 T = Temp(i);

    %calculate cp value
    CP(i) = (a1 + a2*T + a3*T^2 + a4*T^3 + a5*T^4)*R;

% calculate H value
    H(i) = (a1 + a2*T/2 + a3*(T^2)/3 + a4*(T^3)/4 + a5*(T^4)/5 +a6/T)*R*T;

% calculate S value
    S(i)= ( a1*log(T) + a2*T + a3*(T^2)/2 + a4*(T^3)/3 + a5*(T^4)/4+a7)*R;

end
end
step2: Function program to calculate the molecular weights.
Matlab code to calculate molecular weights which is performed by creating a function and
called in the main program.
%% function to calculate the molecular weights

% function takes the formula as input and calculates the molecular weights.
function weight = molecular_weight(formula)

% Atomic weights of different atoms.
H = 1.00784;
O = 15.999;
N = 14.0067;
C = 12.0107;
S = 32.065;
AR = 39.948;

%calculate molecular weights
weight = 0;

for i = 1:length(formula)
    if strcmp(formula(i),'H')
        weight = weight +H;
        W1 = H
    elseif strcmp(formula(i),'O')
            weight = weight + O;
            W1 = O
        elseif strcmp(formula(i),'N')
            weight = weight + N;
            W1 = N
            elseif strcmp(formula(i),'C')
            weight = weight + C;
            W1 = C
                elseif strcmp(formula(i),'CH2(S)')
            weight = C + 2*H + S
            break;
                    elseif strcmp(formula(i),'A')
                        weight = AR
                        break;
                    else
                        A = str2num(formula(i));
                        weight = weight + (A-1)*W1
end
end
end
Step3: Function program to Extract the Coefficients.
Matlab code to extract the coefficients of all species which is performed by creating a
function and called in the main program.
%% function program to extract te coefficients of all species.
% function take the input line1,line2,line3,line and gives the low coeff.,high coeff.

function [low_coeff,high_coeff] = coefficients(line1,line2,line3,line4)

% Higher coefficients.
a1_high = str2num(line2(1:15));
a2_high = str2num(line2(16:30));
a3_high = str2num(line2(31:45));
a4_high = str2num(line2(46:60));
a5_high = str2num(line2(61:75));
a6_high = str2num(line3(1:15));
a7_high = str2num(line3(16:30));

% Lower coefficients.
a1_low = str2num(line3(31:45));
a2_low = str2num(line3(46:60));
a3_low = str2num(line3(61:75));
a4_low = str2num(line4(1:15));
a5_low = str2num(line4(16:30));
a6_low = str2num(line4(31:45));
a7_low = str2num(line4(46:60));

% Differentiating lower and higher coefficients.
low_coeff = [a1_low,a2_low,a3_low,a4_low,a5_low,a6_low,a7_low];
high_coeff = [a1_high,a2_high,a3_high,a4_high,a5_high,a6_high,a7_high];
end
step4:Function program to generate plots and save the figure.
%% Function to generate the plots and save them.

% function takes all necessary inputs and generates the fig.
functionfig=figure_call(Input,i,lower_temp_boundary,upper_temp_boundary,CP_low,CP_high,H_low,H_high,S_low,S_high)

% calculate molecular weight by calling the function
Molecular_weight = molecular_weight(Input)

% To generate the plot on a full screen.
figure('units','normalized','outerposition',[0 0 1 1])


fig = figure(i);

% creating subplot
subplot(2,2,1)

% first subplot contains temperature vs specific heat
plot(lower_temp_boundary,CP_low,'linewidth',2,'color','k')

% Holds the current plot.
hold on

plot(upper_temp_boundary,CP_high,'linewidth',2,'color','k')

% labelling the x and y axis
xlabel('Temperature [k]')
ylabel('Specific Heat CP')

% Specifing the title for the plot
title(['Temperature vs Specific Heat for  ',Input])

% creating subplot
subplot(2,2,2)

% Second subplot contains temperature vs Enthalpy
plot(lower_temp_boundary,H_low,'linewidth',2,'color','k')

% Holds the current plot.
hold on

plot(upper_temp_boundary,H_high,'linewidth',2,'color','k')

% labelling the x and y axis
xlabel('Temperature [k]')
ylabel('Enthalpy')

% Specifing the title for the plot
title(['Temperature vs Enthalpy for  ',Input])

% creating subplot
subplot(2,2,3)

% Third subplot contains temperature vs Entropy
plot(lower_temp_boundary,S_low,'linewidth',2,'color','k')

% Holds the current plot.
hold on

plot(upper_temp_boundary,S_high,'linewidth',2,'color','k')

% labelling the x and y axis
xlabel('Temperature [k]')
ylabel('Entropy')

% Specifing the title for the plot
title(['Temperature vs Entropy for  ',Input])

% num2str converts a number into a string
M_w = num2str(Molecular_weight)
str = ['molecular mass of  ',Input, ' is ' , M_w];

% fourth part contains molecular weight value.
ax = subplot(2,2,4);
text(0,0.5,str)
set(ax,'visible','off')

% save fig in the directory.

print(fig,[Input],'-djpeg')
fprintf('molecular weight of %s is %f n',Input,molecular_weight)
end
step5: Main program:
%project1:NASA file parsing.

%clear all commands
%clear all plots.
% clear all workspace

clear all
close all
clc

% fopen open the file named THERMO.dat
f1 = fopen('THERMO.dat','r');

%To get first line
 fgetl(f1);

% storing the line obtained.
 G_Temp_str = fgetl(f1);

%strsplit splits the string
 G_Temp = strsplit(G_Temp_str,' ');

% Assigning the temperatures based on the positions
 low_temp_global = str2num(G_Temp{2});
  mid_temp_global = str2num(G_Temp{3});
 high_temp_global = str2num(G_Temp{4});

% Getting header lines
 for i = 1:3
     fgetl(f1);
 end
 n = 53;% number of species
 for i = 1:n %Iterative loop until 'n'
     line1 = fgetl(f1);% getting first line
     line1_split = strsplit(line1,' ');% spliting the string
     Input = line1_split{1}% Assigning to a variable

     local_low_temp = str2num(line1(49:49+7));% local low  temp
        local_mid_temp = str2num(line1(49+17:49+17+8));% local mid temp
     local_high_temp = str2num(line1(49+8:49+8+8));% local high temp

% Getting header lines which can be neglected
line2 = fgetl(f1);
line3 = fgetl(f1);
line4 = fgetl(f1);

%Generating the coefficients
[low_coeff,high_coeff]= coefficients(line1,line2,line3,line4)

% Differentiating the lower and upper temp boundary
lower_temp_boundary = local_low_temp : local_mid_temp;
upper_temp_boundary = local_mid_temp : local_high_temp;

% calculate CP,H,S
[CP_high,H_high,S_high] = thermo_data_calculate(upper_temp_boundary,high_coeff);
[CP_low,H_low,S_low] = thermo_data_calculate(lower_temp_boundary,low_coeff);

%Generating the figure
fig(i) = figure_call(Input,i,lower_temp_boundary,upper_temp_boundary,CP_low,CP_high,H_low,H_high,S_low,S_high)
 end
step by step procedure:
- First, open the file named 'THERMO.dat' using the command fopen .
- The first line of the file is obtained by the command fgetl.
- The global temperatures are stored in a string. And differentiated the low, mid, high global temperatures by using strsplit , the string is converted into number by using the str2num command and also based on their position indexing.
- The next three lines which are header lines are neglected and read out by using fgetl command.
- There are 53 species in the file and all the species contains four lines, in the first line of each species contains species name and local temperature range, which are extracted by using the appropriate index position.
- So a loop iterative is used to extract all coefficients of 53 species and stored them in a string . Here the string is divided by a delimiter 'E' and obtained by calculated number of positions.
- After all, coefficients are extracted these are passed to the function to calculate the CP, H, S value and molecular weights.
- All plots are saved in the directory.
- Molecular weights are obtained in the command window.
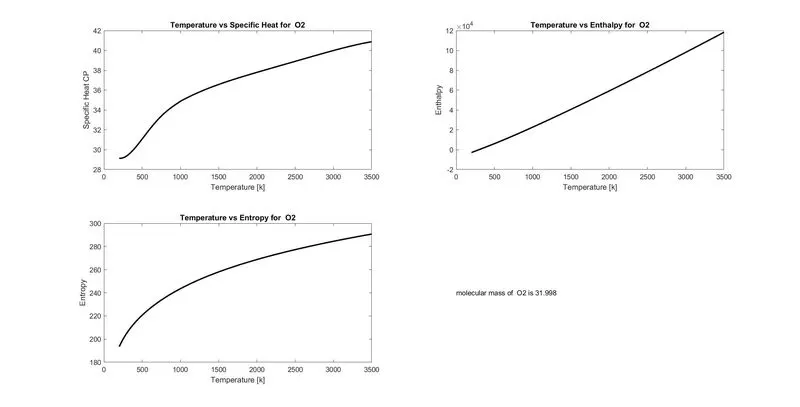
O2 Plot:
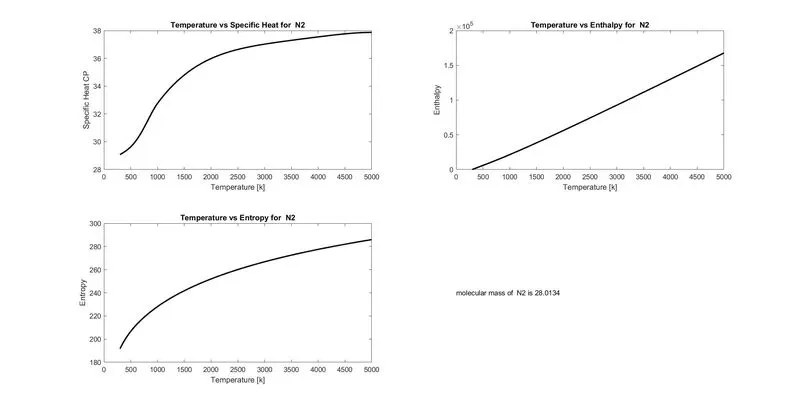
N2 Plot
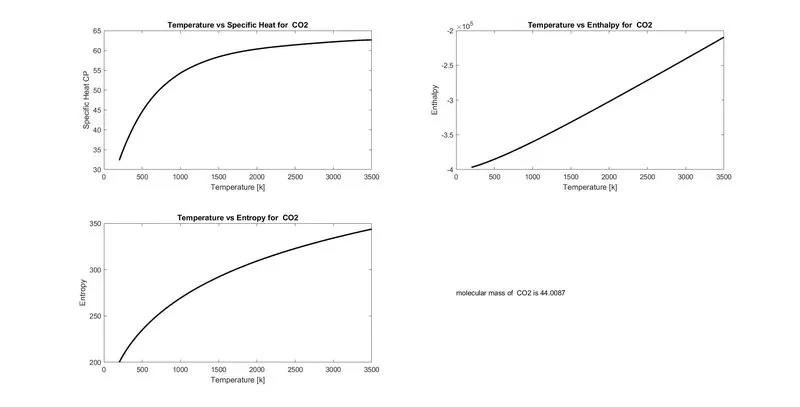
CO2 Plot
Screenshot of folder:

Molecular weights output:
Drive link:
https://drive.google.com/drive/folders/1H1IH3bRihdgok8vMl7uB65Ft8eWkQdU7?usp=sharing
Errors: I have missed end condition in the function and forgot to mention how many no. of iterations, and rectified by understanding the command window.
References:
1.Matlab documentation
2.skill lync course videos
3.http://combustion.berkeley.edu/gri-mech/data/nasa_plnm.html
4.Thermo file.