Project 1 - Parsing NASA thermodynamic data
AIM:
To write the program for parsing NASA's themodynamic data to evaluate thermodynamic properties such as Cp,H and S.
OBJECTIVE:
#To extract all the 14 coefficients of element/compound from the data and calculate the entropy, enthalpy and specific heat.
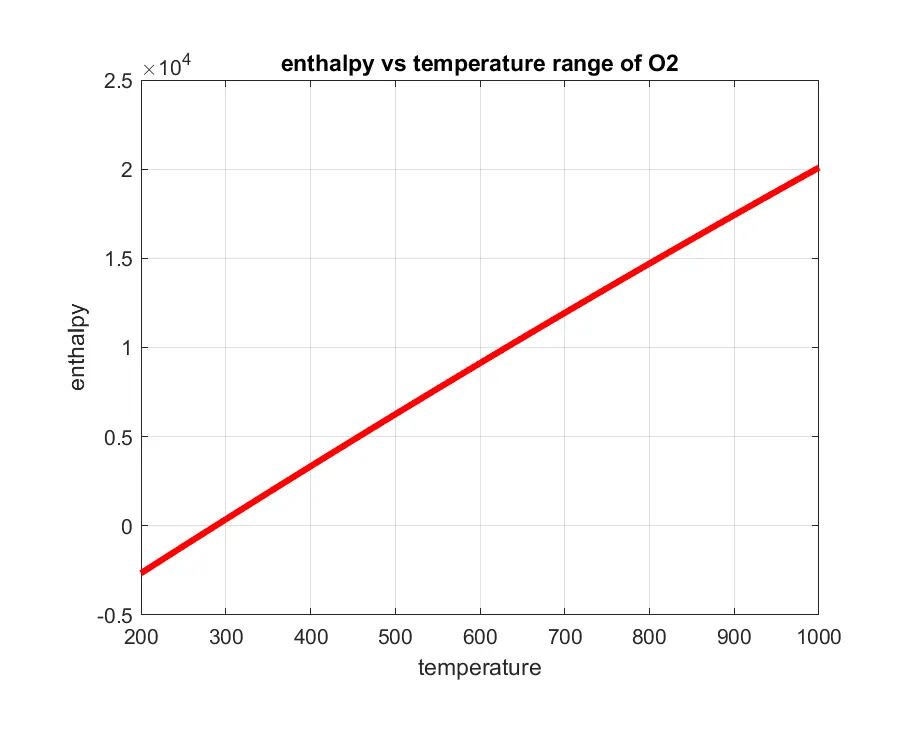
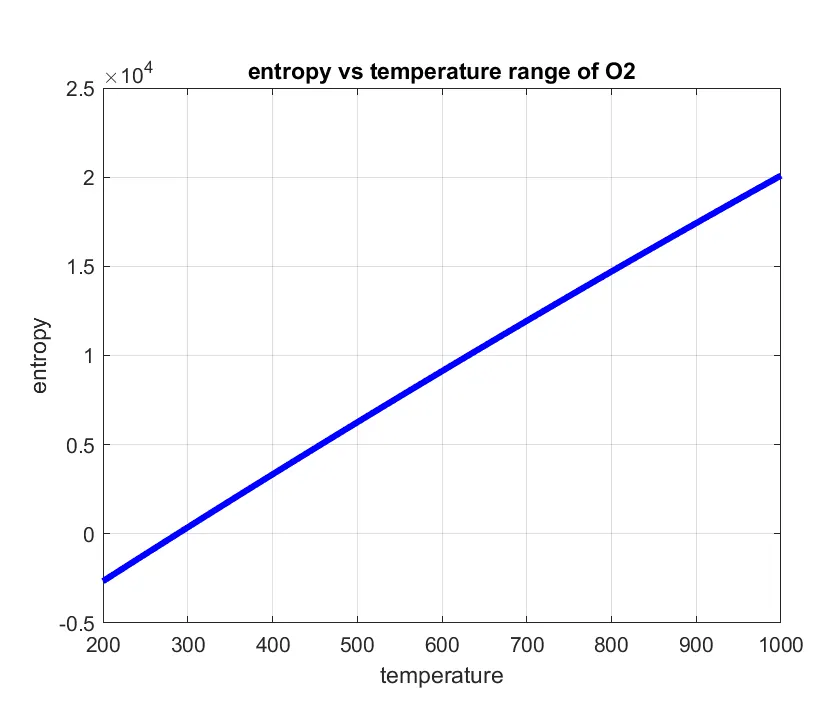
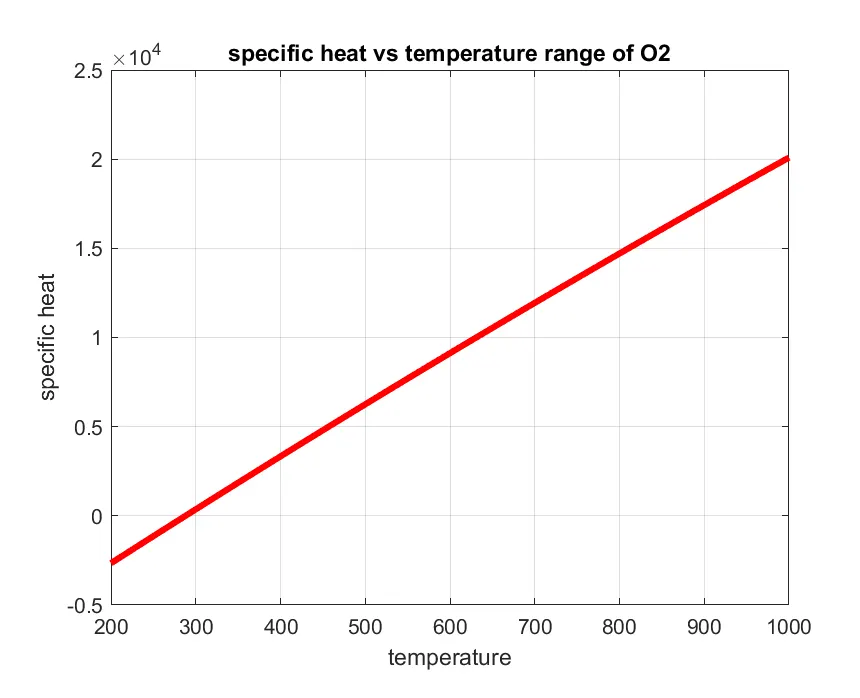
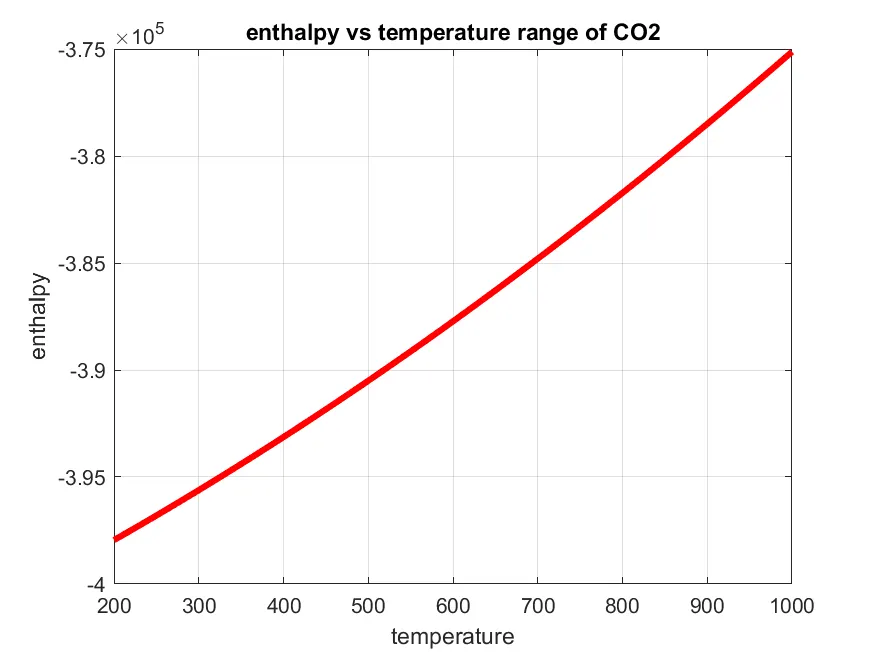
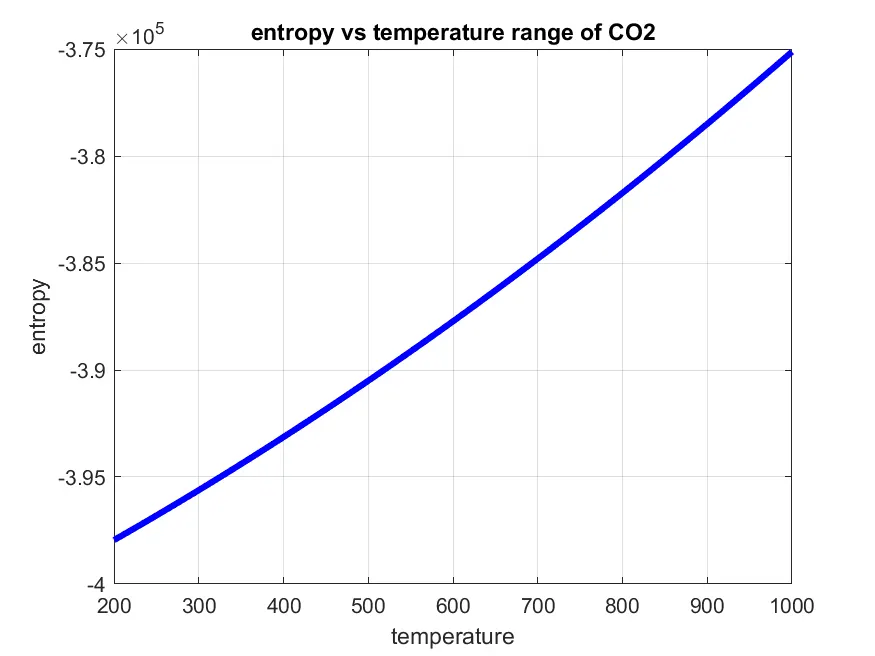
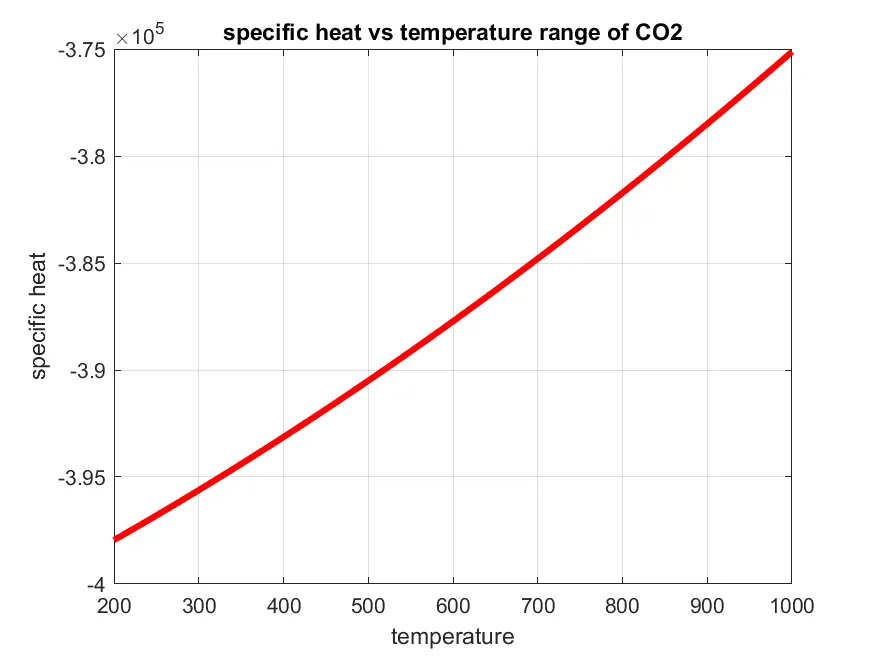
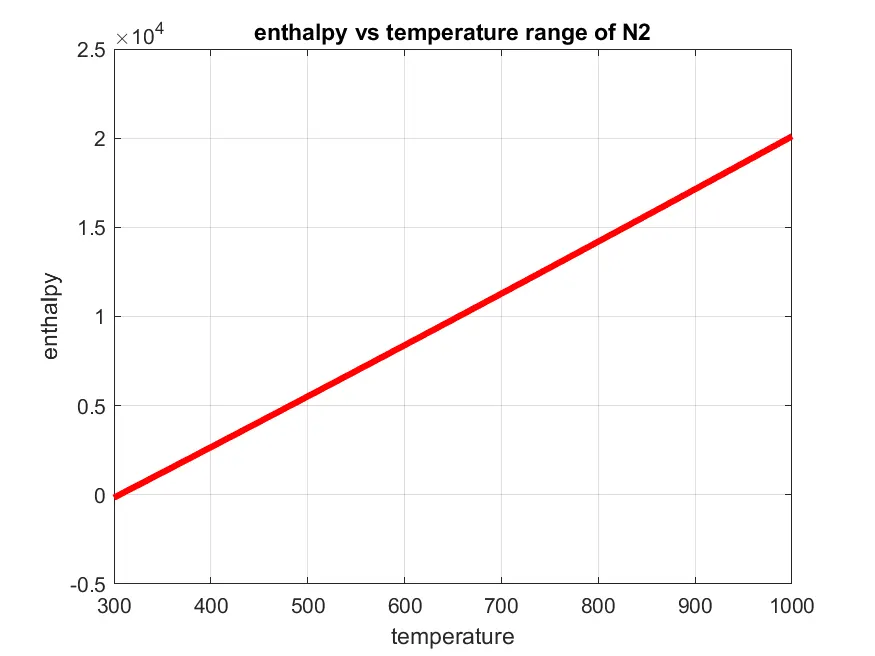
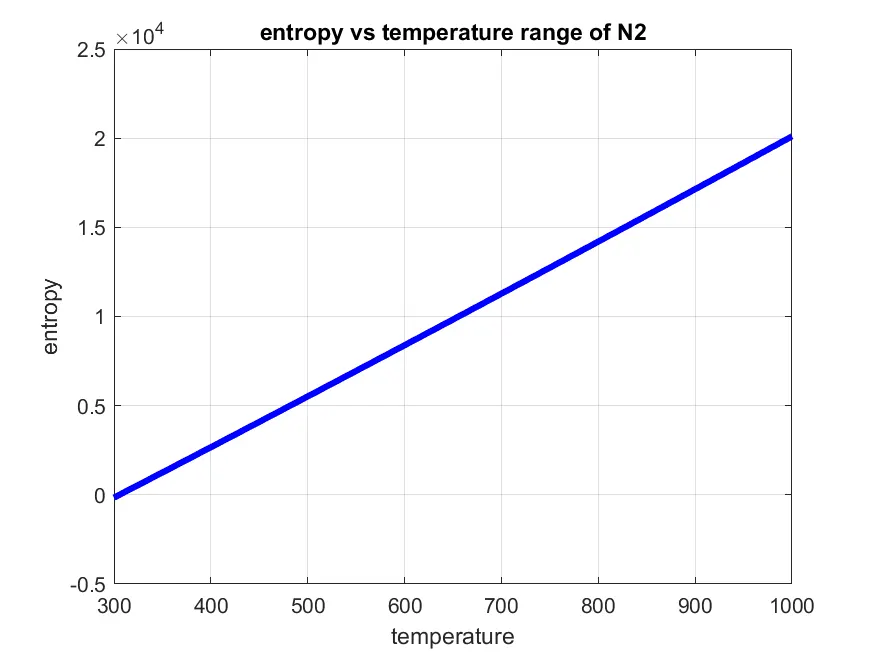
#To plot the variation of these parametres with respect to global temperature range.
#Local temperature ranges is taken not global temperature ranges.
#To calculate the molecular mass of each element/compound.
#Plots are saved in seperate folder with proper element name.
FORMULA:
`(Cp)/r = a1+a2.T+a3.T^2+a4.T^3+a5.t^4`
`H/(RT)=a1+a2.T/2+a3.T^2/3+a4.T^3/4+a5.T^4/5+a6/t`
`S/R = a1.logT+a2.T+a3.T^2/2+a4.T^3/3+a5.T^4/4+a7`
where,
The formula is written in function to make the code easier
The a1,a2,a3,a4,a5,a6 and a7 are the numerical coefficient supplied
In NASA thermodynamics. The first seven numbers starting on the second line of each element entry five of the second line and the first two of the third line are the seven coefficients a1 through a7, respectively for the high temperature range above 5000k, the upper boundary is specified on the first line of the element entry the following seven numbers are the coefficients a1 through a9 respectively for low temperature range below 300k , the lower boundary is specified in the first line of the element entry.
The first five lines of the file gives information about global temperature range. From the 6th line onwards till “END”, the element information are provided 4 lines in a specific data.
function[cp,H,S] = temperature_reading(a1,a2,a3,a4,a5,a6,a7,b1,b2,b3,b4,b5,b6,b7,R,Tavg,local_mid_temp)
for i = 1:length(Tavg)
 if Tavg(i) > local_mid_temp
 cp(i)= R*(a1+a2*Tavg(i)+a3*(Tavg(i))^2+a4*(Tavg(i))^3+a5*(Tavg(i))^4);
 H(i)=R*Tavg(i)*(a1+a2*(Tavg(i)/2)+a3*(Tavg(i)^2/3)+a4*(Tavg(i)^3/4)+a5*(Tavg(i)^4/5)+a6/Tavg(i));
 s(i)=R*(a1*log(Tavg(i))+a2*Tavg(i)+a3*(Tavg(i)^2/2)+a4*(Tavg(i)^3/3)+a5*(Tavg(i)^4/4)+a7);
 else
 cp(i)=R*(b1+b2*Tavg(i)+b3*(Tavg(i)^2)+b4*(Tavg(i)^3)+b5*Tavg(i)^4);
 H(i)=R*Tavg(i)*(b1+b2*((Tavg(i))/2+b3*((Tavg(i))^2)/3+b4*((Tavg(i))^3)/4+b5*(Tavg(i))^4)/5+b6/Tavg(i));
 s(i)=R*(b1*log(Tavg(i))+b2*Tavg(i)+b3*(Tavg(i)^2/2)+b4*(Tavg(i)^3/3)+b5*(Tavg(i)^4/4)+b7);
 end
end

end
# By writting the above function here we will bw calculating the entalpy, entropy, specific heat by using a single function and for loop is used so can able to calculate the value of Tavg.
#Tavg range from local low tempersture to local high temperature
# if condition used here is to find out local low coefficients which is used to calculate the higher coefficients.
%calculating specific heat, enthalpy, entropy
[cp,H,S]=temperature_reading(a1,a2,a3,a4,a5,a6,a7,b1,b2,b3,b4,b5,b6,b7,R,Tavg,local_mid_temp)
Main program for file parsing data:
clear all
close all
clc

%reading thermo data file
f1 = fopen('THERMO.dat','r')

%header
fgetl(f1);
R=8.314;

%global temperature values
temp = fgetl(f1);
T = strsplit(temp);
global_low_temp = str2num(T{2});
global_mid_temp = str2num(T{3});
global_high_temp =str2num(T{4});

%skipping the comments
for i= 1:3
fgetl(f1);
end

while true
    LINE=fgetl(f1);
    if LINE=="END"
        break
    end


%Reading all the element
 elementname = (strtok(LINE));
 D = strsplit(LINE);

%reading global temperature element
local_low_temp = str2num(D{end-1});
local_mid_temp = str2num(D{end-2});
local_high_temp = str2num(D{end-3});


 %Reading LINE 1 of temperature values
 LINE1 = fgetl(f1);
 a = strfind(LINE1,'E');

 %converting string values to numbers
 a1 = str2num(LINE1(1:a(1)+3));
 a2 = str2num(LINE1 (a(1)+4:a(2)+3));
 a3 = str2num(LINE1 (a(2)+4:a(3)+3));
 a4 = str2num(LINE1 (a(3)+4:a(4)+3));
 a5 = str2num(LINE1 (a(4)+4:a(5)+3));

 %Reading LINE2 of tempreature values
 LINE2 = fgetl(f1);
 b = strfind(LINE2,'E');

%converting string values to numbers
 a6 = str2num(LINE2(1:b(1)+3));
 a7 = str2num(LINE2 (b(1)+4:b(2)+3));
 b1 = str2num(LINE2 (b(2)+4:b(3)+3));
 b2 = str2num(LINE2 (b(3)+4:b(4)+3));
 b3 = str2num(LINE2 (b(4)+4:b(5)+3));


 %Reading LINE3 of tempreature values
 LINE3 = fgetl(f1);
 c = strfind(LINE3,'E');

%converting string values to numbers
 b4 = str2num(LINE3(1:c(1)+3));
 b5 = str2num(LINE3 (c(1)+4:c(2)+3));
 b6 = str2num(LINE3 (c(2)+4:c(3)+3));
 b7 = str2num(LINE3 (c(3)+4:c(4)+3));

 %Defining temperature range for calculations
 Tavg = linspace(local_low_temp, local_high_temp, 100);

 %calculating specific heat, enthalpy, entropy

%  [cp,H,S] = temperature_reading(a1,a2,a3,a4,a5,a6,a7,b1,b2,b3,b4,b5,b6,b7,R,Tavg,local_mid_temp);
for i = 1:length(Tavg)
 if Tavg(i) > local_mid_temp
 cp(i)= R*(a1+a2*Tavg(i)+a3*(Tavg(i))^2+a4*(Tavg(i))^3+a5*(Tavg(i))^4);
 H(i)=R*Tavg(i)*(a1+a2*(Tavg(i)/2)+a3*(Tavg(i)^2/3)+a4*(Tavg(i)^3/4)+a5*(Tavg(i)^4/5)+a6/Tavg(i));
 s(i)=R*(a1*log(Tavg(i))+a2*Tavg(i)+a3*(Tavg(i)^2/2)+a4*(Tavg(i)^3/3)+a5*(Tavg(i)^4/4)+a7);
 else
 cp(i)=R*(b1+b2*Tavg(i)+b3*(Tavg(i)^2)+b4*(Tavg(i)^3)+b5*Tavg(i)^4);
 H(i)=R*Tavg(i)*(b1+b2*((Tavg(i))/2+b3*((Tavg(i))^2)/3+b4*((Tavg(i))^3)/4+b5*(Tavg(i))^4)/5+b6/Tavg(i));
 s(i)=R*(b1*log(Tavg(i))+b2*Tavg(i)+b3*(Tavg(i)^2/2)+b4*(Tavg(i)^3/3)+b5*(Tavg(i)^4/4)+b7);
 end
end


 %plotting graph for entropy,enthalpy,specific heat
 %creating seperate folder and files for molecular data for elements

 mkdir(['C:\Users\Skill-Lync\Documents\MATLAB\Nasa file parsing\',elementname]);

 figure (1)
 plot(Tavg,H,'linewidth',3,'color','r')
 title(sprintf('specific heat vs temperature range of %s',elementname))
 xlabel('temperature')
 ylabel('specific heat')
 grid on

 figure (2)
 plot(Tavg,H,'linewidth',3,'color','r')
 title(sprintf('enthalpy vs temperature range of %s',elementname))
 xlabel('temperature')
 ylabel('enthalpy')
 grid on

 figure (3)
 plot(Tavg,H,'linewidth',3,'color','b')
 title(sprintf('entropy vs temperature range of %s',elementname))
 xlabel('temperature')
 ylabel('entropy')
 grid on

 cd(['C:\Users\Skill-Lync\Documents\MATLAB\Nasa file parsing\',elementname]);
saveas(1,'Tavg vs Specific_heat.png')
saveas(2,'Tavg vs Enthalpy.png')
saveas(3,'Tavg vs Entropy.png')
cd('C:\Users\Skill-Lync\Documents\MATLAB');

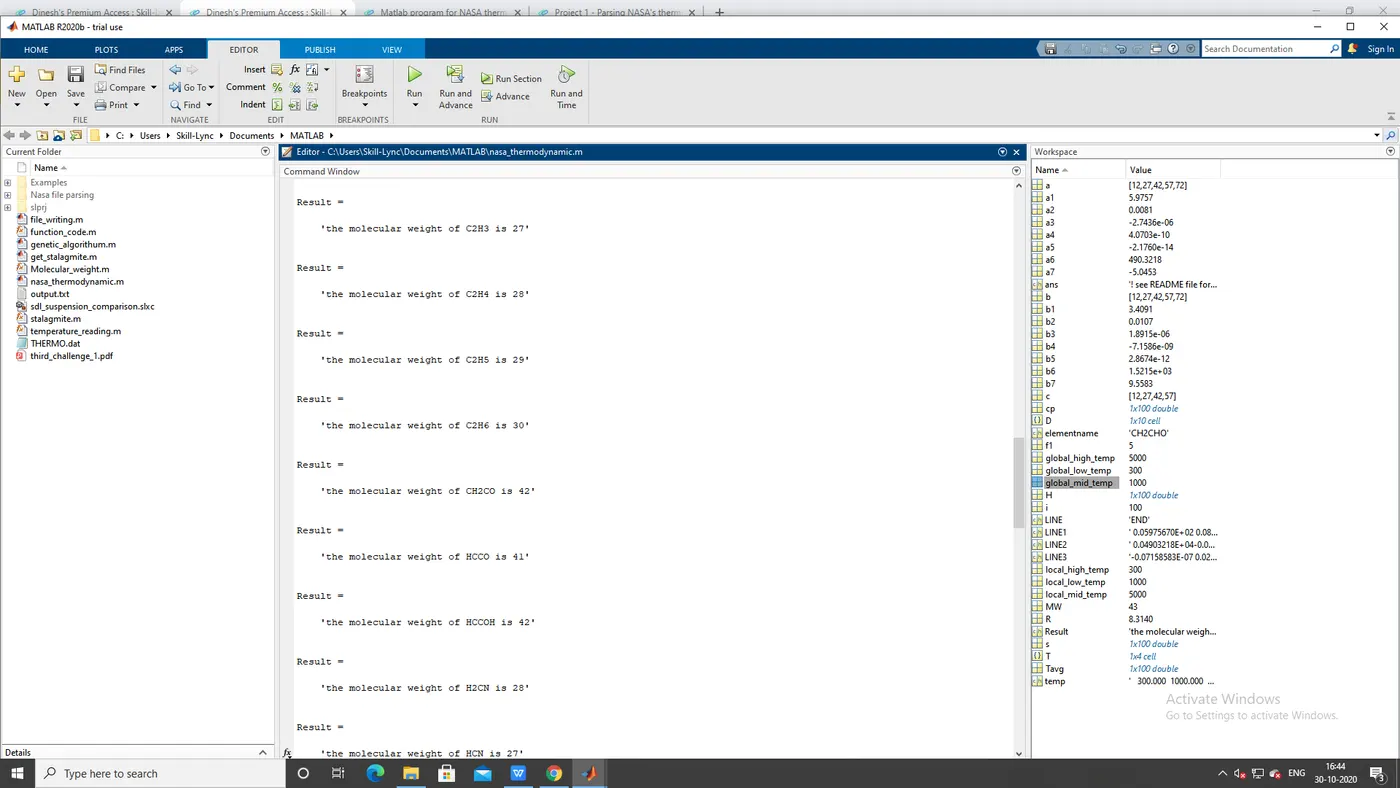
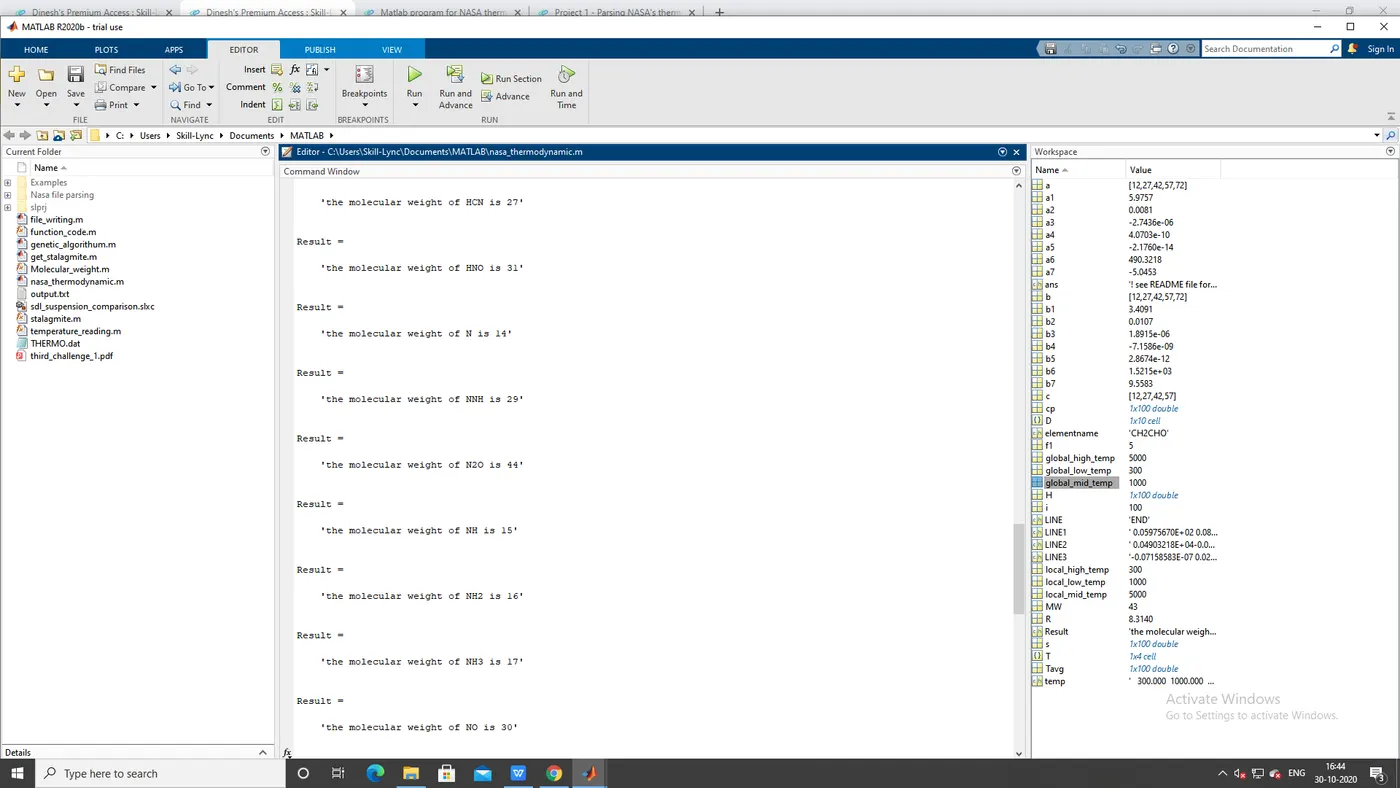
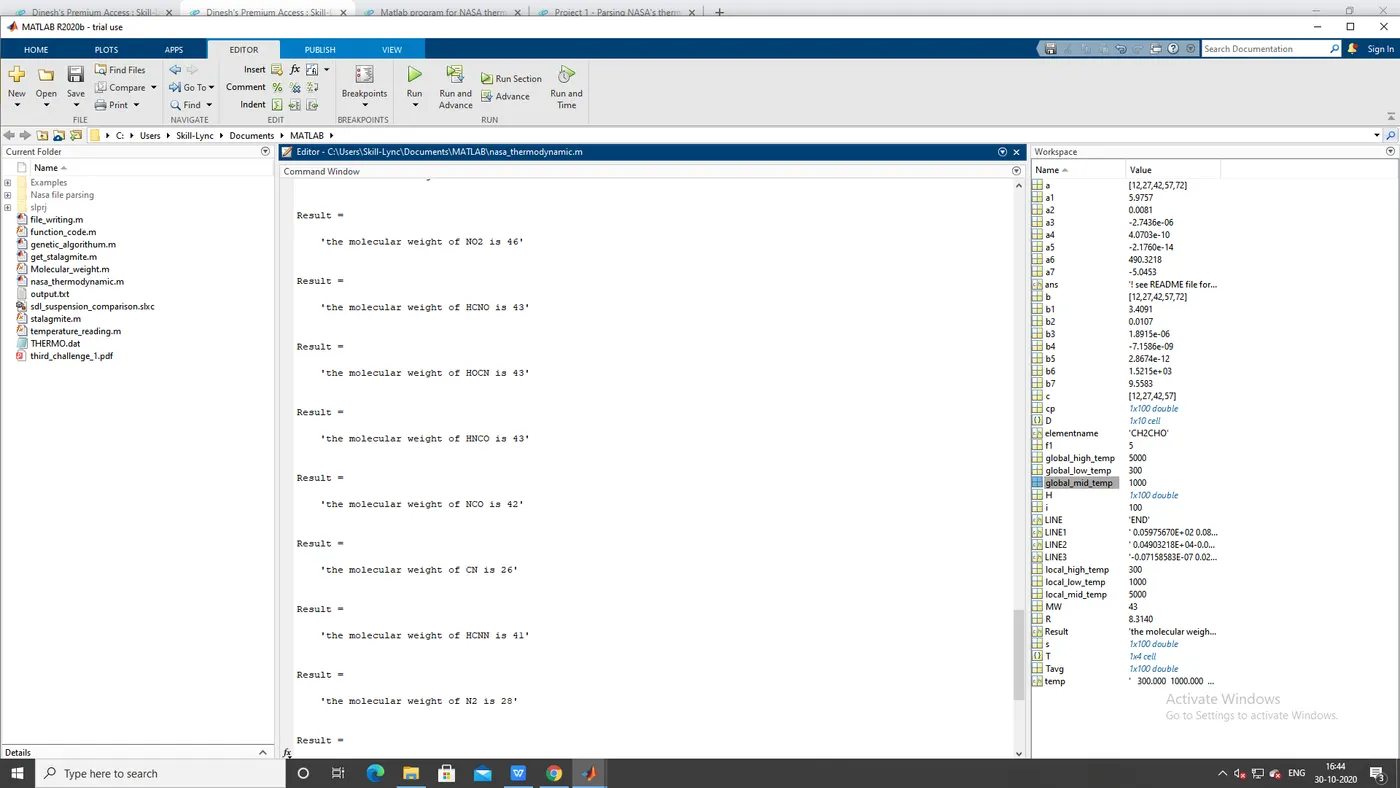
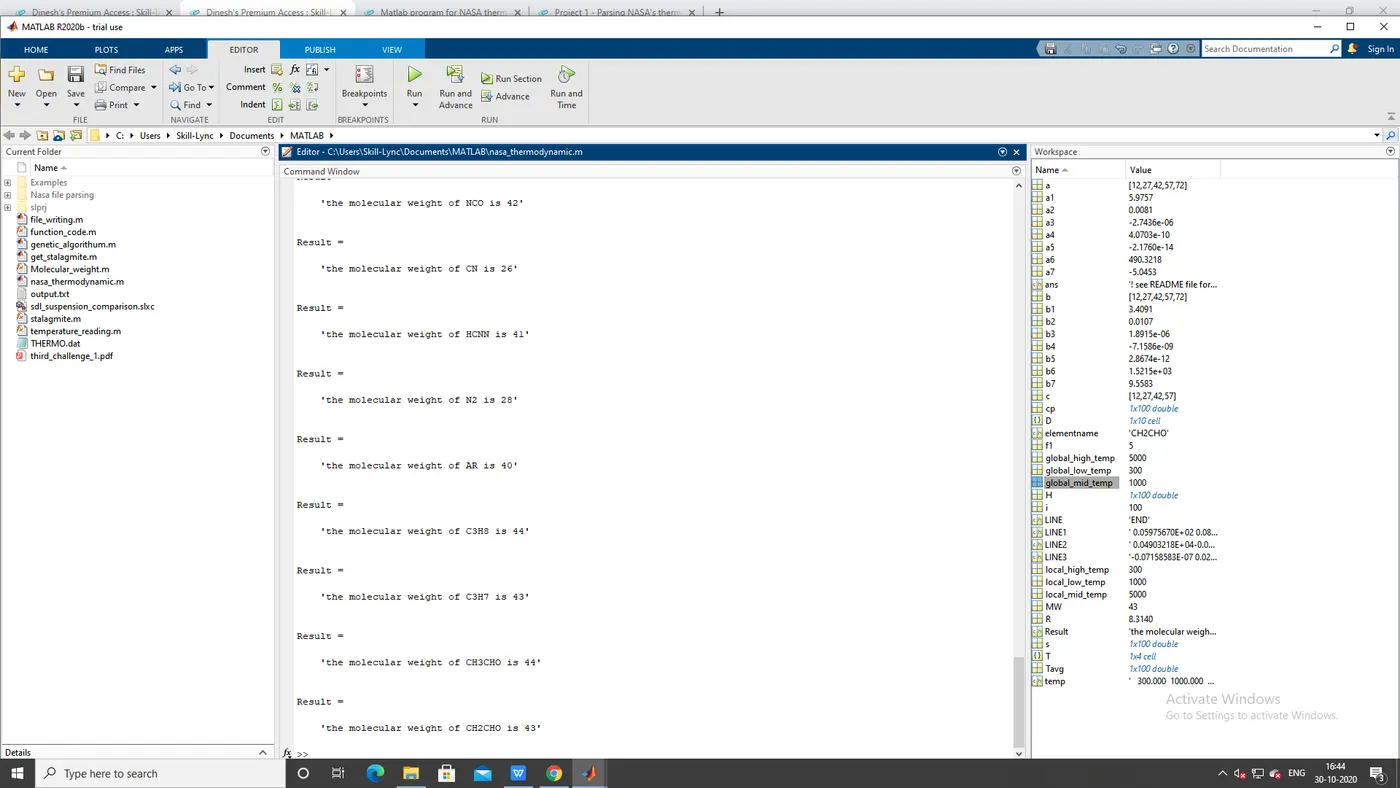
MW = Molecular_weight(elementname);
Result = sprintf('the molecular weight of %s is %d',elementname,MW)


end
STEPS:
1.First open the given thermodynamic data and read the data in a file and store the data in a variable file
2.Then read the header file of the thermodynamic data and calculate the global low,mid and high
3.Certain header lines were skipped which were of no use
4.Using fgetl(), strsplit(), strfind and str2double()the value of local low, mid and high temperature were stored in a variable
5.Then the 14 coefficient of each element were stored in their respective variable
6.First the loop is executed for calculating 14 coefficients of each elements
7. mkdir will create the folder with givwn element name
8. These files store the graph of each element for the entropy, entalpy and specific heat for the temperature
9.Fgetl() function was used to read coefficients in 1st line, then strfind() was used to find the exponent ‘E’ by using this we can store the coefficient in the respective variable
10.sprint f is used to change the anme for each element while generating plot in each loop
11.Once the coefficient was found out it was converted into decimal number using str2double() function
12.str2num is used to calculate the local temperature for local low,mid,and high range
13.By doing the above steps we can store the coefficients into respective variables
14.Once the coefficient were found out, then we can calculate the specific heat, entropy and enthalpy by taking gas constant R=8.314 J/mol-k and temperature a linspace() function of lower temp to high temp
15.Once the value of specific heat, entropy and enthalpy is found out now we can plot graphs between specific heat, temperature,enthalpy vs temperature
16.The threeplots were stored in folder having the name element
17.finally molecular mass of each element was calculated and displayed in command window.
Function to calculate molecular mass of element:
function[MW] = Molecular_weight(elementname);
Atoms = ['O','H','C','N','A'];
Atomic_number = [16 1 12 14 40];
MW=0;
for i =1:length(elementname);
    for j = 1:length(Atoms);
        if strcmpi(elementname(i),Atoms(j));
            MW=MW+Atomic_number(j);
            position=j;
        end
    end
    n = str2num(elementname(i));
    if n>1;
    MW = MW+Atomic_number(position)*(n-1);
    end
end
# Molecular mass has specific atoms and atomic numbers are to be provided to them.
# The atoms are individual and where its given in data.
OUTPUT:
Location of element folders
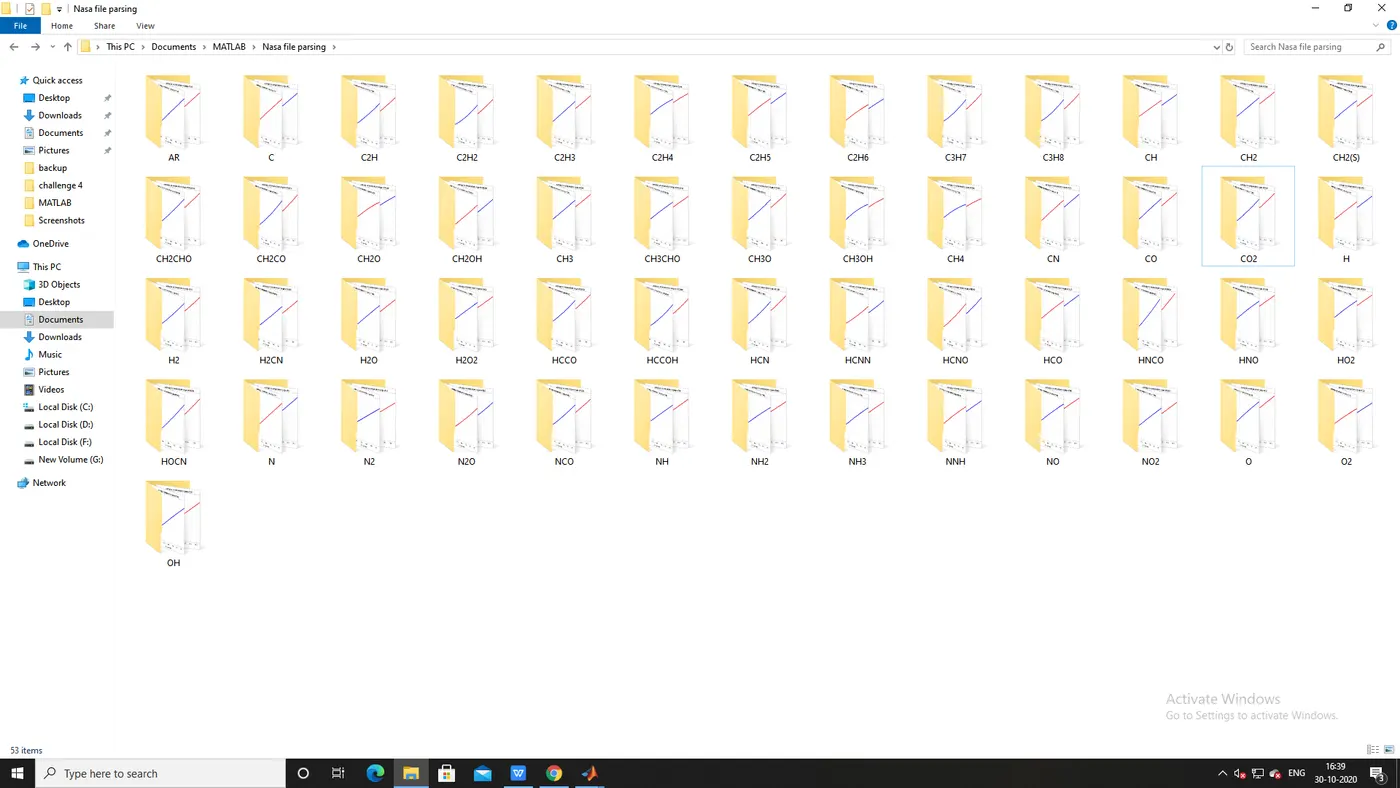
Link acces to the files are given below:
https://drive.google.com/drive/folders/1GNdm1fH08lsz3VHEuHw-fyywkhhIv70E?usp=sharing
Molecular mass displayed in command window:
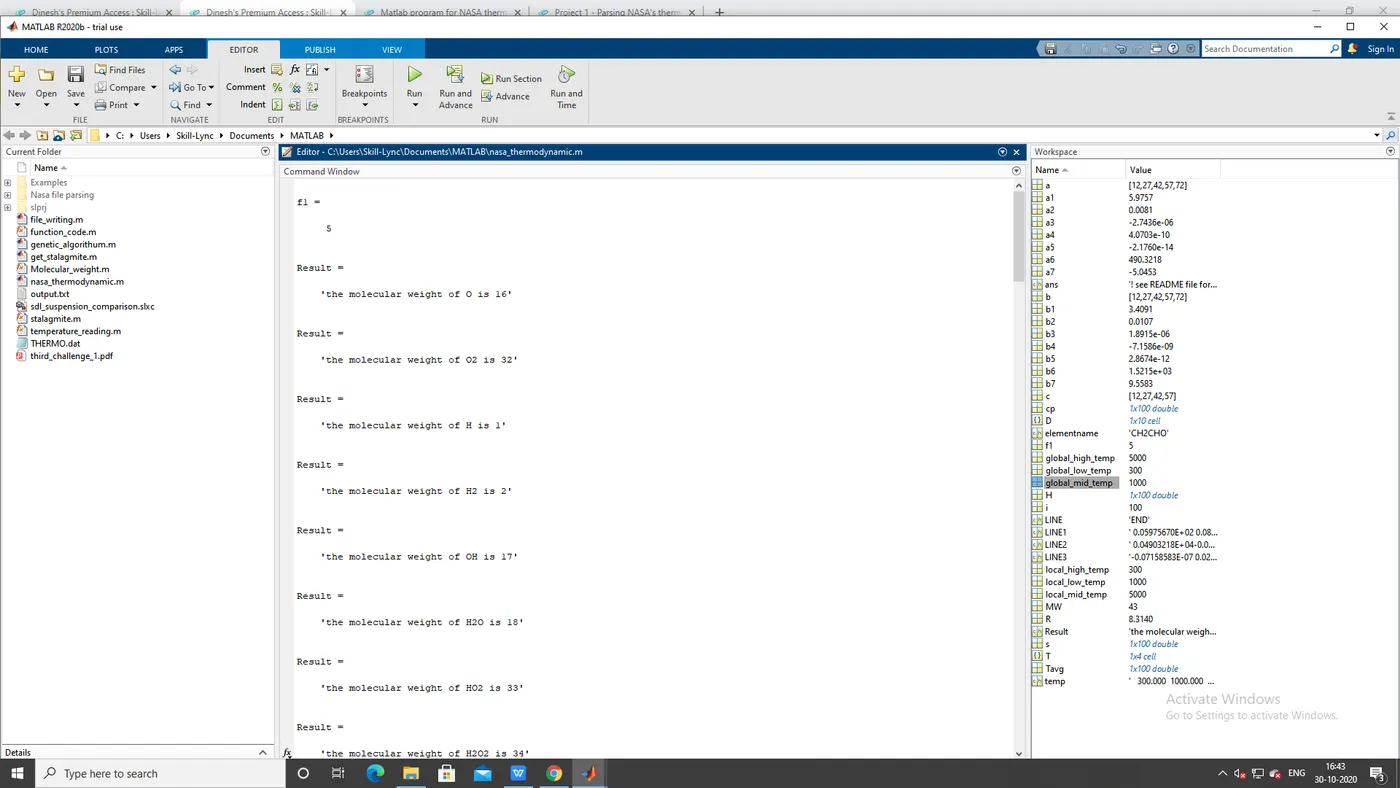
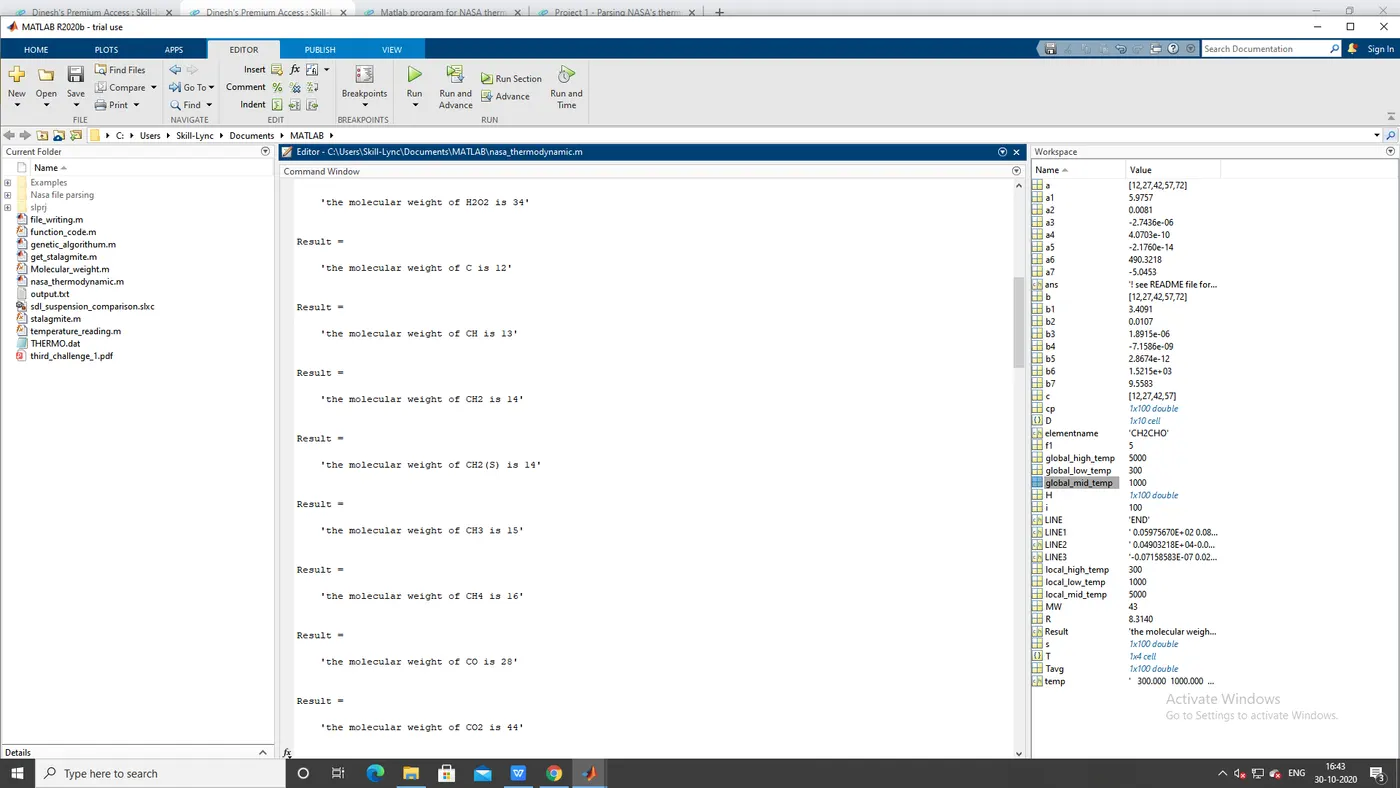
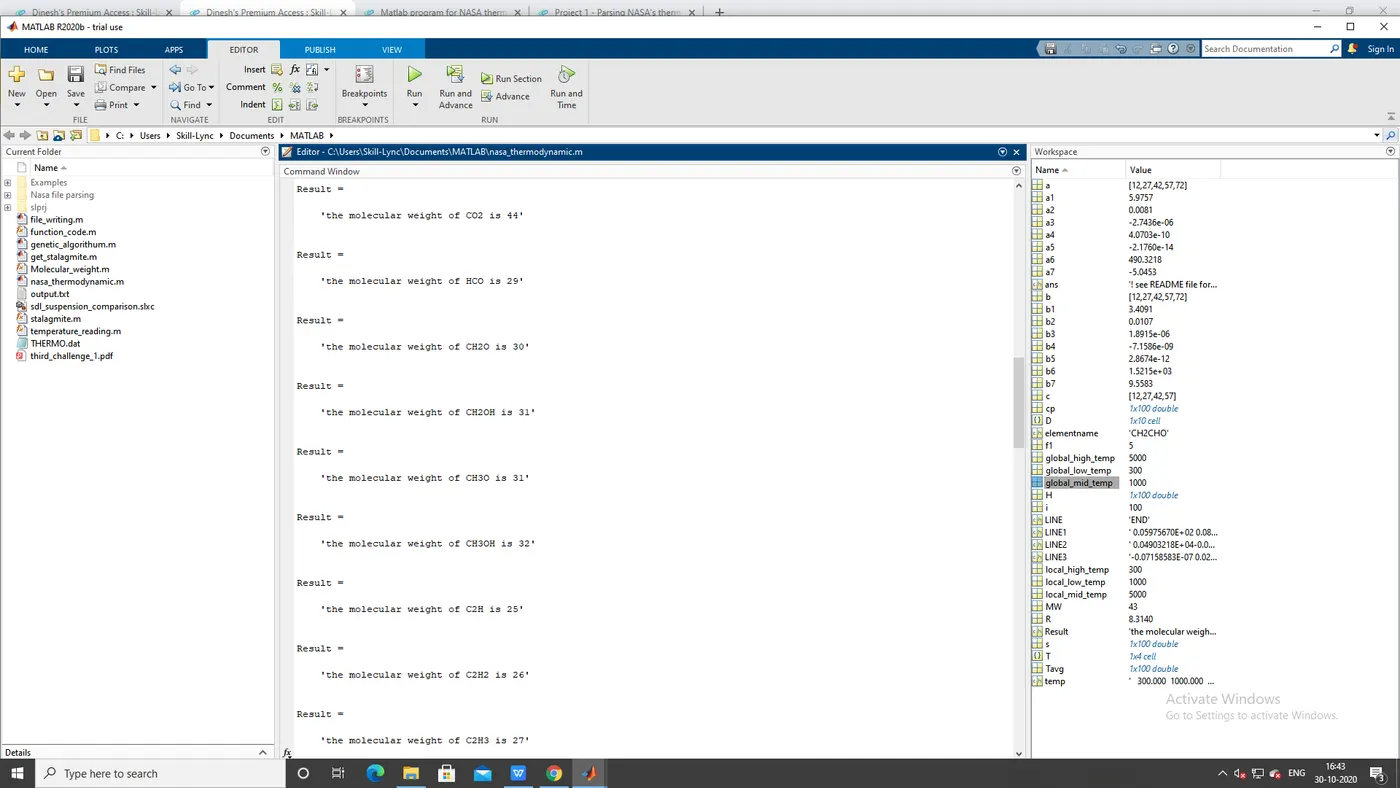
Graphical plot of O2:
Graphical plot of CO2:
Graphical plot of N2:
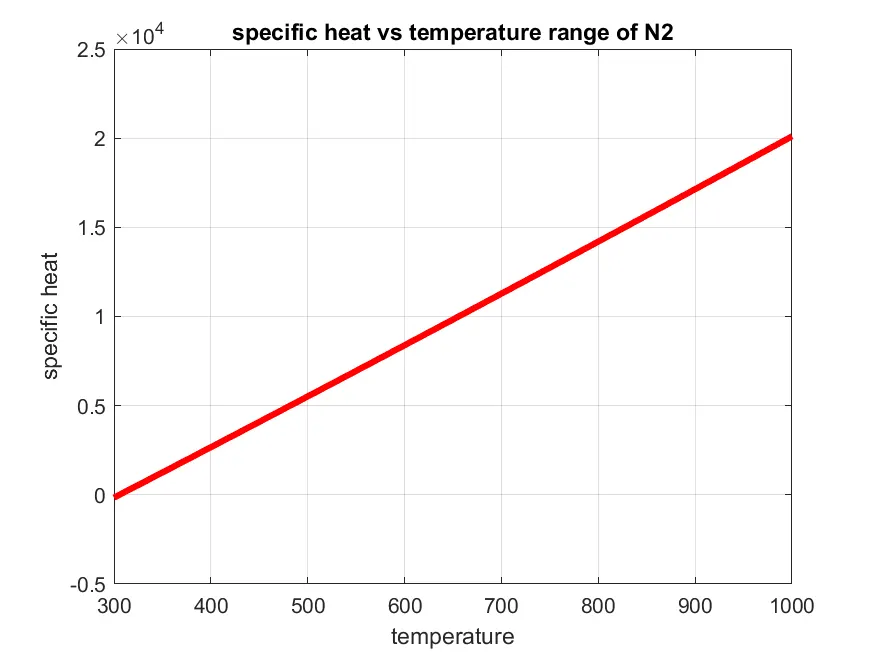
CONCLUSION:
Thus the NASA thermodynamic file parsing data file extracts the coefficients with respect to the temperature graphs and molecular weight are plotted and found.