Parsing NASA thermodynamic data
Aim: Write the function to extract 14 coefficients and evaluate the therrmodynamic properties such as Specific heat, Enthalpy, Entropy using MATLAB and plot the graph of same properties with low and high temperature value.
Objectives:
1. Write a function to extract 14 coefiicients and claculate the Enthalpy, Entropy and Specific heat of all the species.
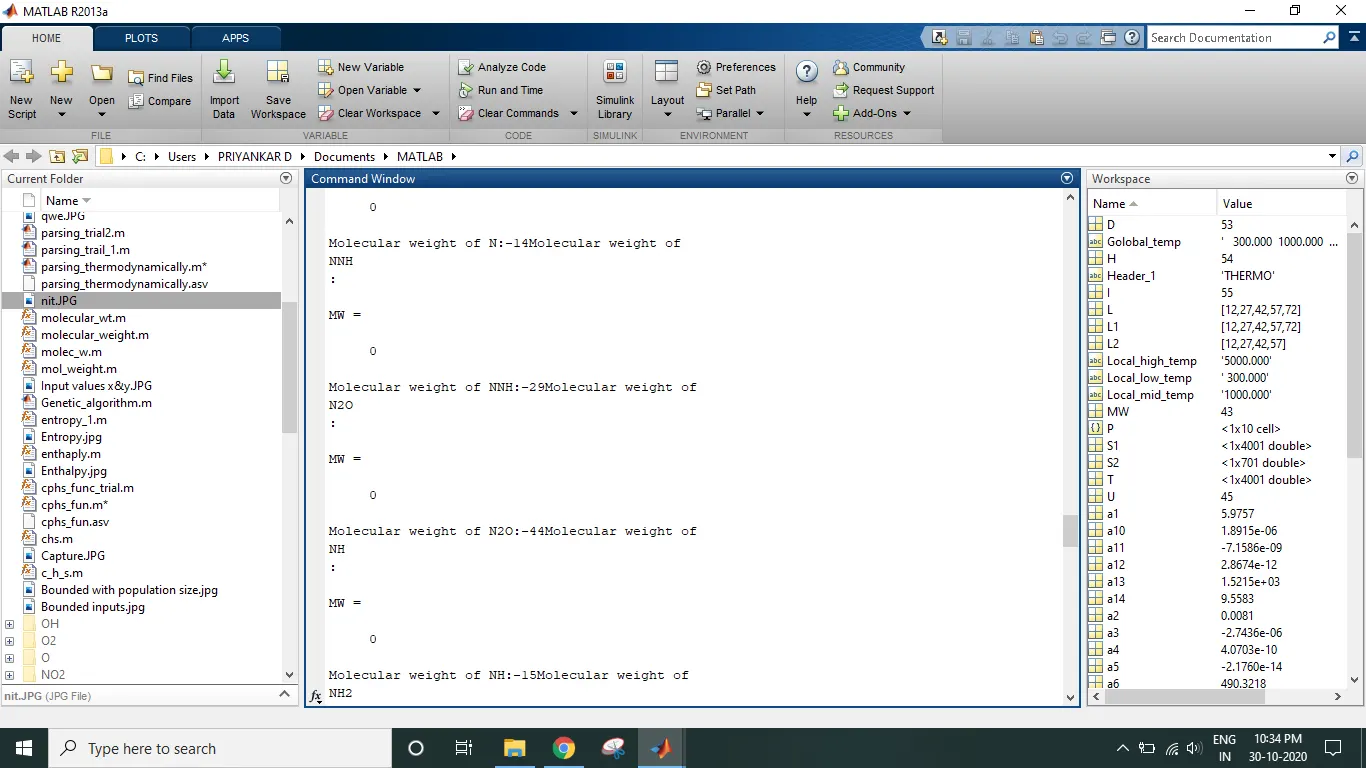
2. Calculate the molecular weight of each species and display it in the command window.
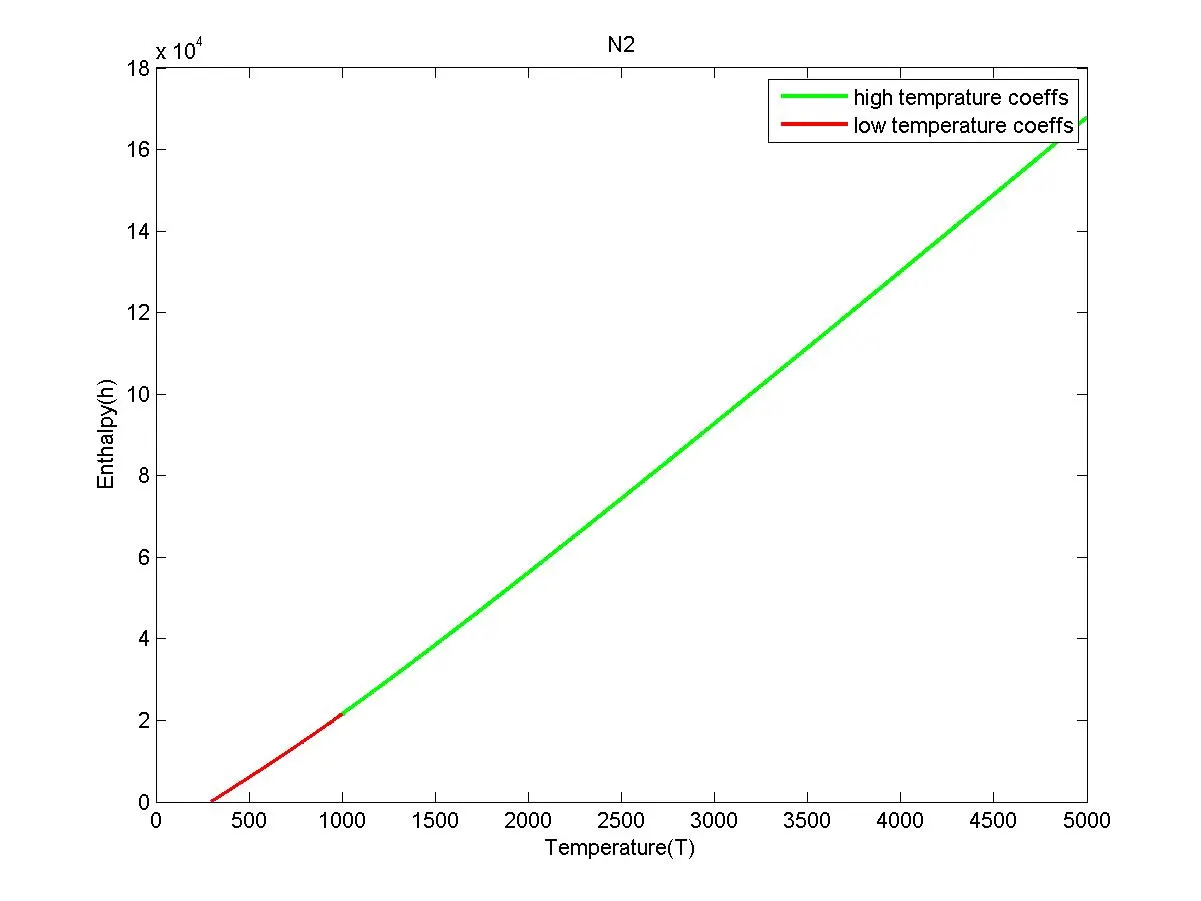
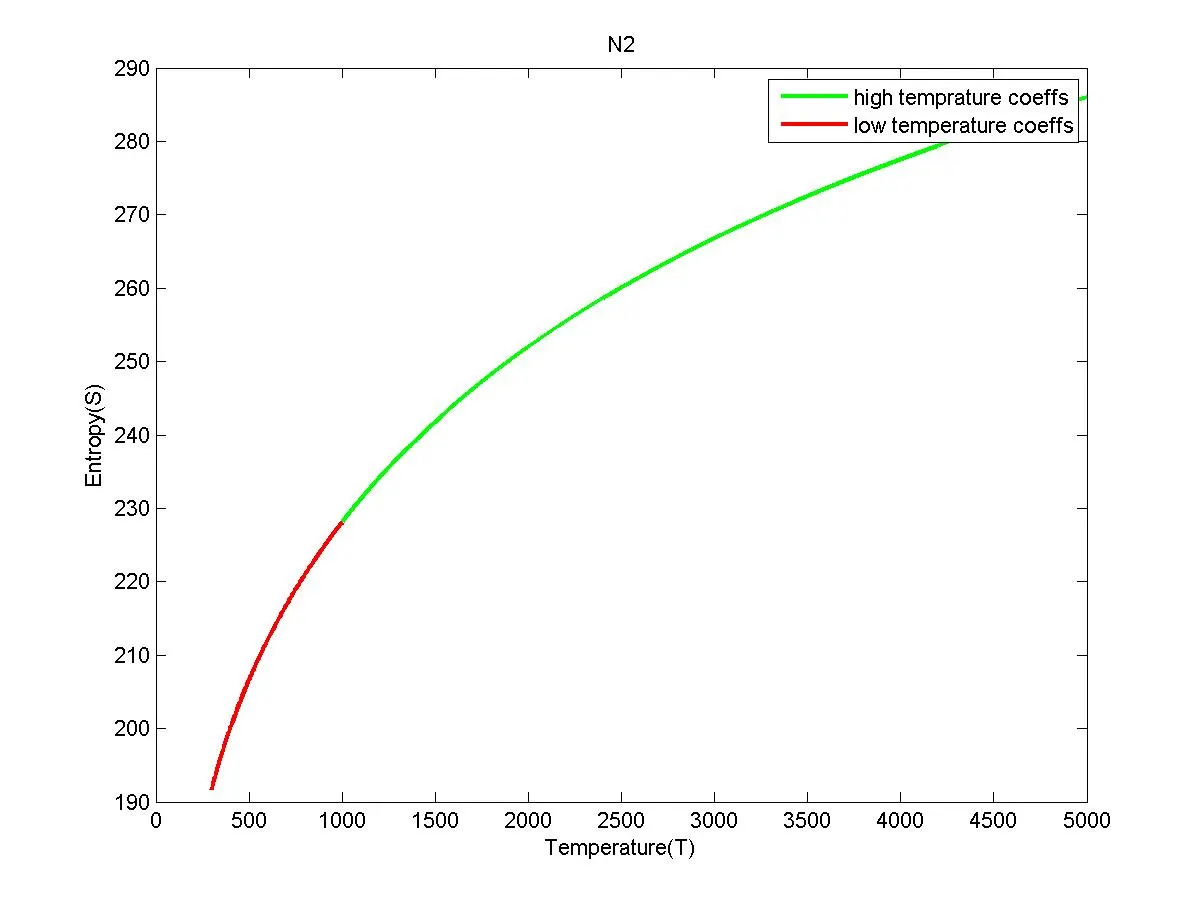
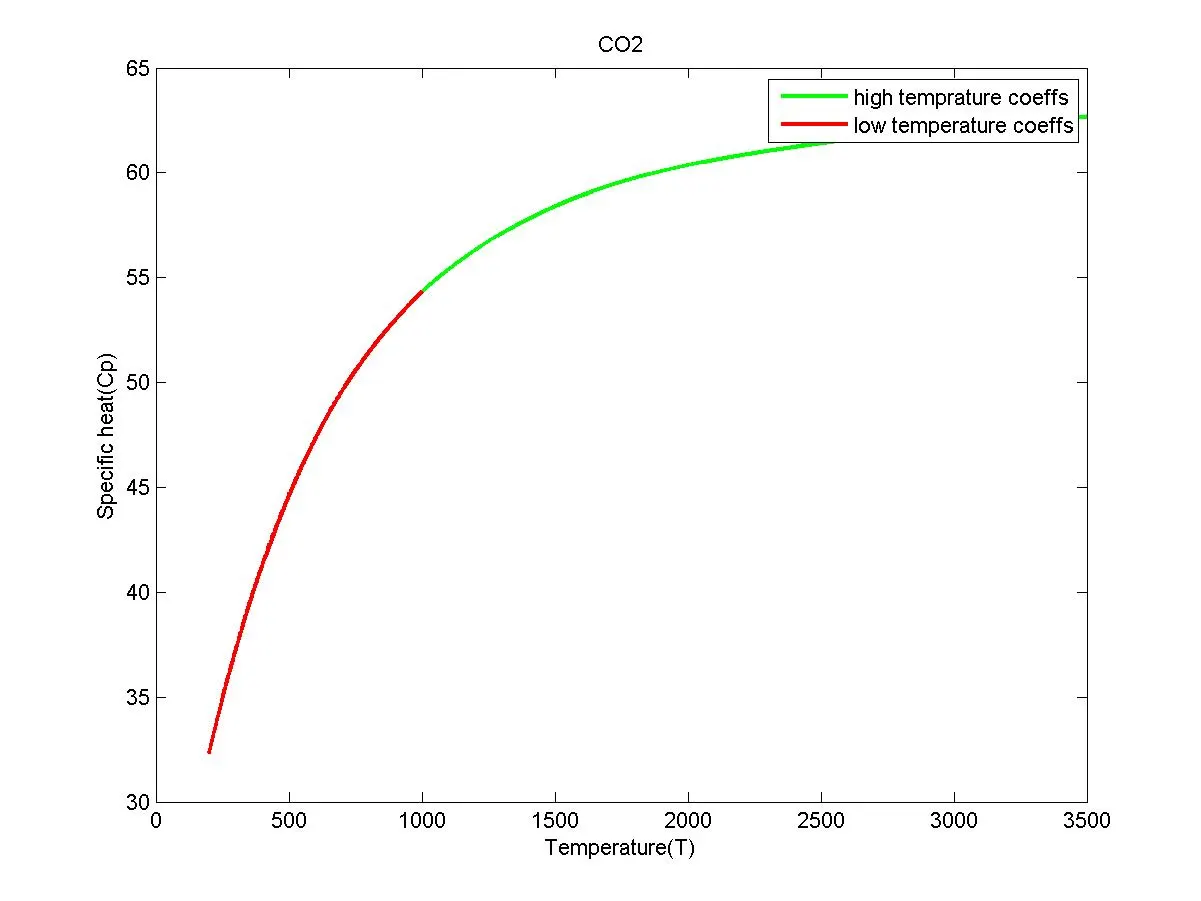
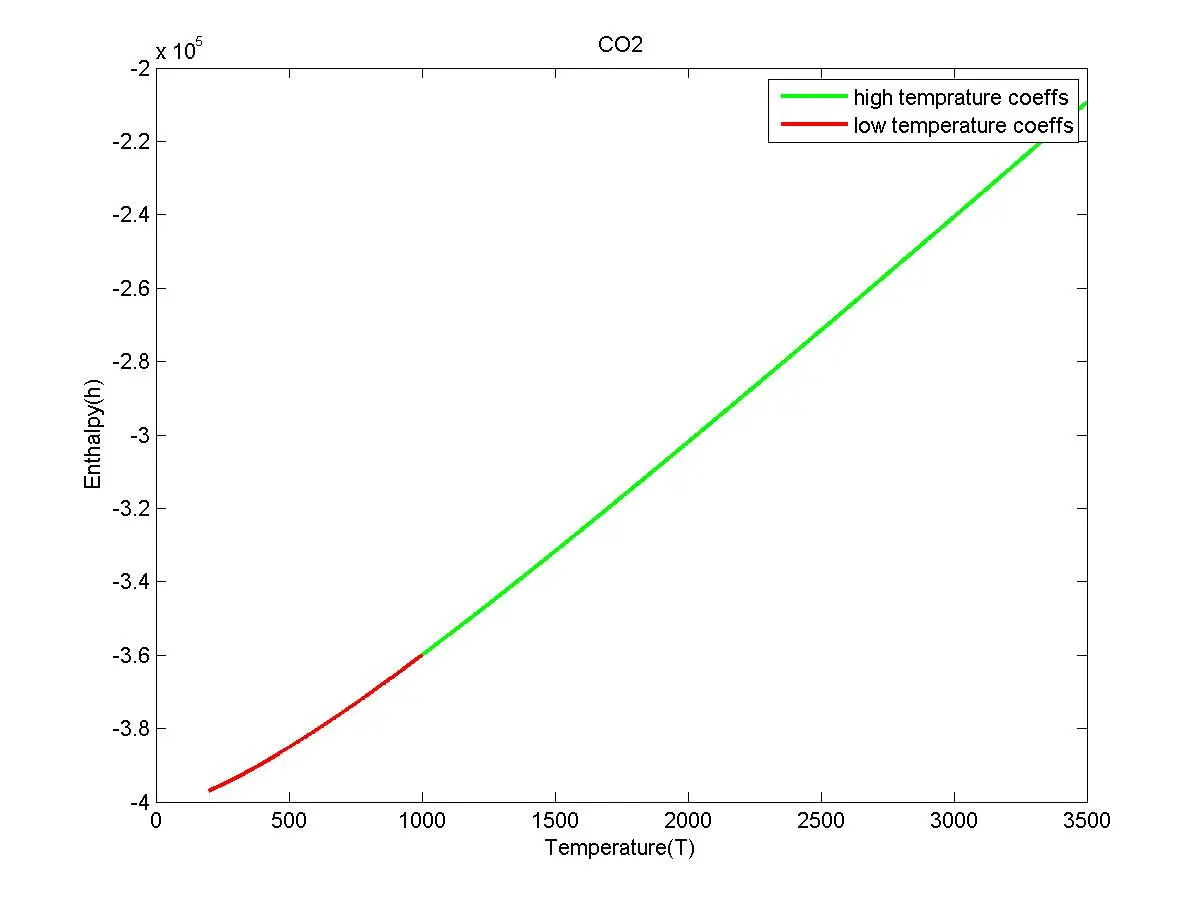
3. Plot the Cp, Enthalpy and Entropy for the local temperature range (low temperature : high temperature) specific for each species.
Theory:
Parse means:
In order for the code written in human-readable form to be understood by a machine, it must be converted into machine language. Parser is a compiler or interpreter component that breaks data into smaller elements for easy translation into another language. Parse means to break it down into component parts so that its syntax can be analyzed, categorized and understood. A parser is commonly used as a component of an interpreter or a compiler. The overall process of parsing involves three stages:
1. Lexical Analysis: A lexical analyzer is used to produce tokens from a stream of input string characters, which are broken into small components to form meaningful expressions such as +,-,*,"function" or "new" in JavaScript.
2. Syntactic Analysis: Checks whether the generated tokens form a meaningful expression. This makes use of a context-free grammar that defines algorithmic procedures for components. These work to form an expression and define the particular order in which tokens must be placed.
3. Semantic Parsing: The final parsing stage in which the meaning and implications of the validated expression are determined and necessary actions are taken.
Parsers are widely used in the following technologies such as Modelining laguage, Database languages, scripting languages and Java and other programming languages.
Here we are parsing the thermodynamic data formulated by NASA for various species. In the code we will be parsing the data and calculating the coefficients for finding the specific heat, enthalpy, entropy for various species.
Formula:
R = Universal Gas constant = 8.3145`J.mol^-1.K^-1`

STEP-1: Write a function to extract 14 coefiicients and claculate the Enthalpy, Entropy, Specific heat and Molecular weight of all the species using Matlab code.
% Matlab code for file parsing of NASA thermodynamic data
clear all
close all
clc

% Reading thermodynamic data & molecular weight of all species
f1 = fopen('THERMO.dat','r');
species_w = fopen('species_weight.txt','w');
Header_1 = fgetl(f1);
Golobal_temp = fgetl(f1);

% spitting the strings with an cell array od string 'C'
 temp = strsplit(Golobal_temp,' ');

% convert string value into numerical value
global_Low_temp = str2double(temp{2}); % Global low temperature
global_Mid_temp = str2double(temp{3}); % Global middle temperature
global_High_temp = str2double(temp{4}); % Global high temperature

% skipping comment lines
for i = 1:3
    fgetl(f1);
end
g=0;

% extracting the species name
for i = 1:53
    line = fgetl(f1);
    P = strsplit(line, ' ');
    sn = P{1};
    U = strfind(line, 'G');
    Local_low_temp = line(U+3:55);
    Local_high_temp = line(U+13:65);
    Local_mid_temp = line(U+23:75);

% reading the local temperatures
    low_tp = str2num(Local_low_temp); %Local Low Temperature
    high_tp = str2num(Local_high_temp); %Local Mid Temperature
    mid_tp = str2num(Local_mid_temp); %Local High Temperature

    % reading the coefficients
    line1 = fgetl(f1);
    L = strfind(line1,'E'); % find string 'E' within line1
    % extracting the coefficients
    a1 = line1(1:L(1)+3); % string data
    a1 = str2num(a1); % converting into numerical value
    a2 = line1(L(1)+4:L(2)+3);
    a2 = str2num(a2);
    a3 = line1(L(2)+4:L(3)+3);
    a3 = str2num(a3);
    a4 = line1(L(3)+4:L(4)+3);
    a4 = str2num(a4);
    a5 = line1(L(4)+4:L(5)+3);
    a5 = str2num(a5);

    % extracting the coefficients
    line2 = fgetl(f1);
    L1 = strfind(line2,'E'); % find string 'E' within line1
    a6 = line2(1:L1(1)+3); % string data
    a6 = str2num(a6); % converting into numerical value
    a7 = line2(L1(1)+4:L1(2)+3);
    a7 = str2num(a7);
    a8 = line2(L1(2)+4:L1(3)+3);
    a8 = str2num(a8);
    a9 = line2(L1(3)+4:L1(4)+3);
    a9 = str2num(a9);
    a10 = line2(L1(4)+4:L1(5)+3);
    a10 = str2num(a10);

    % extracting the coefficients
    line3 = fgetl(f1);
    L2 = strfind(line3,'E'); % find string 'E' within line1
    a11 = line3(1:L2(1)+3); % string data
    a11 = str2num(a11); % converting into numerical value
    a12 = line3(L2(1)+4:L2(2)+3);
    a12 = str2num(a12);
    a13 = line3(L2(2)+4:L2(3)+3);
    a13 = str2num(a13);
    a14 = line3(L2(3)+4:L2(4)+3);
    a14 = str2num(a14);

    % Higher temperature coefficients is a1 to a7
    % Lower temperature coefficients is a8 to a14

    % calculate of specific heat, enthapy, entropy using high mid and low
    % temperature
    [T,t,cp1,cp2,h1,h2,S1,S2] = cphs_fun(a1,a2,a3,a4,a5,a6,a7,a8,a9,a10,a11,a12,a13,a14,low_tp,mid_tp,high_tp);

    % calculate the molecular weight of all the species
    MW = molecular_wt(sn);
    fprintf(species_w,'molecular weight of %s is %f',sn,MW);

    % plootting & saving
    cur_dir = pwd;

    % assigning counter variable for obtaining figures
    g=g+1;

    % making a new folder for each species
    mkdir(sn);
    cd(sn);

    % plot of each species with all the species
    % plot of temperature vs specific heat
    D=figure(g);
    plot(T, cp1,'g',t, cp2,'r','linewidth',2)
    title(sn)
    xlabel('Temperature(T)')
    ylabel('Specific heat(Cp)')
    legend('high temprature coeffs','low temperature coeffs','location','northeast')

    % plot of temperature vs enthalpy
    H=figure(g+1);
    plot(T, h1,'g',t, h2,'r','linewidth',2)
    title(sn)
    xlabel('Temperature(T)')
    ylabel('Enthalpy(h)')
    legend('high temprature coeffs','low temperature coeffs','location','northeast')

    % plot of temperature vs entropy
    I=figure(g+2);
    plot(T, S1,'g',t, S2,'r','linewidth',2)
    title(sn)
    xlabel('Temperature(T)')
    ylabel('Entropy(S)')
    legend('high temprature coeffs','low temperature coeffs','location','northeast')

    % saving the plots in separate folder for each species
    saveas(g,'Specific heat.jpg');
    saveas(g+1,'Enthalpy.jpg');
    saveas(g+2,'Entropy.jpg');

    cd(cur_dir);

    % printing the molecular weight of the species
    sprintf('molecular weight of %s = %f',sn,MW);

end

 % closing the file
 fclose(f1);
 fclose(species_w);
Function to claculate Specific heat, Enthalpy and Entropy using local tempeartures:
function [T,t,cp1,cp2,h1,h2,S1,S2] = cphs_fun(a1,a2,a3,a4,a5,a6,a7,a8,a9,a10,a11,a12,a13,a14,low_tp,mid_tp,high_tp)
R = 8.3145; % universal gas constant in J/mole-k
low = low_tp;
mid =  mid_tp;
high = high_tp;
t = (low:1:mid);
T = (mid:1:high);

cp1 = (a1+a2.*T+a3.*T.^2+a4.*T.^3+a5.*T.^4).*R;

h1 = (a1.*T+a2.*(T.^2)/2+a3.*(T.^3)/3+a4.*(T.^4)/4+a5.*(T.^5)/5+a6).*R;

S1 = (a1.*log(T)+a2.*T+(a3.*(T.^2)/2)+(a4.*(T.^3)/3)+(a5.*(T.^4)/4)+a7).*R;

cp2 = (a8+a9.*t+a10.*t.^2+a11.*t.^3+a12.*t.^4).*R;

h2 = (a8.*t+a9.*(t.^2)/2+a10.*(t.^3)/3+a11.*(t.^4)/4+a12.*(t.^5)/5+a13).*R;

S2 = (a8.*log(t)+a9.*t+(a10.*(t.^2)/2)+(a11.*(t.^3)/3)+(a12.*(t.^4)/4)+a14).*R;

end
Function to calculate Molecular weight of all the species:
function [MW] = molecular_wt(sn);
    elements = {'O','H','C','N','S','A'};
    disp('Molecular weight of');
    disp(sn);
    disp(':');
    Atomic_weight = [16, 1, 12, 14, 32, 40];
    % Declaring atomic weight value
    MW = 0 % declaring molecular weight is '0' in intial stage
    for i= 1:length(sn)
        for j= 1:length(elements)
            if strcmp(sn(i),elements(j))
                MW = MW + Atomic_weight(j);
               a = j;
            end
        end
        % adding the weights to the repating elements
        n=str2double(sn(i));
        if n>1
            MW = MW + (Atomic_weight(a))*(n-1);
        end
    end
    fprintf('Molecular weight of %s:-',sn);
    fprintf('%d',MW);
    disp('');
    end
STEP-2:
OUTPUT: The following output is obtained after running above Matlab code
1. calculation of Molecular weight of some species displayed in command window.
calculation of Molecular weight of 53 species displayed in text file.
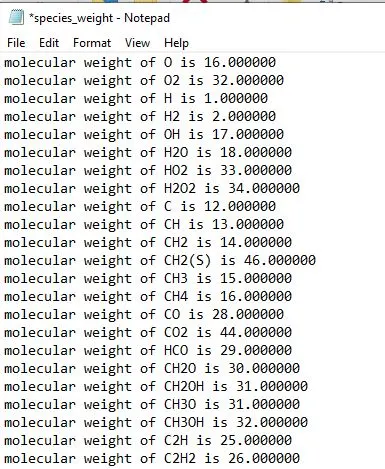
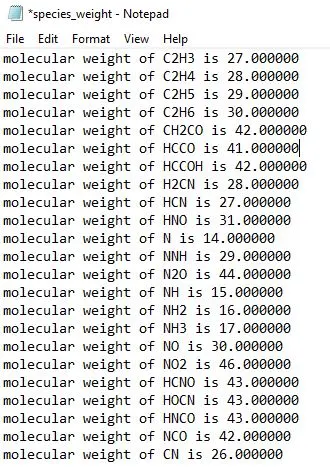
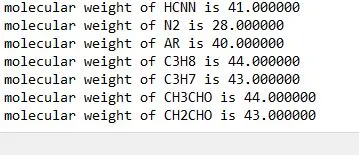
2. Scrrenshot showing location of folders created for all the species.

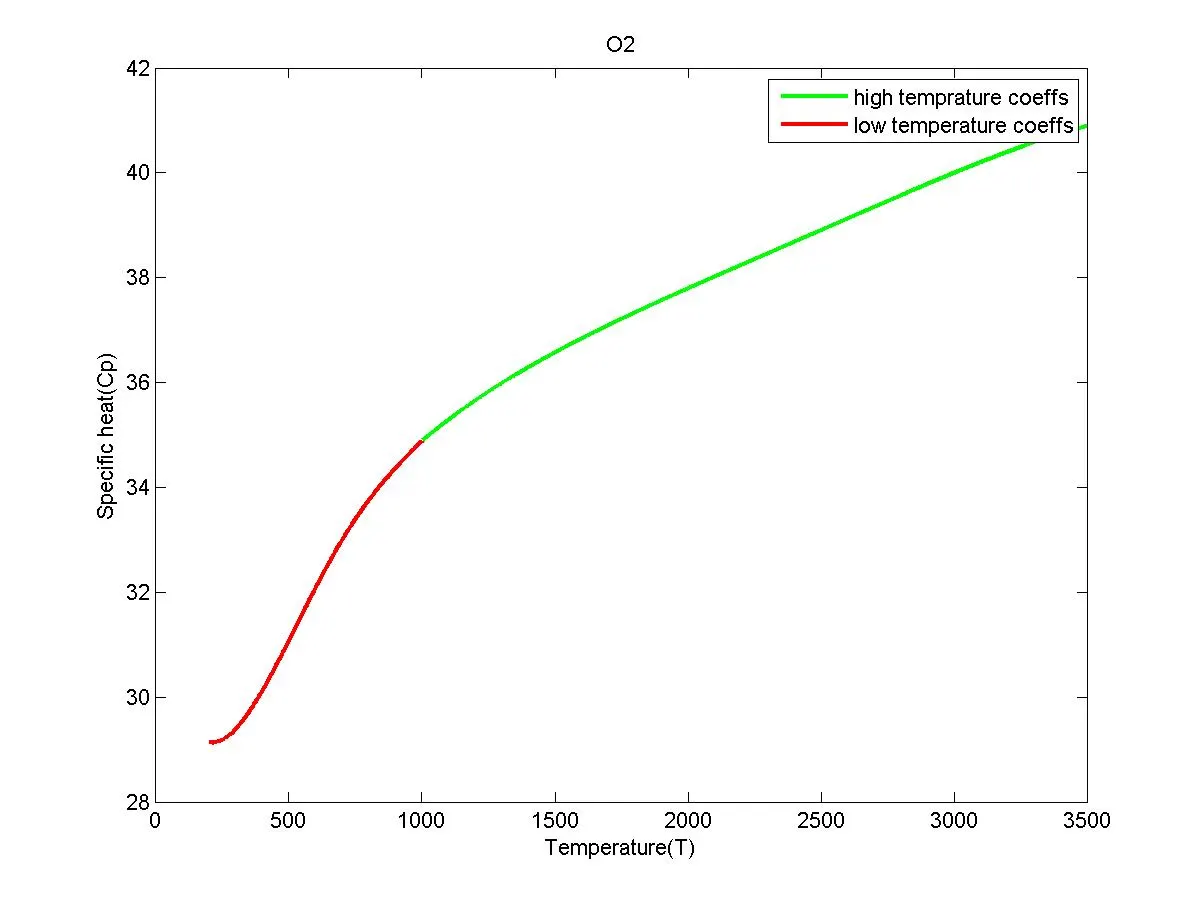
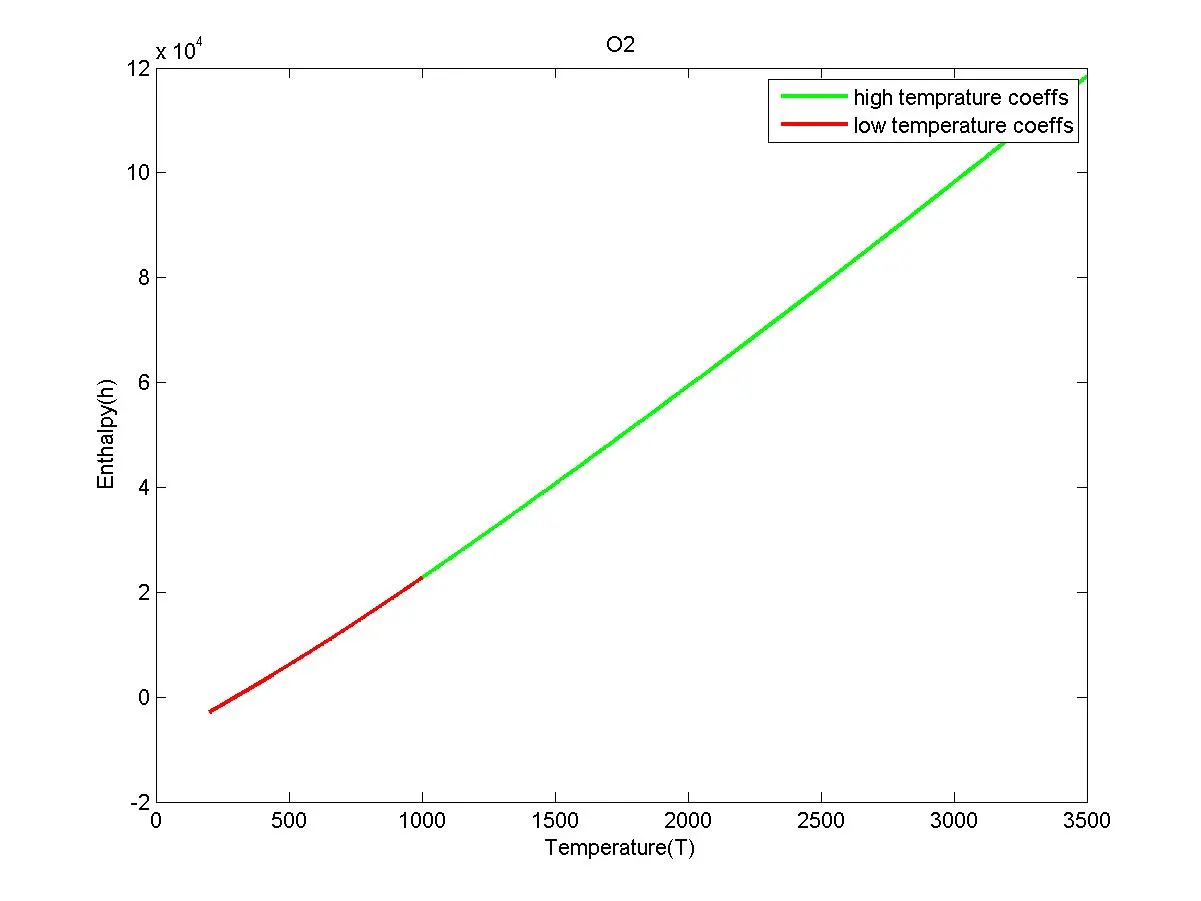
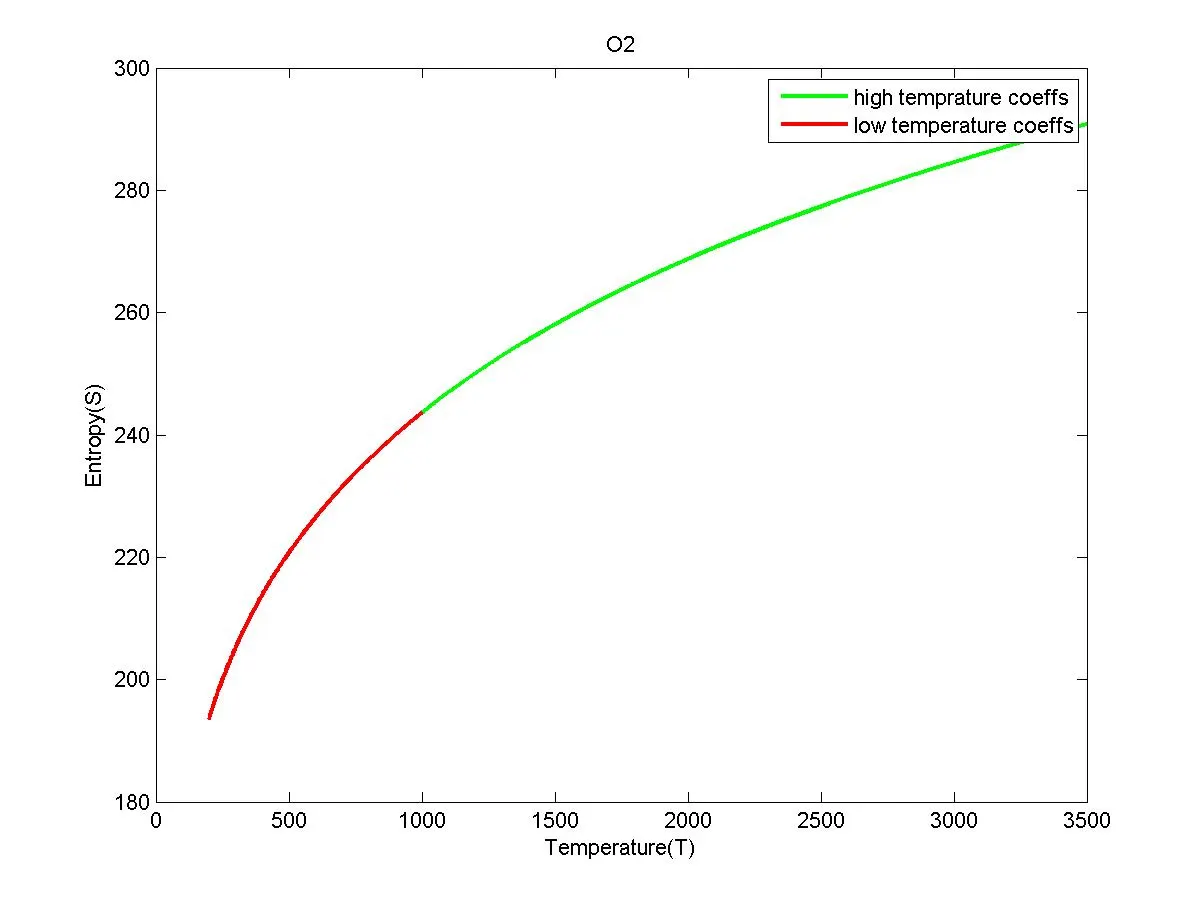
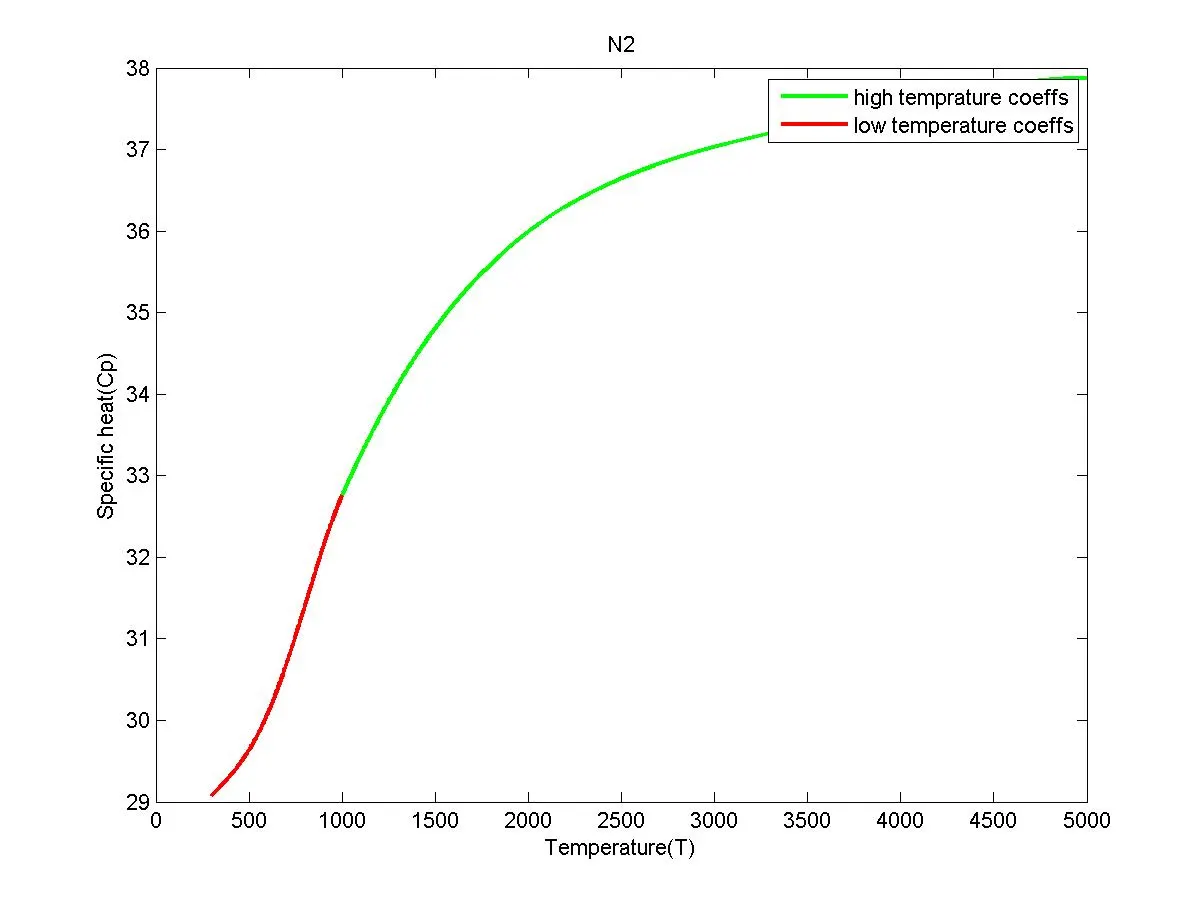
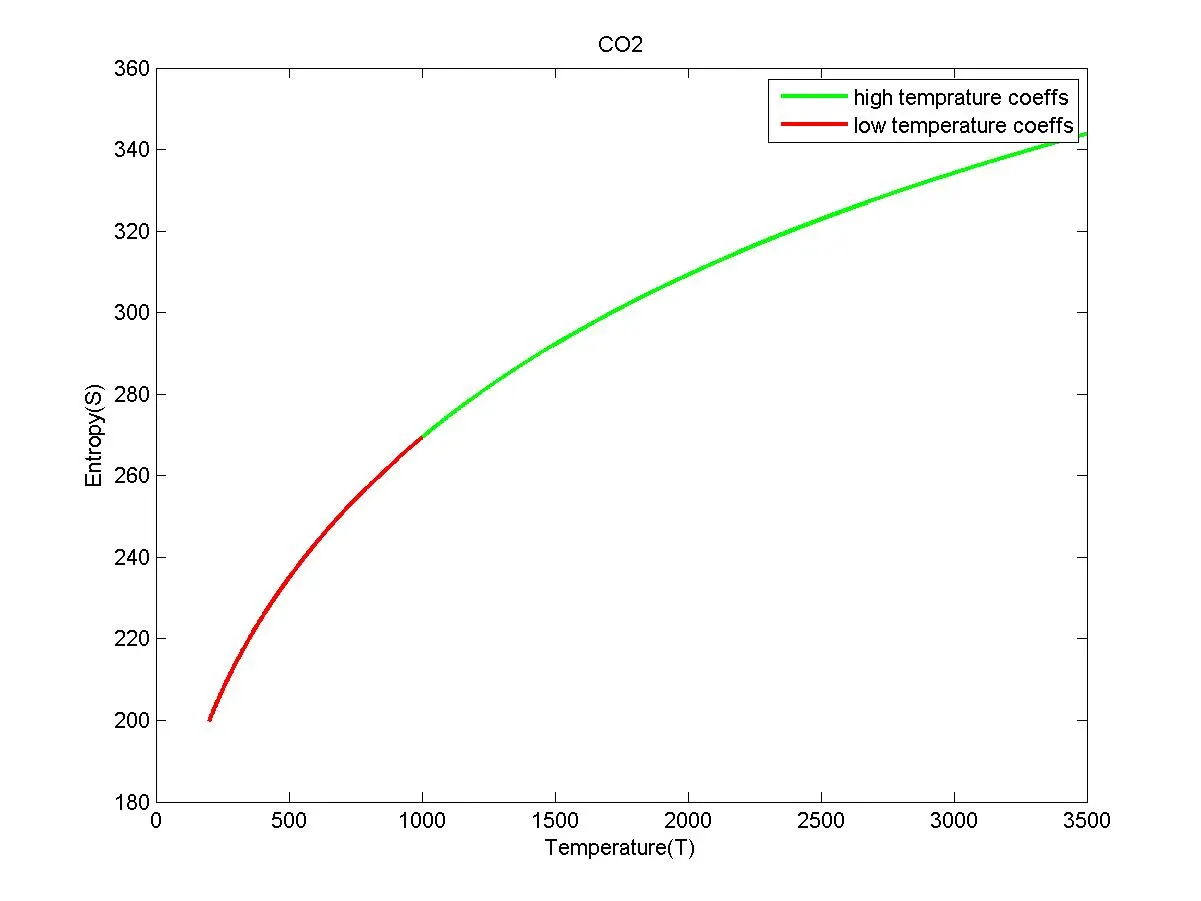
STEP-3: Plots of O2, N2 and CO2 of specific hear, enthalpy and entropy vs local temperature range.
Plots for O2:
Plots for N2:
Plots for CO2:
Conclusion:
Using Matlab code, written the function for Specific heat, Enthalpy, Entropy using local temperature coefficients and ranges. Molecular weight of all the species determined using the parsing method. All the plots and molecular weight values of 53 species with respect to local temperature range are determined and plots of all the species are saved in a common directory.