Project 1 - Parsing NASA thermodynamic data
CODE DESCRIPTION:
- In first step NASA THERMO FILE is open usin fopen and letter r is to read that file.
- using fgetl we can access each line from data
- so in code three fgetl line are used to skip few unwanted lines.
- temperature ranges are found next
- cp. H ,S found next using if else loop using given formulas.
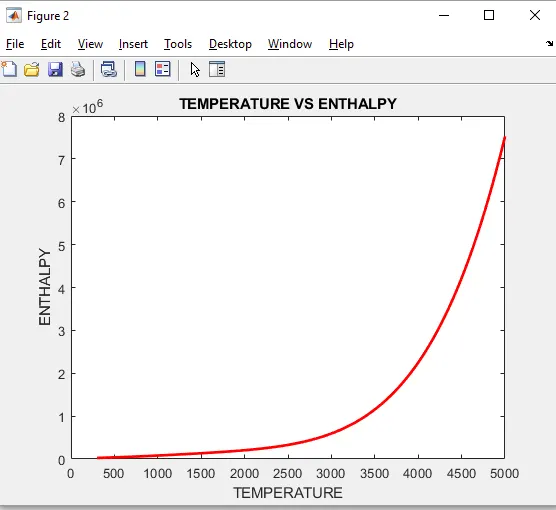
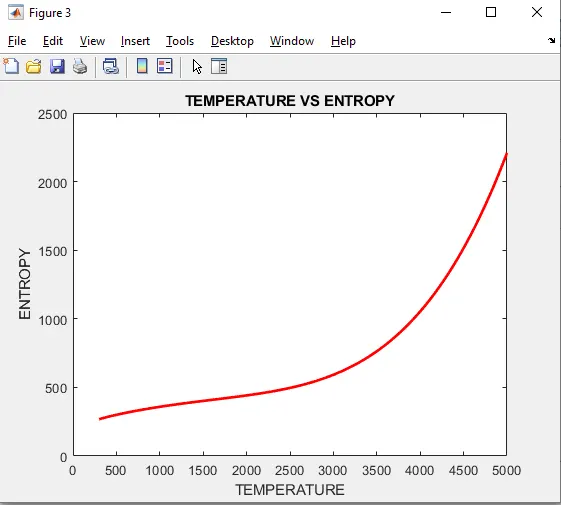
- plots are formed using plot command.
- molecucal mass seperate code is formed and then called in main code and we get the molecular mass
clear all
close all
clc


f1 = fopen('THERMO.dat','r')
fgetl(f1)
tline = fgetl(f1)   %reading header info

A = strsplit(tline,' ')

global_low_temp = str2num(A{2})
global_mid_temp = str2num(A{3})
global_high_temp = str2num(A{4})


%skipping the lines
fgetl(f1);
fgetl(f1);
fgetl(f1);

for j = 1:53

species = fgetl(f1);
species_name = species(1:6)


tline = fgetl(f1)


%first coeff.
a = findstr(tline,'E');
a1 = tline(1:a(1)+3)   ;             %first coeff.
a1 = str2num(a1)     ;               %convert string to no.
% second coeff.
a2 = tline(a(1)+4:a(2)+3);
a2 = str2num(a2);
% 3rd coeff.
a3 = tline(a(2)+4:a(3)+3);
a3 = str2num(a3);
% 4th coeff
a4 = tline(a(3)+4:a(4)+3);
a4 = str2num(a4);
% 5th coeff.
a5 = tline(a(4)+4:a(5)+3);
a5 = str2num(a5);


% tline_2 = fgetl(f1);
% fgetl(f1)
%
% K = strsplit(tline_2,' ')
%
%
% local_low_temp = str2num(K{2})
% local_mid_temp = str2num(K{3})
% local_high_temp = str2num(K{4})

tline_2 = fgetl(f1)       %move to line 2
% 6th coeff
a6 = tline_2(1:a(1)+3);
a6 = str2num(a6);
% 7th coeff
a7 = tline_2(a(1)+4:a(2)+3);
a7 = str2num(a7);
% 8th coeff
a8 = tline_2(a(2)+4:a(3)+3);
a8 = str2num(a8);
% 9th coeff
a9 = tline_2(a(3)+4:a(4)+3);
a9 = str2num(a9);
% 10th coeff
a10 = tline_2(a(4)+4:a(5)+3);
a10 = str2num(a10)


tline_3 = fgetl(f1)       %move to line 3
% 11th coeff
a11 = tline_3(1:a(1)+3);
a11 = str2num(a11);
% 12th coeff
a12 = tline_3(a(1)+4:a(2)+3);
a12 = str2num(a12);
% 13th coeff
a13 = tline_3(a(2)+4:a(3)+3);
a13 = str2num(a13);
% 14th coeff
a14 = tline_3(a(3)+4:a(4)+3);
a14 = str2num(a14);

R = 8.314;  %universal gas constANT
 T = linspace(300,5000,100); %calculation purpose
 for i = 1:length(T)
      if T(i)<3000
           cp = (a1+a2.*T+a3.*T.^2+a4.*T.^3+a5.*T.^4).*R;
           H  = (a1+a2.*(T/2)+(a3.*(T.^2)/3)+(a4.*(T.^3)/4)+(a5.*(T.^4)/5)).*R.*T+a6.*R;
           S  = (a1*log(T)+a2.*T+(a3.*T.^2)/2+(a4.*T.^3)/3+(a5.*T.^4)/4+a7).*R;
      else
           cp = (a8+a9.*T+a10.*T.^2+a11.*T.^3+a12.*T.^4).*R;
           H  = (a8+a9.*(T/2)+(a10.*(T.^2)/3)+(a11.*(T.^3)/4)+(a12.*(T.^4)/5)).*R.*T+a13.*R;
           S  = (a8.*log(T)+a9.*T+(a10.*T.^2)/2+(a11.*T.^3)/3+(a12.*T.^4)/4+a14).*R;
     end
 end


MM = molecular_mass(species_name)
end

  % TEMPERATURE VS SPECIFIC HEAT
 figure(1)
 plot(T,cp,'r','linewidth',2);
 title('TEMPERATURE VS SPECIFIC HEAT')
 xlabel('TEMPERATURE');ylabel('SPECIFIC HEAT')

  % TEMPERATURE VS ENTHALPY
 figure(2)
 plot(T,H,'r','linewidth',2);
 title('TEMPERATURE VS ENTHALPY')
 xlabel('TEMPERATURE');ylabel('ENTHALPY')

 % TEMPERATURE VS ENTROPY
 figure(3)
 plot(T,S,'r','linewidth',2);
 title('TEMPERATURE VS ENTROPY')
 xlabel('TEMPERATURE');ylabel('ENTROPY')


%% code for molecular mass

function MM = molecular_mass(species_name)

species = upper(species_name)

constituents = ['H', 'C', 'N', 'O', 'O'];

ATOMIC_WEIGHT = [1.00794 12.0107 14.0067 15.9994 39.948];

MM = 0;

for i = 1:length(species)
    for j = 1:length(constituents)
        if strcmp(species(i),constituents(j))
            MM = MM+ATOMIC_WEIGHT(j);
            u =j;
        end
    end
    n = str2num(species(i))
    if n>1
        MM = MM+ATOMIC_WEIGHT(u)*(n-1);
    end
end
end