Project 1 - Parsing NASA thermodynamic data
AIM: To write a function that extracts 14 coefficients to calculate enthaply,entropy,specific heat and molecular weights of all species, create and save plots for all the different species.
GOVERNING EQUATIONS:

- Specific Heat (Cp) : It is a material specific physical quantity,determined by amount of heat supplied to specimen divided by resulting temperature increase.
`Cp = frac{Q}frac{m*/_T}`
Units of Cp are `frac{J}frac{Kg*K}`
It is defined as amount of heat required to raise the temperature of one gram mass by one degree celsius.
The first equation can be used to calculate the Cp for different species using the coefficients a1,a2,a3,a4 and a5.
- Enthalpy : It is the sum of the internal energy and product of the pressure and volume of a thermodynamic system.
Its units are `J``/_ H = /_U+/_(PV)`
It was defined so that we can talk about the amount of heat released or absorbed by a reaction when the work being done is PV work occuring at constant pressure.
- Universal gas constant : It is a physical constant that appears in an equation defining the behaviour of a gas under theoretical conditions. It is a constant.
Its units are `J*K^-1`
It is a constant of proportionality that relates the energy scale in physics to temperature is being considered.
- Molecular weight : It is a measure of the sum of atomic weight values of the atoms in a molecule.
It is used in chemistry to determine stoichiometry in chemical reactions and equations.
OBJECTIVES:
- To write a code to extract the 14 coeffecients of each species.
- To calculate the values of specific heat,enthalpy and entropy of all the 53 species.
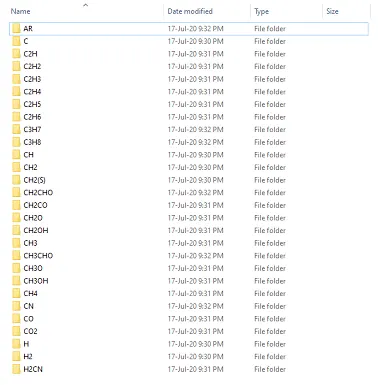
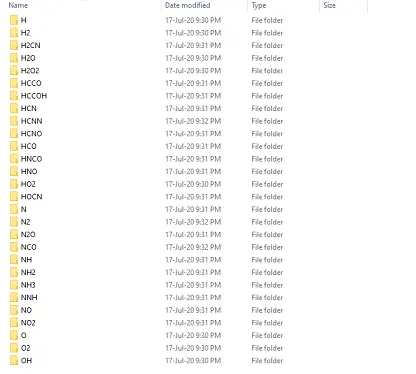
- To create a new folder for each species.
- To plot graphs between Cp,H,S and temperature and the save them in the folders created earlier.
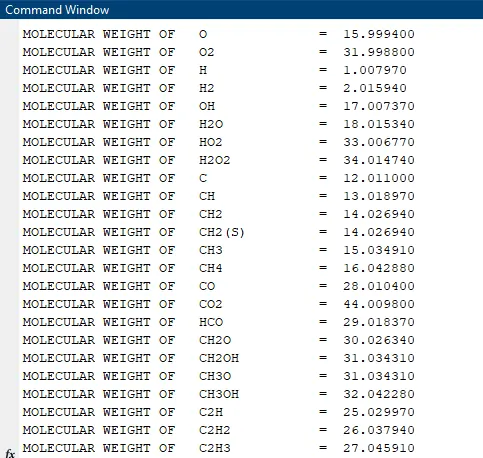
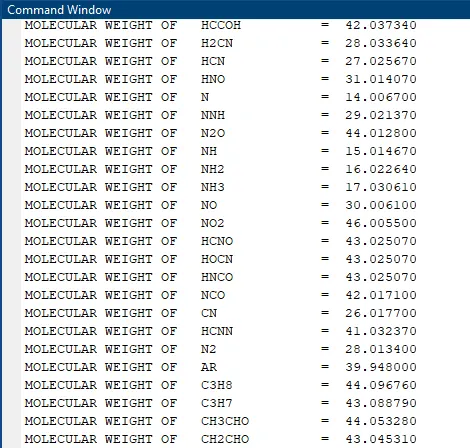
- To calculate the molecular weights of each species and display them accordingly.
Procedure:
- Using the command fopen read the file THERMO.dat.The command fopen opens the file and stores it in f1.
- The fgetl command uses f1 as an input and reads first line of the file.
- The first line is the heading THERMO which can be read using fgetl.
- The second line gives the global temperetaure range.
- The fgetl gets the second line.The the strsplit command is used to split the line with ' ' as the delimiter.Now thw str2num command converts the values of temperature that are stored as strings into numbers.
- To read the temperatures individually use the 'fgetl', 'strsplit','str2num' commands and the get the global high, low and mid temperatures.
- The 3rd , 4th and 5th lines are comments, hence a for loop can be used to skip these lines.
- The 6th line gives name of the species and local temperature ranges.
- This line can be read using fgetl.
- Since the species name occupies 14 places in the line thus the species name can be defined by the no. of postions it occupies i.e 1:14.
- Now the local temperature range occupies the 45th to 75th positions of the line.
- Thus the matter in these positions can be stored in species_temp for 45:76 positions.
- Then this can split using strsplit with ' ' as the delimiter.
- Now the temperatures can be stored individually as high ,low and mid temperatures.
- The next 3 lines contain the coefficients.
- Using strsplit the line can split using 'E' as the delimiter.
- Now the numbers before E and some numbers after E together form the coefficients.
- The coefficients can be defined by splitting the line by E and by using the position of E, the starting and ending positions can be found.
- Thus all the coefficients of the three lines can be found using the same logic.
- Now a for loop can be used for the rest of the species because these 4 lines repeat for the 53 different species.
- After this using mkdir we can create 53 new folders in the folder named species for storing the different plots of each species.
- The for loop can be used for nesting for and if loops in it for calculation of the specific heat, enthalpy and entropy are using the local temperatures derived from the species name line.
- Now they can be plotted for the local temperatures and stored in different files created above.
- This can be done simply by using cd to open the new folders created just before the start of plotting and with help of saveas command, we can save the plots as images in the folders.
- Then use cd again to open the main folder again so that the for loop can continue to operate for all the species.
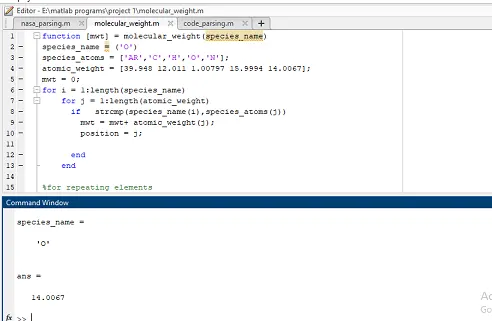
- Now for calculation of the molecular weights of each species, we can write a function separately.
- In the function, we can compare the species_name defined in the main program and the species_atoms defined in this function which are both strings.
- Thus the strings can be compared using strcmp command and if the contents of the strings match then molecular weight can be calculated respectively using a nested for loop.
- The species_atom contains the possible elements in the species_name.
- Now for calculating the repeating elements like H2, we can use another if loop in the main for loop to see if there are any numbers in the species_name using str2num and if there is a number n, that atomic_weight will be added (n-1)times.
- This function can be called in the main program and using fprint and the format specifiers the molecular weights can be calculated and displayed.
CODE:
clear all
close all
clc
%opening the file
f1 = fopen('THERMO.dat','r');
%reading the heading
heading  = fgetl(f1);
%reading global temp in the 2nd line
GT = fgetl(f1);
GT = strsplit(GT,' ');
global_low_temp = str2num(GT{2});
global_mid_temp = str2num(GT{3});
global_high_temp = str2num(GT{4});
%skipping the 3rd 4th and 5th lines
for i = 3:5
    skipping_lines = fgetl(f1);
end
%extracting the coefficients and species names
for j = 1:53


    species = fgetl(f1);
    species_name = species(1:14);
    species_line = species(47:75);
    species_temp = strsplit(species_line,' ');
    low_temp = str2num(species_temp{2});
    high_temp = str2num(species_temp{3});
    mid_temp = str2num(species_temp{4});


a_coeff_1 = fgetl(f1);
a_1 = strfind(a_coeff_1,'E');
a1 = str2num(a_coeff_1(1:a_1(1)+3));
a2 = str2num(a_coeff_1(a_1(1)+4:a_1(2)+3));
a3 = str2num(a_coeff_1(a_1(2)+4:a_1(3)+3));
a4 = str2num(a_coeff_1(a_1(3)+4:a_1(4)+3));
a5 = str2num(a_coeff_1(a_1(4)+4:a_1(5)+3));

a_coeff_2 = fgetl(f1);
a_2 = strfind(a_coeff_2,'E');
a6 = str2num(a_coeff_2(1:a_1(1)+3));
a7 = str2num(a_coeff_2(a_1(1)+4:a_1(2)+3));
a8 = str2num(a_coeff_2(a_1(2)+4:a_1(3)+3));
a9 = str2num(a_coeff_2(a_1(3)+4:a_1(4)+3));
a10 = str2num(a_coeff_2(a_1(4)+4:a_1(5)+3));

a_coeff_3 = fgetl(f1);
a_3 = strfind(a_coeff_3,'E');
a11 = str2num(a_coeff_1(1:a_1(1)+3));
a12 = str2num(a_coeff_1(a_1(1)+4:a_1(2)+3));
a13 = str2num(a_coeff_1(a_1(2)+4:a_1(3)+3));
a14 = str2num(a_coeff_1(a_1(3)+4:a_1(4)+3));

%creating a seperate folder for each species
mkdir (['E:matlab programsproject 1species',species_name])


%calculating the cp,H and s

T = linspace(low_temp,high_temp,1000);
R = 8.314;

for k = 1:length(T)
    if T(k) >=mid_temp
        Cp = (a1 +(a2.*T)+(a3.*T.^2)+(a4.*T.^3)+(a5.*T.^4)).*R;
        H = (a1 +(a2.*T./2)+(a3.*T.^2./3)+(a4.*T.^3./4)+(a5.*T.^4./5)+(a6./T)).*R.*T;
        S = (a1.*log(T) +(a2.*T)+(a3.*T.^2./2)+(a4.*T.^3./3)+(a5.*T.^4./4)+(a7)).*R;

    else

        Cp = (a8 +(a9.*T)+(a10.*T.^2)+(a11.*T.^3)+(a12.*T.^4)).*R;
        H = (a8 +(a9.*T./2)+(a10.*T.^2./3)+(a11.*T.^3./4)+(a12.*T.^4./5)+(a13./T)).*R.*T;
        S = (a8.*log(T) +(a9.*T)+(a10.*T.^2./2)+(a11.*T.^3./3)+(a12.*T.^4./4)+(a14)).*R;


    end
end

%Changing directory to save the plots in different folders for different
%species
cd(['E:matlab programsproject 1species',species_name]);
%plot between temperature and specific heat
figure(1);
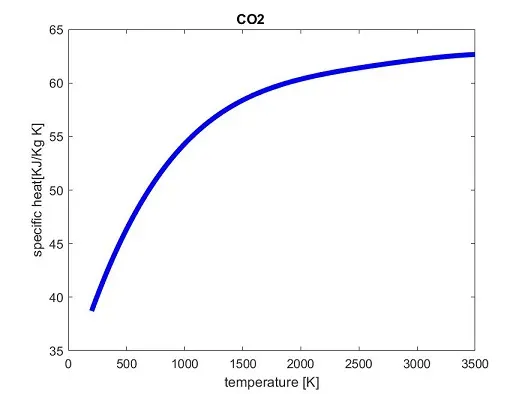
plot(T,Cp,'linewidth',4,'color','b');
title(species_name);
xlabel('temperature [K]');
ylabel('specific heat[KJ/Kg K]');
saveas(1,'specific heat','jpg');

%plot between temperature and enthalpy

figure(2);
plot(T,H,'linewidth',4,'color','r');
title(species_name);
xlabel('temperature [K]');
ylabel('enthalpy[KJ/Kg]');
saveas(2,'enthalpy','jpg');

%plot between temperature and entropy

figure(3);
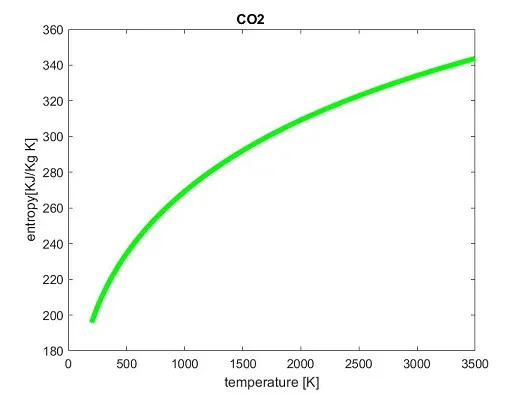
plot(T,S,'linewidth',4,'color','g');
title(species_name);
xlabel('temperature [K]');
ylabel('entropy[KJ/Kg K]');
saveas(3,'entropy','jpg');

%changing the folder location back for the loop to execute
 cd(['E:matlab programsproject 1']);


%calculating the molecular weight
 M = molecular_weight(species_name);
 fprintf('MOLECULAR WEIGHT OF   %s =  %f n',species_name,M)


end
THE PROGRAM FOR FUNCTION OF MOLECULAR WEIGHT
function [mwt] = molecular_weight(species_name)

species_atoms = ['A','C','H','O','N'];
atomic_weight = [39.948 12.011 1.00797 15.9994 14.0067];
mwt = 0;
for i = 1:length(species_name)
    for j = 1:length(atomic_weight)
      if   strcmp(species_name(i),species_atoms(j))
        mwt = mwt+ atomic_weight(j);
        position = j;

      end
    end

%for repeating elements
m = str2num(species_name(i));
    if m>1
    mwt = mwt + atomic_weight(position).*(m-1);
    end


end
RESULTS:
FOR O2:
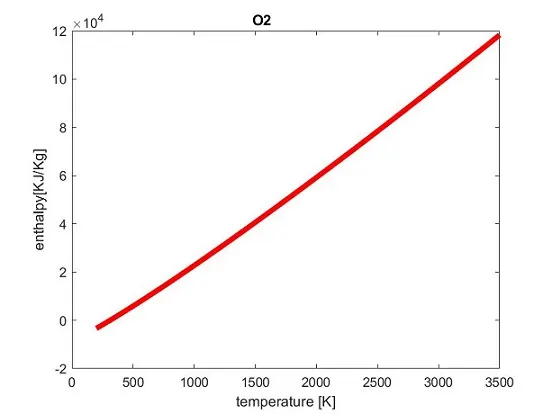
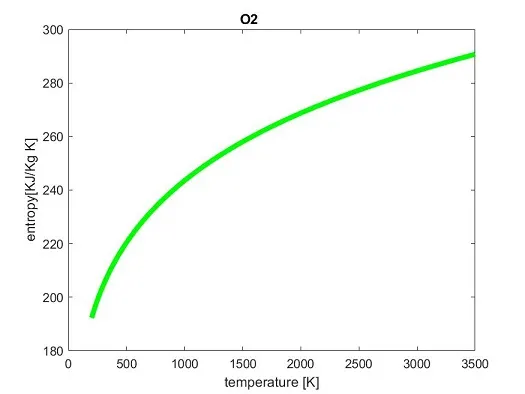
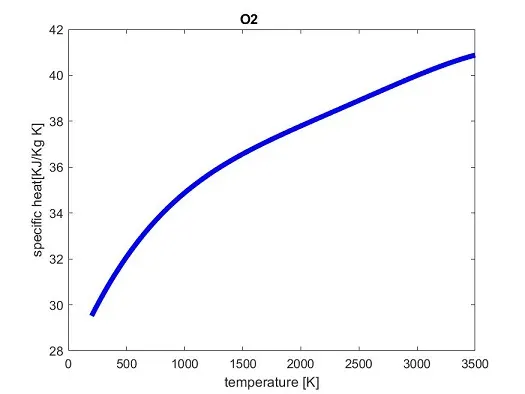
FOR N2:
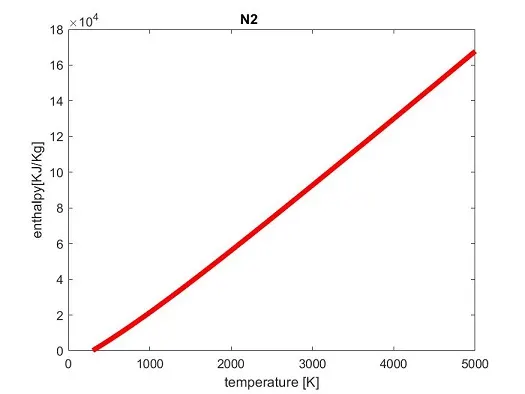
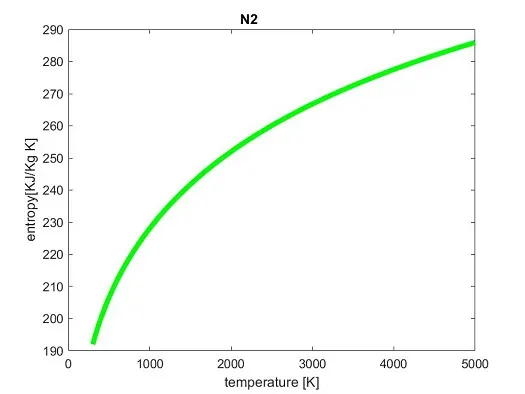
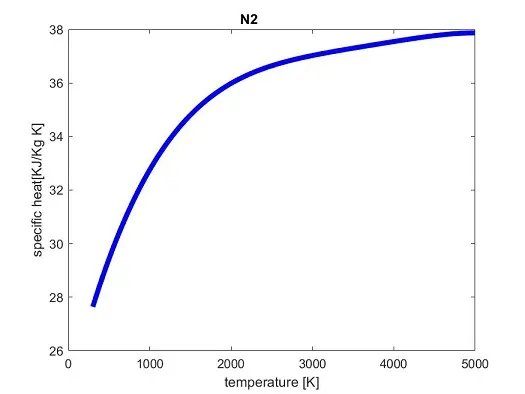
FOR CO2:
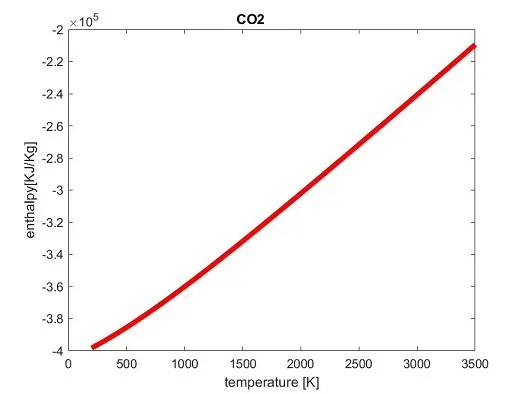
FILES:
ERRORS:
While giving the species_atoms in the function of molecular weight since i was using AR for argon i was getting the atomic weight of oxygen as nitrogen displayed.It was corrected.