Project 1 - Parsing NASA thermodynamic data
Project 1 - Parsing NASA thermodynamic data
Question
NASA came up with polynomials that can be used to evaluate thermodynamic properties such as Cp, H and S. They have also documented the coefficients required to evaluate these polynomials for 1000+ species.
To guide you, we have broken down the problem into meaningful bits you can work on individually.
- Write a function that extracts the 14 coefficients and calculates the enthalpy, entropy and specific heats for all the species in the data file. You will read this file NASA thermodynamic data(Tip: use fopen and fgetl). The formulae are shown below.
Here R is the universal gas constant, and T is the temperature
`(Cp)/R= a1+a2T+a3T^2+a4T^3+a5T^4`
`(H)/(RT)=a1+(a2T)/2+(a3T^2)/3+(a4T^3)/4+(a5T^4)/5+(a6)/T`
`S/R=a1lnT+a2T+(a3T^2)/2+(a4T^3)/3+(a5T^4)/4+a7`
The first 7 coefficients are high-temperature coefficients and the second 7 coefficients are low-temperature coefficients.
Also use the local temperature ranges which are unique for each species, not the global temperature range. - Calculate the molecular weight of each species and display it in the command window.
- Plot the Cp, Enthalpy and Entropy for each species' local temperature range (low-temperature: high-temperature) specific.
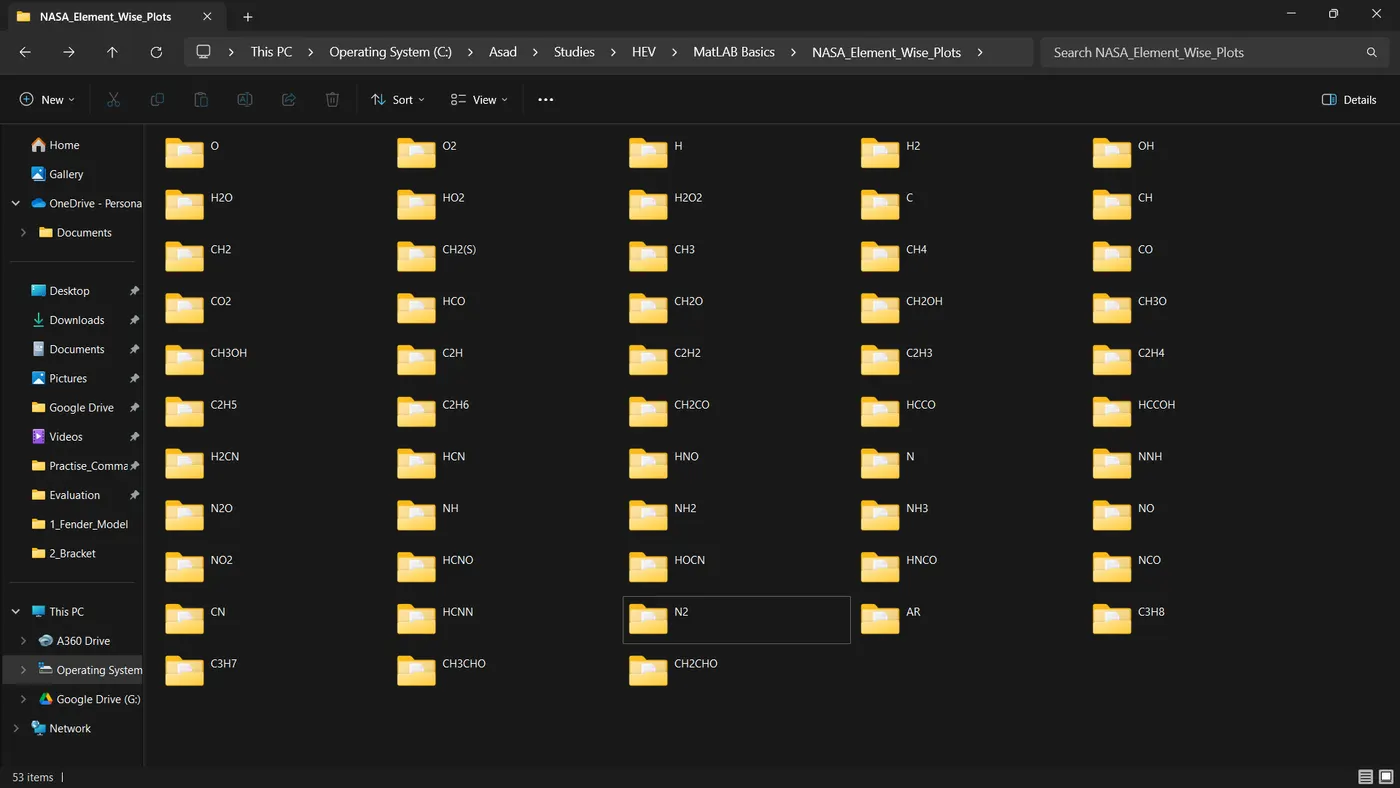
- Save the plots as images with appropriate names and dump them in separate folders for each species with a suitable name. All these should be generated automatically.
- The main program you will submit will take the "THERMO.dat" file as input and generate Cp, H and S plots.
- Please write a detailed report to describe your logic.
Answers
File parsing is a technique used by businesses to extract essential information from unstructured data. It involves analyzing the content of files, such as text documents or images, to extract relevant data points and convert them into a usable format.
Here, we need to extract suitable pieces of information and assigning to desired variables, plot different graphs and calculate various values. Before that, we need to decode the file and find out what kind of information and where we can find that information in the provided text data.
File Decoding
- The first line contains the header information of the file.
- The next line contains the global temperatures low, medium and high respectively
- The next three lines start with the '!' mark, and those are comments and there is no information from those lines.
- The remaining lines contain element information. There are a total number of 53 elements and their values. Each element has four lines of information and a blank line is used to separate all those pieces of information element-wise elements. The first word of the first line contains the symbol of the element and three values from the line ends are local low, high and medium temperatures. Every value is separated by a 'space'.
- The next three lines contain the element coefficients (A1-A14). The First two lines contain two sets of five coefficients (A1-A5 and A6-A10) and the last four coefficients (A11-A14) are situated in the last line. The coefficients don't have any separation means.
- Like this, there are other 52 elements and their information with the same pattern of representation.
Procedure
The procedure for establishing the code for functions that are required to find out the values of Specific Heat, Enthalpy, Entropy and Molecular Weight is given below.
For specific heat measurements,
- We use 10 coefficients, local middle temperature and temperature range between local low-temperature and local high-temperature.
- To find the value of specific heat for the condition (T>Local Middle Temperature), we need to use the first 5 coefficients (A1, A2, A3, A4 and A5) or else we need to use the other 5 coefficients (A8, A9, A10, A11 and A12). This comparison is done using an 'if' loop.
Matlab code for the function Specific Heat
% Function For Finding Specific Heat
% Variables Include A1 To A5, A8 to A12, R, Local_Mid_Temp And Temp(T)
function [CP] = Specific_Heat(A1,A2,A3,A4,A5,A8,A9,A10,A11,A12,R,Local_Mid_Temp,T)

% Comparing Wheater The Value Of Local Mid Temperature With  T(i) And Choose Appropriate Coefficients
% Initiating FOR Loop For The Length Of T
for i=1:length(T)

    %  Define The Condition For T
    if (T(i)>Local_Mid_Temp)
       CP(i)  = R*(A1+(A2*T(i))+(A3*T(i)^2)+(A4*T(i)^3)+(A5*T(i)^4));

    else
        CP(i)  = R*(A8+(A9*T(i))+(A10*T(i)^2)+(A11*T(i)^3)+(A12*T(i)^4));

   % Ending IF Loop
   end

% Ending FOR Loop
end

% Ending Function
end
For enthalpy measurements,
- We use 12 coefficients, local middle temperature and temperature range between local low-temperature and local high-temperature.
- To find the value of enthalpy for the condition (T>Local Middle Temperature), we need to use the first 6 coefficients (A1, A2, A3, A4, A5 and A6) or else we need to use the other 6 coefficients (A8, A9, A10, A11, A12 and A13). This comparison is done using an 'if' loop.
Matlab code for the function Enthalpy
% Function For Finding Enthalpy
% Variables Include A1 To A6, A5 to A13, R, Local_Mid_Temp And Temp(T)
function [H] = Enthalpy(A1,A2,A3,A4,A5,A6,A8,A9,A10,A11,A12,A13,R,Local_Mid_Temp,T)

% Comparing Wheater The Value Of Local Mid Temperature With T And Choose Appropriate Coefficients
% Initiating FOR Loop For The Length Of T
for i = 1:length (T)

    %  Define The Condition For T
    if (T(i)>Local_Mid_Temp)
       H(i) = R*T(i)*(A1+(A2*(T(i))/2)+(A3*((T(i))^2)/3)+(A4*((T(i))^3)/4)+(A5*((T(i))^4)/5)+((A6)/T(i)));

    else
        H(i) = R*T(i)*(A8+(A9*(T(i))/2)+(A10*((T(i))^2)/3)+(A11*((T(i))^3)/4)+(A12*((T(i))^4)/5)+((A13)/T(i)));

    % Ending IF Loop
    end

% Ending FOR Loop
end

% Ending Function
end
For entropy measurements,
- We use 12 coefficients, local middle temperature and temperature range between local low-temperature and local high-temperature.
- To find the value of enthalpy for the condition (T>Local Middle Temperature), we need to use the first 6 coefficients (A1, A2, A3, A4, A5, and A7) or else we need to use the other 6 coefficients (A8, A9, A10, A11, A12, and A14). This comparison is done using an 'if' loop.
Matlab code for the function Entropy
% Function For Finding Entropy
% Variables Include A1 To A5, A7 To A12, A14, R, Local_Mid_Temp And Temp(T)
function [S] = Entropy(A1,A2,A3,A4,A5,A7,A8,A9,A10,A11,A12,A14,R,Local_Mid_Temp,T)

% Comparing Wheater The Value Of Local Mid Temperature With T And Choose Appropriate Coefficients
% Initiating FOR Loop For The Length Of T
for i=1:length(T)

    %  Define The Condition For T
    if (T(i)>Local_Mid_Temp)
       S(i) =R*(((A1*log(T(i)))+(A2*T(i))+(A3*((T(i)^2)/2))+(A4*((T(i)^3)/3))+(A5*((T(i)^4)/4))+A7));

    else
        S(i) =R*(((A8*log(T(i)))+(A9*T(i))+(A10*((T(i)^2)/2))+(A11*((T(i)^3)/3))+(A12*((T(i)^4)/4))+A14));

    % Ending IF Loop
    end

% Ending FOR Loop
end

% Ending Function
end
For molecular weight measurements,
- Initially, we need to define the elements (H, C, N, O, A) in the variable 'Elements' and their corresponding atomic masses in the variable 'Element_Molecular_Weight' (A=Argon).
- Initialize the value of Molecular_Weight = 0.
- For the first element, we iterate through each element in 'Element_1', and for each element, we search and check for corresponding elements in variable 'Elements'. If we find, the element then, the corresponding values from the variable 'Element_Molecular_Weight' are added to the variable Molecular_Weight.
- Check if the element count is greater than 1, if so add the contribution of the same number of additional atoms value and update the variable 'Element_Molecular_Weight'. Finally, update the value of 'Element_Molecular_Weight'.
Matlab code for the function Molecular Weight
% Function For Finding Molecular Weight
% Variables Include Element_Name
function [M]=Molecular_Weight(Element_Name)

% Defining Elements As An Array, 'Elements'
Elements = ['H','C','N','O','A'];
% Defining Molecular Weight According To The Array, 'Elements'
Element_Molecular_Weight = [1.008, 12.011, 14.007, 15.999, 39.948];

% Initiating The Value Of Molecular_Weight = 0
Molecular_Weight = 0;

% Initiating The Primary FOR Loop For The Length Of 'Element_Name'
for i = 1:length(Element_Name)

    % Initiating The Secondary FOR Loop For The Length Of 'Elements'
    for j = 1:length(Elements)

        % Initiating First IF Loop
        if strcmpi(Element_Name(i),Elements(j))
           Molecular_Weight=Molecular_Weight+Element_Molecular_Weight(j);
           z = j;
        % Ending First IF Loop
        end

    % Ending Secondary FOR Loop
    end

    % Defining Variable K
    K = str2double(Element_Name(i));

    % Initiating Second IF Loop For The Condition 'K>1'
    if(K>1)

      Molecular_Weight = Molecular_Weight+(Element_Molecular_Weight(z)*(K-1));

    % Ending Second IF Loop
    end

% Ending Primary FOR Loop
end

M = Molecular_Weight;

% Ending The Function
end
The procedure for the extraction of common data and local data for the elements and how to plot and save that information to a 'text' file is mentioned below.
- Download the text file 'Thermo' and save it with the desired location.
- Change the file location to the location where the text file 'Themo' is located.
- Using the 'fopen' command, open the text file 'Thermo' and give read 'r' permission and save it in a variable. Run the code and check whether the value of the variable is positive or not. If it is positive we can proceed further.
- Skip the header line using a 'fgetl' command and with a simple 'for' loop. Save the second line information to a variable 'G_Temp' in character form.
- Using the 'strsplit' command, with a delimiter of ' '(space), split the character to a 1x4 cell 'Global_Temp'.
- The cell 'Global_Temp' contains 4 cells and cells 2,3 and 4 contain the values of global low, middle and high temperatures respectively. Using the command 'str2double', assign those values to different array variables (Global_Low_Temp, Global_Mid_Temp and Global_High_Temp).
- Create a variable 'R' for storing the value of the universal gas constant (R).
- Skip the next three lines using a 'fgetl' command and with a simple 'for' loop.
- Initiate a FOR loop, for the length of total elements, 53.
- Save the fifth line information to a variable 'Elem_Data' in character form.
- Using the 'strsplit' command, with a delimiter of ' '(space), split the character to a cell 'Elem_Data'.
- Save the element symbol (first cell) to a character 'Element_Name'.
- The cell 'Elem_Data' contains multiple cells and cells the three cells last before the final cell ((end-3), (end-1) and (end-2)) contain the values of local low, middle and high temperatures respectively. Using the command 'str2double', assign those values to different arrays (Element_Local_Low_Temp, Element_Local_Mid_Temp and Element_Local_High_Temp).
- Create an array 'T' with Element_Local_Low_Temp and Element_Local_High_Temp with 200 points between them.
- Move to the next line using the 'fgetl' command and store them in a variable 'Elem_Coeffs'.
- To extract coefficients from those data, we need to find out the position of the exponential, 'E' by using the 'strfind' command and those position data should saved in a variable 'Coeffs'. As a result, we can finally know the position of each exponential and two digits after that exponential 'E' will give us the correct digits for the coefficients. By selecting those ranges we can simply extract and store those values to a variable 'A1' up to A14.
- The first line contains A1 to A5 and then we need to jump to the next line repeat the above procedure and extract the coefficients A6 to A10. The remaining coefficients A11 to A14, are in the next line and extracted with the same method with suitable modifications.
- Find out the value for specific heat, CP with the help of the function and required inputs. In the same way, find out the value for Enthalpy and Entropy with the help of the required function and inputs.
- Use the 'mkdir' command, to create a folder with the element name and change the location to it.
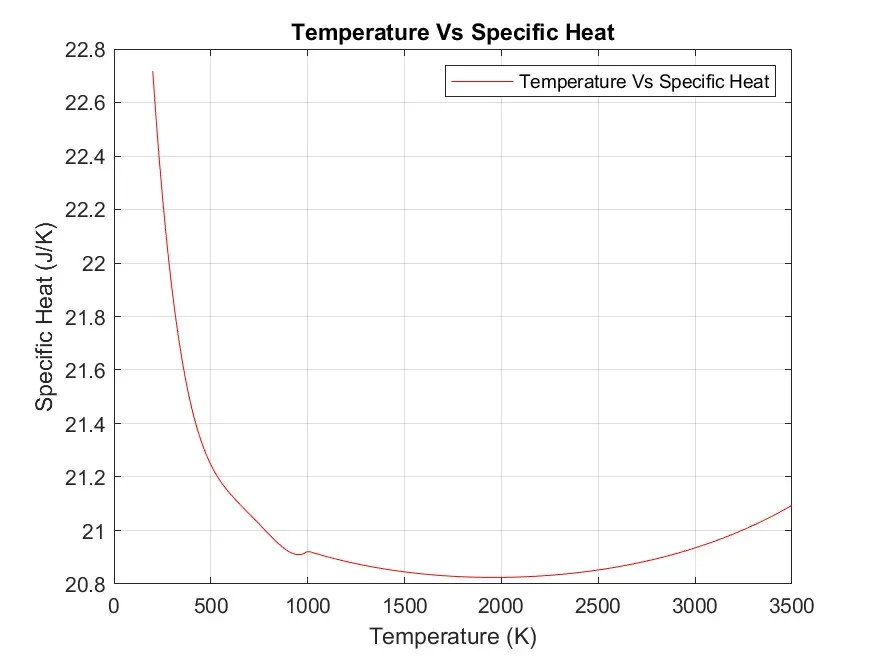
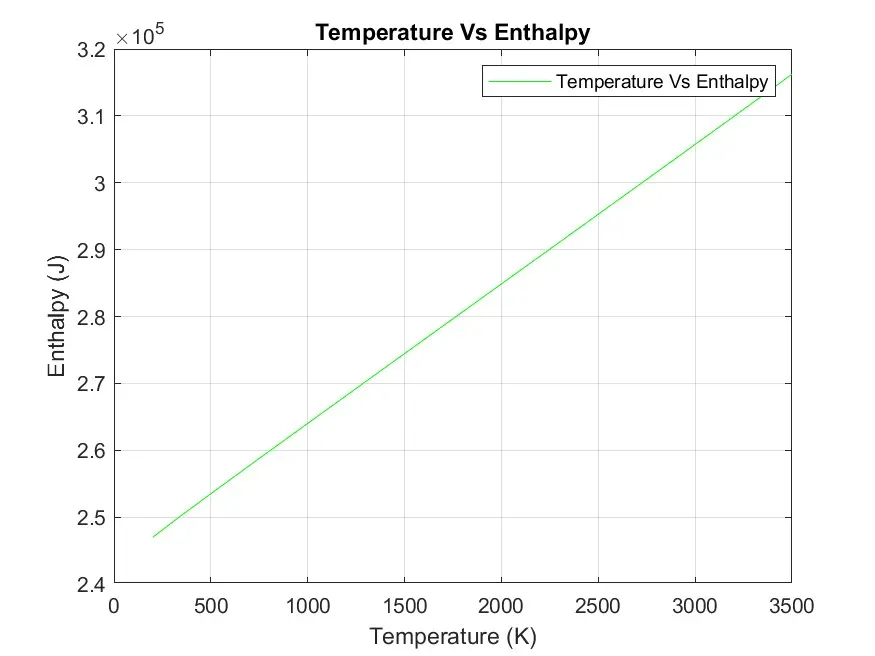
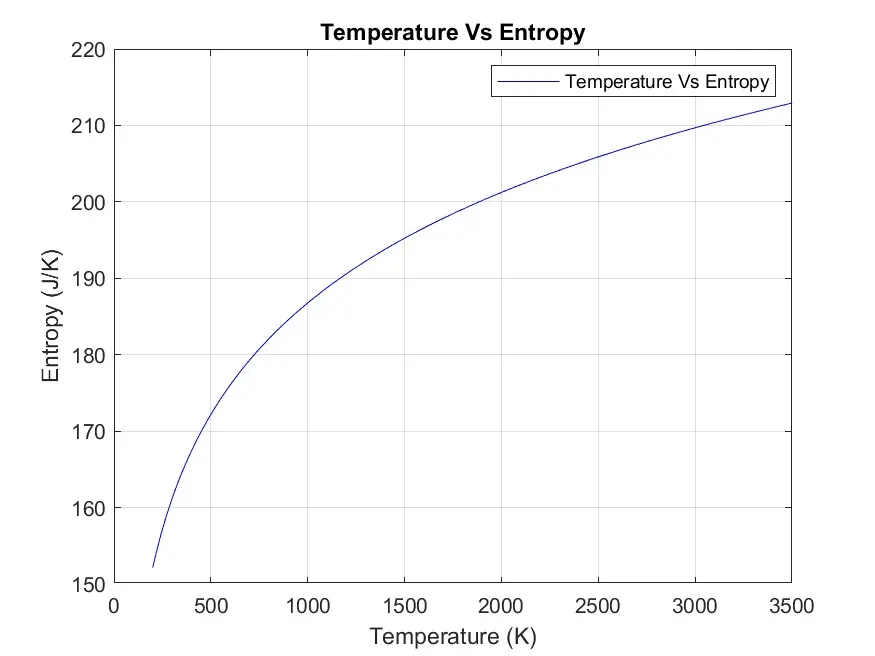
- By creating separate figures, plot 'Temperature Vs Specific Heat', 'Temperature Vs Enthalpy', and 'Temperature Vs Entropy' and manage those plots.
- Using the 'saveas' command, Save the plots in 'jpeg' format.
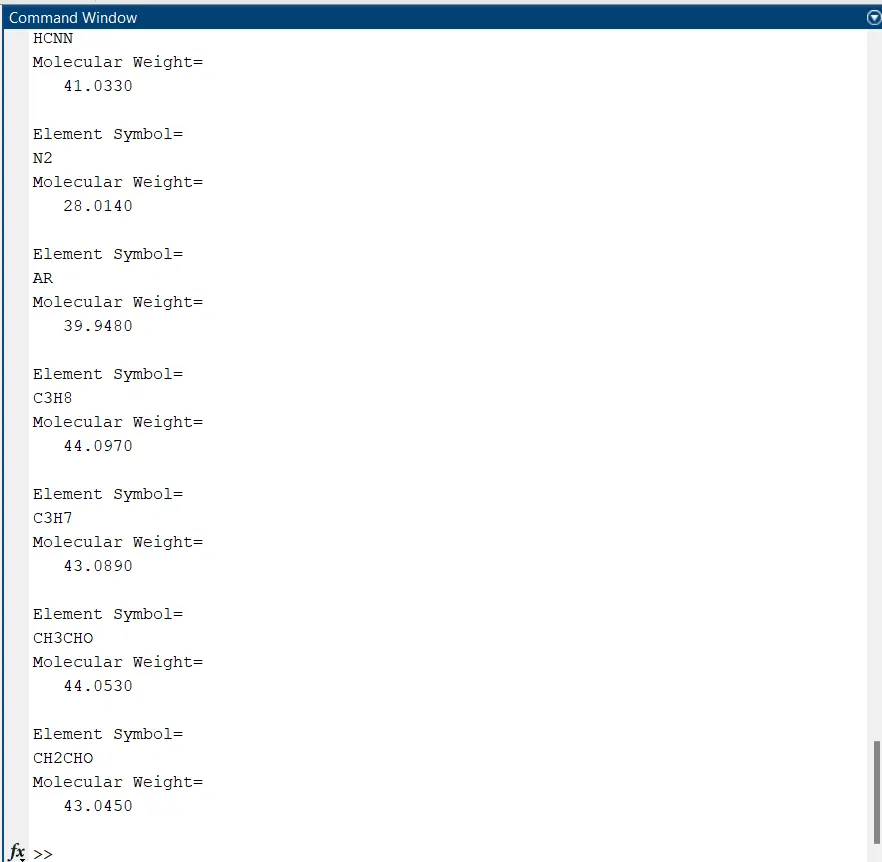
- Find the molecular weight using the function and define a code to display the element symbol and the value of molecular weight in the command window.
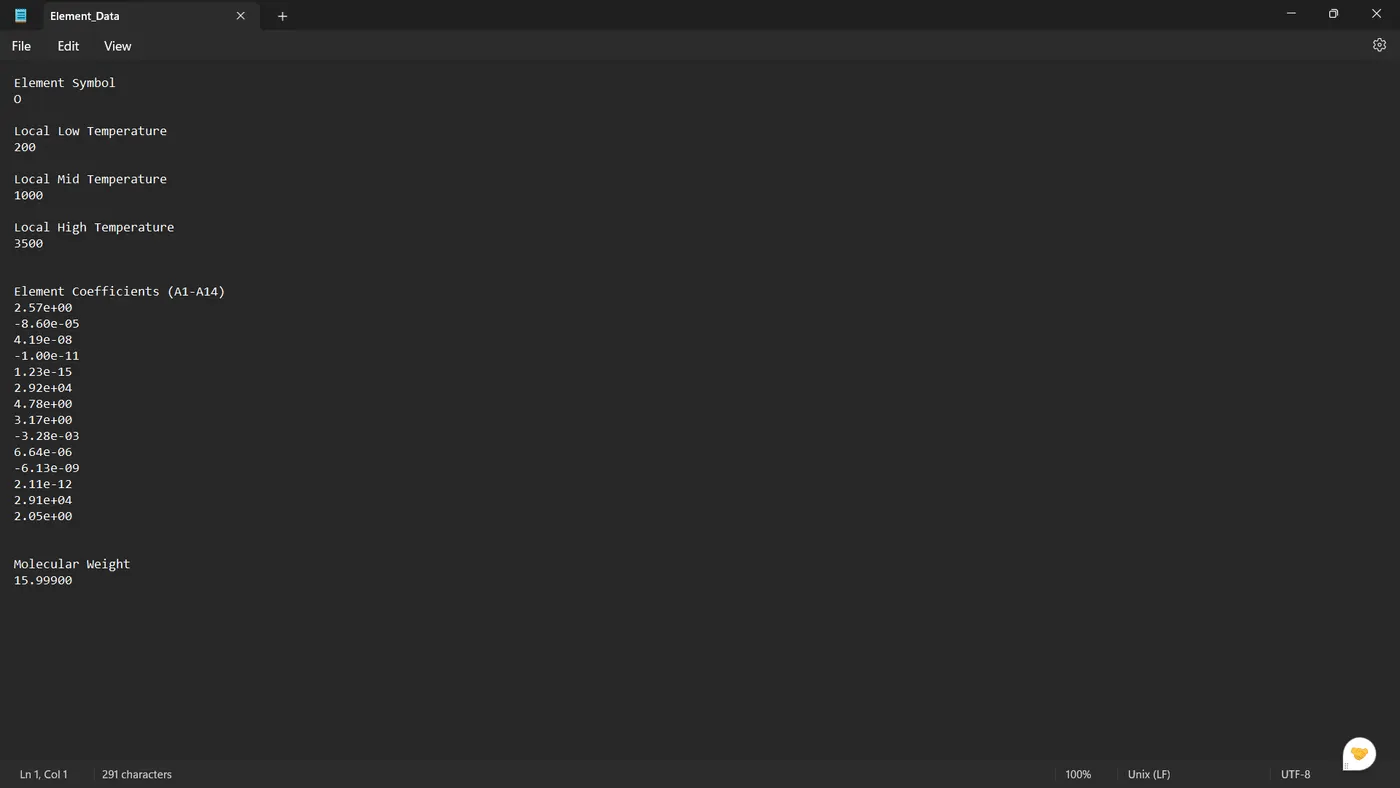
- Create a text file, 'Element_Data.txt', and write the required data we collected from the file and the values of each output obtained from it. Manage the text file.
- End The FOR loop, and run the code.
The code for the extraction of data for the first element is given below.
clear
close
clc


% Matlab Code For NASA File Parsing
% Download The NASA File From the Desired Location And Save It To The Same Directory As The Code Saved


% Opening The NASA File And Giving 'Read'Permission. Save It In A Variable 'NASA_File'.
% Check The Value Of the Variable And It Must Be a Positive Value.
% Changing File Location
cd('C:\Asad\Studies\HEV\MatLAB Basics\Practise_Commands\')
NASA_File=fopen('THERMO.dat', 'r');

% Skipping The First Line Of The Data.
% Saving The Data From Line 2 In A Character 'GTemp'
for i=1:2
    G_Temp = fgetl(NASA_File);
end


% Spliting Values Of Global Temperatures From Line 2 In A Cell Format 'Global_Temp'
Global_Temp=strsplit(G_Temp,' ');


% Based On The Position Of Cells Assigning Low, Medium And High Temperatures In Separate Variables
% Convert The Cells To An Array Formats.
Global_Low_Temp=str2double(Global_Temp{2});
Global_Mid_Temp=str2double(Global_Temp{3});
Global_High_Temp=str2double(Global_Temp{4});


% Skipping Next 4 Lines
% Saving The Data From Line 5 In A Character 'Element_Data'
for i=1:3
    Data_Skip = fgetl(NASA_File);
end

% Universal Gas Constant
R=8.314;

% Initiating FOR Loop For The Length Of 53
for i=1:53

    % Extracting Element Name And Its Local Temperature Values
    Elem_Data=fgetl(NASA_File);
    Element_Data=strsplit(Elem_Data,' ');
    Element_Name=Element_Data{1};
    Element_Local_Low_Temp = str2double(Element_Data{end-3});
    Element_Local_Mid_Temp = str2double(Element_Data{end-1});
    Element_Local_High_Temp = str2double(Element_Data{end-2});

    % Define An Temperature Array With 100 Elements Between And Local High Temperature
    T=linspace(Element_Local_Low_Temp,Element_Local_High_Temp,200);


    % Extracting Coefficients (1-5) For The Corresponding Element
    % Finding The Numbers By Exponential (E) Placements
    Elem_Coeffs= fgetl(NASA_File);
    Coeffs=strfind(Elem_Coeffs,'E');

    % Coefficient 1 (A1)
    A1=Elem_Coeffs(1:Coeffs(1)+3);
    A1=str2double(A1);

    % Coefficient 2 (A2)
    A2=Elem_Coeffs(Coeffs(1)+4:Coeffs(2)+3);
    A2=str2double(A2);

    % Coefficient 3 (A3)
    A3=Elem_Coeffs(Coeffs(2)+4:Coeffs(3)+3);
    A3=str2double(A3);

    % Coefficient 4 (A4)
    A4=Elem_Coeffs(Coeffs(3)+4:Coeffs(4)+3);
    A4=str2double(A4);

    % Coefficient 5 (A5)
    A5=Elem_Coeffs(Coeffs(4)+4:Coeffs(5)+3);
    A5=str2double(A5);


    % Extracting Coefficients (6-10) For The Corresponding Element
    % Finding The Numbers By Exponential (E) Placements.
    Elem_Coeffs=fgetl(NASA_File);
    Coeffs=strfind(Elem_Coeffs,'E');

    % Coefficient 6 (A6)
    A6=Elem_Coeffs(1:Coeffs(1)+3);
    A6=str2double(A6);

    % Coefficient 7 (A7)
    A7=Elem_Coeffs(Coeffs(1)+4:Coeffs(2)+3);
    A7=str2double(A7);

    % Coefficient 8 (A8)
    A8=Elem_Coeffs(Coeffs(2)+4:Coeffs(3)+3);
    A8=str2double(A8);

    % Coefficient 9 (A9)
    A9=Elem_Coeffs(Coeffs(3)+4:Coeffs(4)+3);
    A9=str2double(A9);

    % Coefficient 10 (A10)
    A10=Elem_Coeffs(Coeffs(4)+4:Coeffs(5)+3);
    A10=str2double(A10);


    % Extracting Coefficients (11-14) For The Corresponding Element
    % Finding The Numbers By Exponential (E) Placements.
    Elem_Coeffs=fgetl(NASA_File);
    Coeffs=strfind(Elem_Coeffs,'E');

    % Coefficient 11 (A11)
    A11=Elem_Coeffs(1:Coeffs(1)+3);
    A11=str2double(A11);

    % Coefficient 12 (A12)
    A12=Elem_Coeffs(Coeffs(1)+4:Coeffs(2)+3);
    A12=str2double(A12);

    % Coefficient 13 (A13)
    A13=Elem_Coeffs(Coeffs(2)+4:Coeffs(3)+3);
    A13=str2double(A13);

    % Coefficient 14 (A14)
    A14=Elem_Coeffs(Coeffs(3)+4:Coeffs(4)+3);
    A14=str2double(A14);


    % Finding Specific Heat For The Element
    CP =Specific_Heat(A1,A2,A3,A4,A5,A8,A9,A10,A11,A12,R,Element_Local_Mid_Temp,T);

    % Finding Enthalpy For The Element
    H =Enthalpy(A1,A2,A3,A4,A5,A6,A8,A9,A10,A11,A12,A13,R,Element_Local_Mid_Temp,T);

    % Finding Entropy For The Element
    S = Entropy(A1,A2,A3,A4,A5,A7,A8,A9,A10,A11,A12,A14,R,Element_Local_Mid_Temp,T);


    % Making A Folder Using Element Name
    cd("C:\Asad\Studies\HEV\MatLAB Basics\NASA_Element_Wise_Plots\")
    mkdir(Element_Name)
    cd(Element_Name)


    % Plotting Desired Graphs
    % Assigning Figure Number
    figure(1)

    % Temperature Vs Specific Heat
    plot(T,CP,LineStyle="-",Color="r")

    % Managing The Plot
    title ('Temperature Vs Specific Heat')
    xlabel 'Temperature (K)'
    ylabel 'Specific Heat (J/K)'
    legend 'Temperature Vs Specific Heat'
    grid on


    % Assigning Figure Number
    figure(2)

    % Temperature Vs Enthalpy
    plot (T, H, LineStyle="-",)

    % Managing The Plot
    title 'Temperature Vs Enthalpy'
    xlabel 'Temperature (K)'
    ylabel 'Enthalpy (J)'
    legend 'Temperature Vs Enthalpy'
    grid on


    % Assigning Figure Number
    figure(3)

    % Temperature Vs Entropy
    plot (T, S, LineStyle="-",)

    % Managing The Plot
    title 'Temperature Vs Entropy'
    xlabel 'Temperature (K)'
    ylabel 'Entropy (J/K)'
    legend 'Temperature Vs Entropy'
    grid on


    % Saving Figures In Suitable Directory
    saveas(1,'Temperature Vs Specific Heat','jpeg')
    saveas(2,'Temperature Vs Enthalpy','jpeg')
    saveas(3,'Temperature Vs Entropy','jpeg')


    %calculating the molecular mass
    [M]=Molecular_Weight(Element_Name);
    Element_Molecular_Weight = M;
    disp("Element Symbol= ")
    disp(Element_Name)
    disp("Molecular Weight= ")
    disp(Element_Molecular_Weight)


    % Write A Text File With All Information
    Text_File= 'Element_Data.txt';
    Text_File_ID = fopen(Text_File,'w');
    fprintf(Text_File_ID,"Element Symbol");
    fprintf(Text_File_ID,'\n');
    fprintf(Text_File_ID,'%c',Element_Name);
    fprintf(Text_File_ID,'\n');
    fprintf(Text_File_ID,'\n');
    fprintf(Text_File_ID,"Local Low Temperature");
    fprintf(Text_File_ID,'\n');
    fprintf(Text_File_ID,'%.f\n',Element_Local_Low_Temp);
    fprintf(Text_File_ID,'\n');
    fprintf(Text_File_ID,"Local Mid Temperature");
    fprintf(Text_File_ID,'\n');
    fprintf(Text_File_ID,'%.f\n',Element_Local_Mid_Temp);
    fprintf(Text_File_ID,'\n');
    fprintf(Text_File_ID,"Local High Temperature");
    fprintf(Text_File_ID,'\n');
    fprintf(Text_File_ID,'%.f\n',Element_Local_High_Temp);
    fprintf(Text_File_ID,'\n');
    fprintf(Text_File_ID,'\n');
    fprintf(Text_File_ID,"Element Coefficients (A1-A14)");
    fprintf(Text_File_ID,'\n');
    fprintf(Text_File_ID,'%.2e\n',A1,A2,A3,A4,A5,A6,A7,A8,A9,A10,A11,A12,A13,A14);
    fprintf(Text_File_ID,'\n');
    fprintf(Text_File_ID,'\n');
    fprintf(Text_File_ID,"Molecular Weight");
    fprintf(Text_File_ID,'\n');
    fprintf(Text_File_ID,'%.5f\n',Element_Molecular_Weight);


% Ending The FOR Loop
end
Output
For the above section, the outputs are listed below,
- Command Window
- File Location
- File Contents (Element No:1)

- Element Data Text File (Element No:1)
- Plot 1: Temperature Vs Specific Heat (Element No:1)
- Plot 2: Temperature Vs Enthalpy (Element No:1)
- Plot 3: Temperature Vs Entropy (Element No:1)
Errors Facing During The Activity
- Error while writing the function for Enthalpy, forgot to multiply with a T. Other than that, there are no major issues during the coding process.