Project 1 - Parsing NASA thermodynamic data
Aim:
To write the MATLAB code to evaluvate the thermodynamic properties such as specific heat(cp),entropy, enthalpy details that are provided in THERMO.dat file to make the plots for each species.
Objective:
Here R is the universal gas constant, T is the temeprature
- The FIRST 7 coefficients are HIGH-temperature coefficients and the SECOND 7 coefficients are LOW-temperature coefficients.
- Calculate the enthalpy, entropy and specific heats for all the species in the data file.
- Calculate the molecular weight of each species and display it.
- Plot the Cp, Enthalpy and Entropy for each species.
- Save the plots as images with separate folders for each species
Procedure:
Logic explanation:
This code appears to be a MATLAB script designed to parse and process NASA's thermodynamic data for various chemical species. Here's a breakdown of the logic used in the code:
Initialization and File Handling:
The script starts by clearing all existing variables, closing all figures, and clearing the command window.
It then opens a file named 'THERMO.dat' in read mode ('r') and reads the first line from the file.
Extracting Global Temperature Range:
The second line of the file contains global temperature data, which is split into three values: low temperature, moderate temperature, and high temperature.
These values are stored in variables global_low_temp, global_mod_temp, and global_high_temp.
Temperature Range:
It creates an array T of 400 equally spaced temperature values between global_low_temp and global_high_temp.
Universal Gas Constant:
It defines the universal gas constant R with a value of 8.314.
Skipping Comments:
The script skips the next three lines in the file, which are presumably comment lines.
Parsing Species Data:
It enters a loop that runs 53 times (presumably for 53 species of interest).
For each species, it performs the following steps:
Reads the first line, which contains the species name.
Reads the next three lines, which contain coefficients for high and low-temperature specific heat and enthalpy data for the species.
Extracts the coefficients from these lines, dividing them into high-temperature (a1 to a7) and low-temperature (b1 to b7) coefficients.
Thermodynamic Calculations:
For each species, it calculates:
Specific Heat (cp) using the specific_heat_func function.
Enthalpy (h) using the enthalpy_func function.
Entropy (s) using the entropy_func function.
Molecular weight of the species using the molecular_weight function.
Plotting and File Creation:
It calls the plotting function to create plots of specific heat, enthalpy, and entropy as functions of temperature for each species.
It presumably saves these plots in the current folder, and it may also create files related to each species.
End of Loop:
The loop continues until all 53 species have been processed.
specific_heat_func, enthalpy_func, entropy_func, molecular_weight, and plotting. These functions handle specific calculations and plotting tasks related to thermodynamic properties and molecular weight.
Specific_heat_func:
% To calculate specific heat
function cp = specific_heat_func(a1,a2,a3,a4,a5,b1,b2,b3,b4,b5,T,R,global_mod_temp)
% comparing with the global temperature
% if less than global it will take min coeffs
if T > global_mod_temp
cp = R.*(a1+a2.*T+a3.*T.^2+a4.*T.^3+a5.*T.^4);
else
cp = R.*(b1+b2.*T+b3.*T.^2+b4.*T.^3+b5.*T.^4);
end
molecular_weight_func:
% function to calculate molecular weight
function MW = molecular_weight(name)
atoms = ['H','O','C','R','N'];
fprintf(name);
fprintf(' : ')
atomic_weight = [1 16 12 40 14];
MW = 0;
for i = 1:length(name)
for j = 1:length(atoms)
if strcmp(name(i), atoms(j))
MW = MW + atomic_weight(j);
position = j;
end
end
n = str2double(name(i));
if n > 1
MW = MW + atomic_weight(position)*(n-1);
end
end
fprintf('%f',MW)
disp(' ')
end
entropy_func:
% To calculate the Entropy
function s = entropy_func(a1,a2,a3,a4,a5,a7,b1,b2,b3,b4,b5,b7,T,R,global_mod_temp)
if T <= global_mod_temp
s = R*(a1.*log(T)+a2.*T+a3.*(T.^2)./2+a4.*(T.^3)./3+a5.*(T.^4)./4+a7);
else
s = R*(b1.*log(T)+b2.*T+b3.*(T.^2)./2+b4.*(T.^3)./3+b5.*(T.^4)./4+b7);
end
enthalpy_func:
% To calculate Enthalpy
function h = enthalpy_func(a1,a2,a3,a4,a5,a6,b1,b2,b3,b4,b5,b6,T,R,global_mod_temp)
if T > global_mod_temp
h = R*(a1*T+(a2.*T.^2)./2+(a3.*T.^3)./3+(a4.*T.^4)./4+(a5.*T.^5)./5+a6);
else
h = R*(b1*T+(b2.*T.^2)./2+(b3.*T.^3)./3+(b4.*T.^4)./4+(b5.*T.^5)./5+b6);
end
Plotting:
% create plotting function
function plotting(cp,h,s,T,name)
cd(pwd)
dir_name = name;
mkdir(dir_name);
figure(1)
plot(T,cp,'linewidth',2,'color','m')
title(sprintf('Specific Heat Vs Temperature of %s', name))
xlabel('Temperature')
ylabel('Specific Heat')
figure(2)
plot(T,h,'linewidth',2,'color','g')
title(sprintf('Enthalpy Vs Temperature of %s', name))
xlabel('Temperature')
ylabel('Enthalpy')
figure(3)
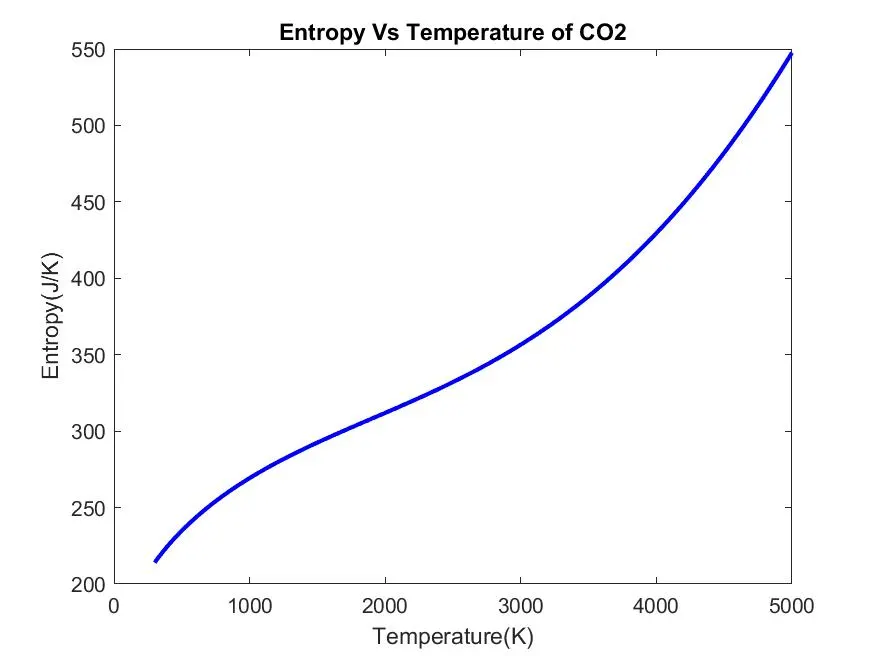
plot(T,s,'linewidth',2,'color','b')
title(sprintf('Entropy Vs Temperature of %s', name))
xlabel('Temperature')
ylabel('Entropy')
cd(dir_name)
saveas(1,'Cp_Vs_T.jpg')
saveas(2,'h_Vs_T.jpg')
saveas(3,'s_Vs_T.jpg')
cd ..
end
Main program to run the code:
% Parsing NASA Thermodynamic data
clear all
close all
clc
% Reading NASA's Thermodynamic data
f1 = fopen('THERMO.dat','r');
t_line = fgetl(f1);
% obtaining of global low, mod, high temperatures
global_temp = fgetl(f1);
temp_range = strsplit(global_temp,' ');
global_low_temp = str2double(temp_range{2});
global_mod_temp = str2double(temp_range{3});
global_high_temp = str2double(temp_range{4});
% Range of temperature
T = linspace(global_low_temp,global_high_temp,400);
% Universal gas constant of R
R = 8.314;
% skipping the comments line in the file
for i = 3:5
comments = fgetl(f1);
end
% getting the values for coeffs of species
for i = 1:53
% extracting the line1 and the name of the species
line1 = fgetl(f1);
name = strtok(line1);
% extracting higher and lower temperature coeffs
line2 = fgetl(f1);
line3 = fgetl(f1);
line4 = fgetl(f1);
A = strfind(line2,'E');
B = strfind(line3,'E');
C = strfind(line4,'E');
% extracting higher temperature coeffs
a1 = str2double(line2(1:A(1)+3));
a2 = str2double(line2(A(1)+4:A(2)+3));
a3 = str2double(line2(A(2)+4:A(3)+3));
a4 = str2double(line2(A(3)+4:A(4)+3));
a5 = str2double(line2(A(4)+4:A(5)+3));
a6 = str2double(line3(1:B(1)+3));
a7 = str2double(line3(B(1)+4:B(2)+3));
% extracting lower temperature coeffs
b1 = str2double(line3(B(2)+4:B(3)+3));
b2 = str2double(line3(B(3)+4:B(4)+3));
b3 = str2double(line3(B(4)+4:B(5)+3));
b4 = str2double(line4(1:C(1)+3));
b5 = str2double(line4(C(1)+4:C(2)+3));
b6 = str2double(line4(C(2)+4:C(3)+3));
b7 = str2double(line4(C(3)+4:C(4)+3));
%To calculate specific heat
cp = specific_heat_func(a1,a2,a3,a4,a5,b1,b2,b3,b4,b5,T,R,global_mod_temp);
% To calculate Enthalpy
h = enthalpy_func(a1,a2,a3,a4,a5,a6,b1,b2,b3,b4,b5,b6,T,R,global_mod_temp);
% To calculate Entropy
s = entropy_func(a1,a2,a3,a4,a5,a7,b1,b2,b3,b4,b5,b7,T,R,global_mod_temp);
% To calculate molecular weight of species
Molecular_wt = molecular_weight(name);
% plotting and create the file for each species in the folder
plotting(cp,h,s,T,name)
end
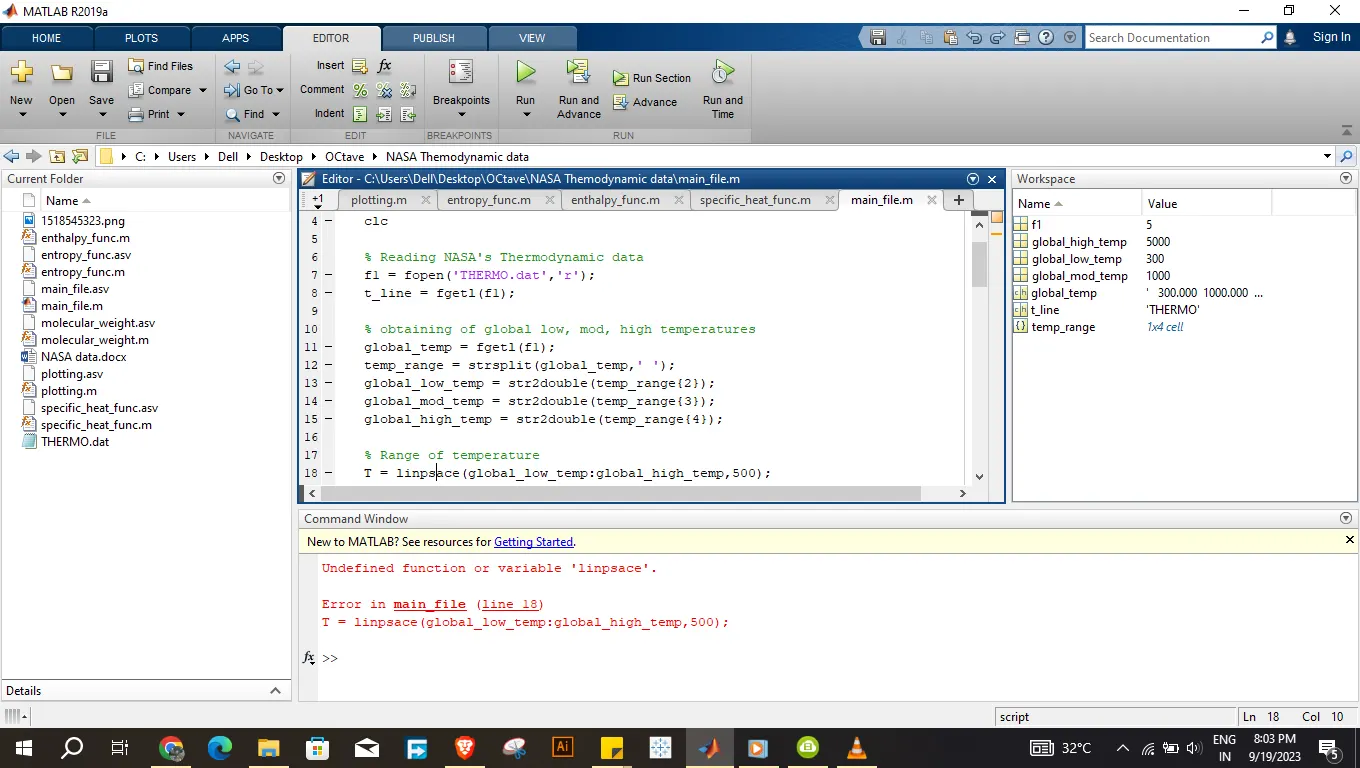
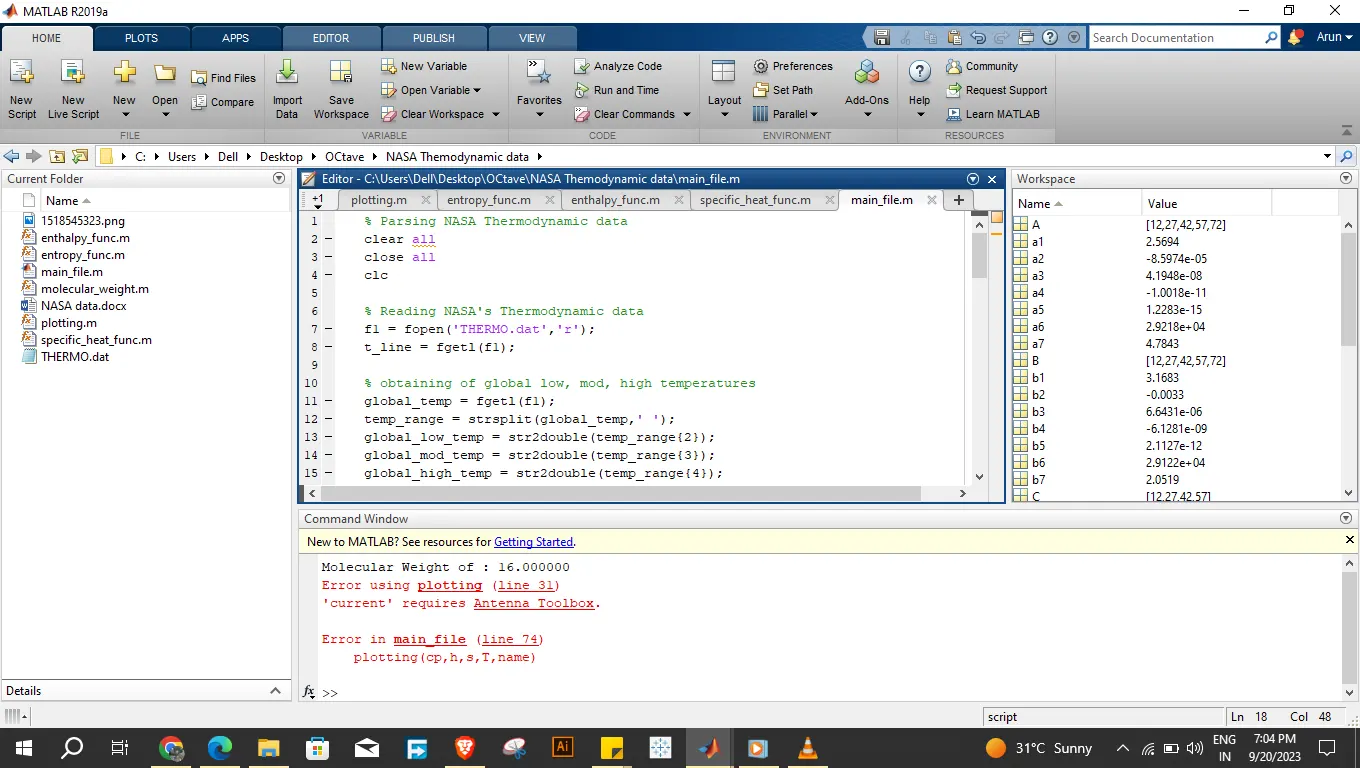
Screenshot of the error faced:
Error corrections:
- There are few spelling mistake are occured during write the code
- Antenna Toolbox Package is missing to run the program to move from species one to another to save the output in the respective folder.
- To solve the issue I uninstall the software and reinstall it again to solve package dependencies.
Result:
Molecular weight of each species are:
O : 16.000000
O2 : 32.000000
H : 1.000000
H2 : 2.000000
OH : 17.000000
H2O : 18.000000
HO2 : 33.000000
H2O2 : 34.000000
C : 12.000000
CH : 13.000000
CH2 : 14.000000
CH2(S) : 14.000000
CH3 : 15.000000
CH4 : 16.000000
CO : 28.000000
CO2 : 44.000000
HCO : 29.000000
CH2O : 30.000000
CH2OH : 31.000000
CH3O : 31.000000
CH3OH : 32.000000
C2H : 25.000000
C2H2 : 26.000000
C2H3 : 27.000000
C2H4 : 28.000000
C2H5 : 29.000000
C2H6 : 30.000000
CH2CO : 42.000000
HCCO : 41.000000
HCCOH : 42.000000
H2CN : 28.000000
HCN : 27.000000
HNO : 31.000000
N : 14.000000
NNH : 29.000000
N2O : 44.000000
NH : 15.000000
NH2 : 16.000000
NH3 : 17.000000
NO : 30.000000
NO2 : 46.000000
HCNO : 43.000000
HOCN : 43.000000
HNCO : 43.000000
NCO : 42.000000
CN : 26.000000
HCNN : 41.000000
N2 : 28.000000
AR : 40.000000
C3H8 : 44.000000
C3H7 : 43.000000
CH3CHO : 44.000000
CH2CHO : 43.000000
Attachment needed:
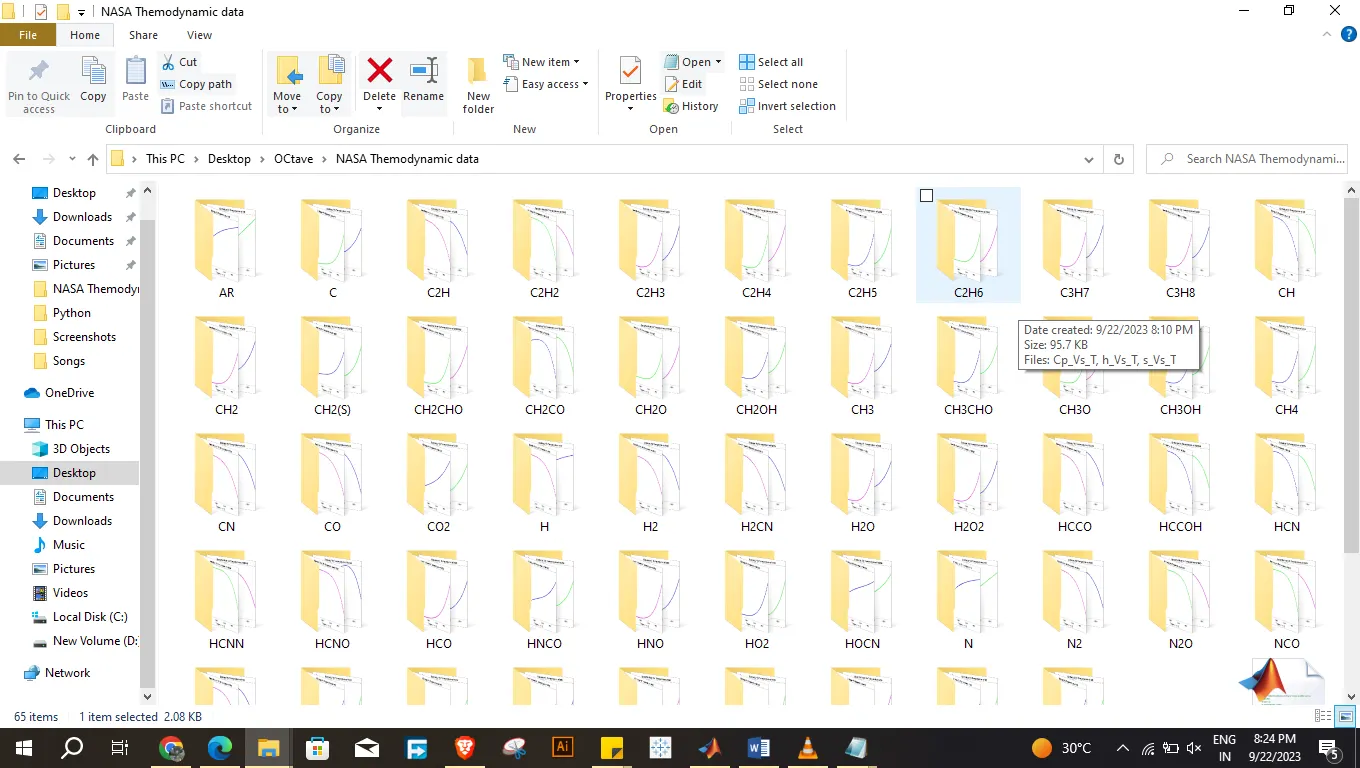
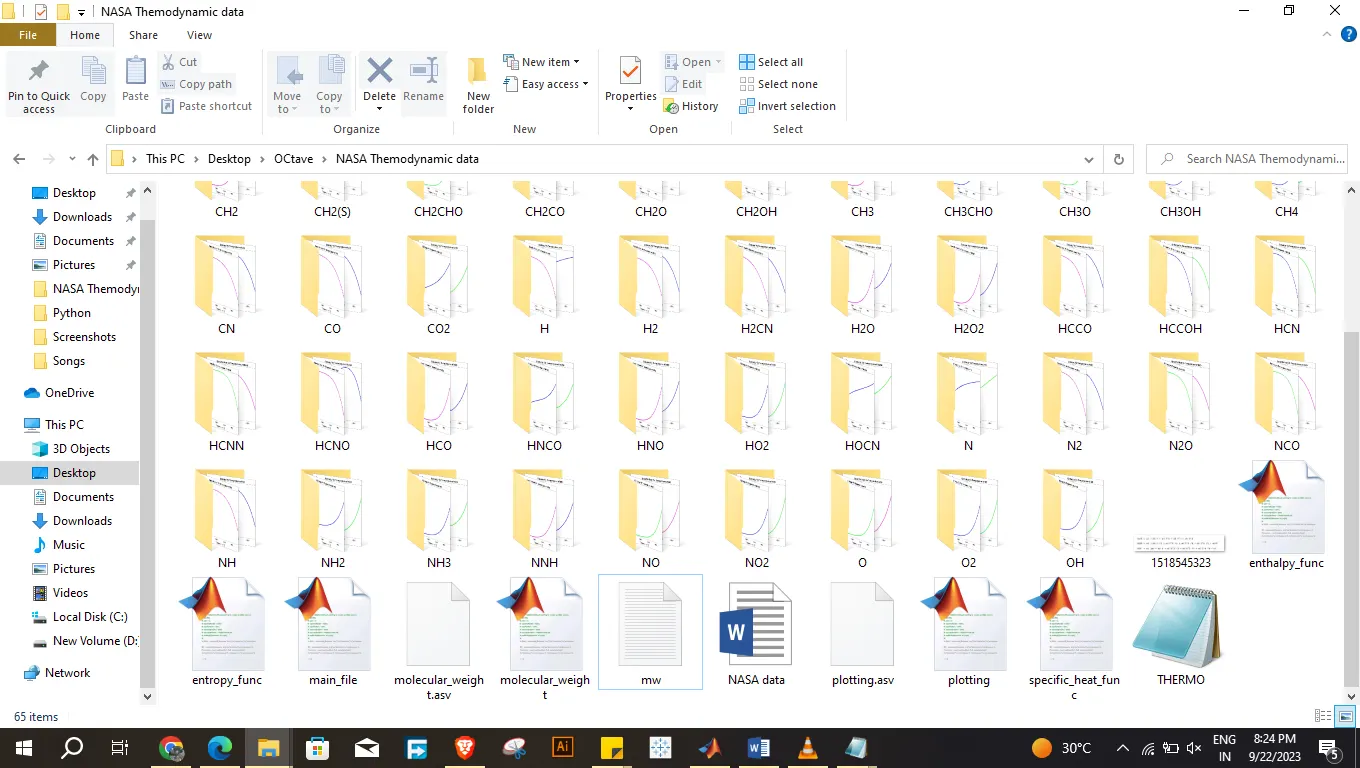
- Screenshot of the window where all the folders are saved.
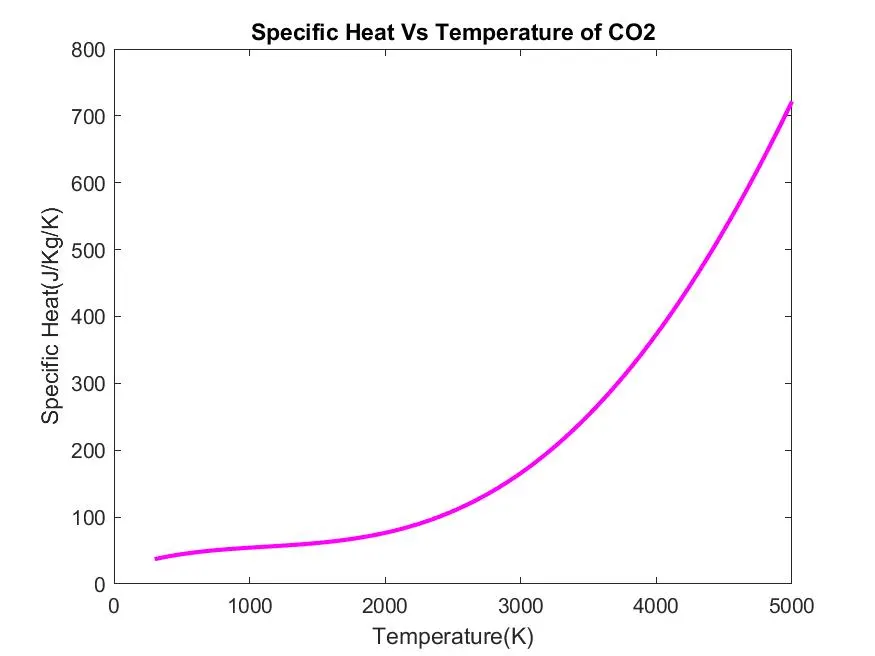
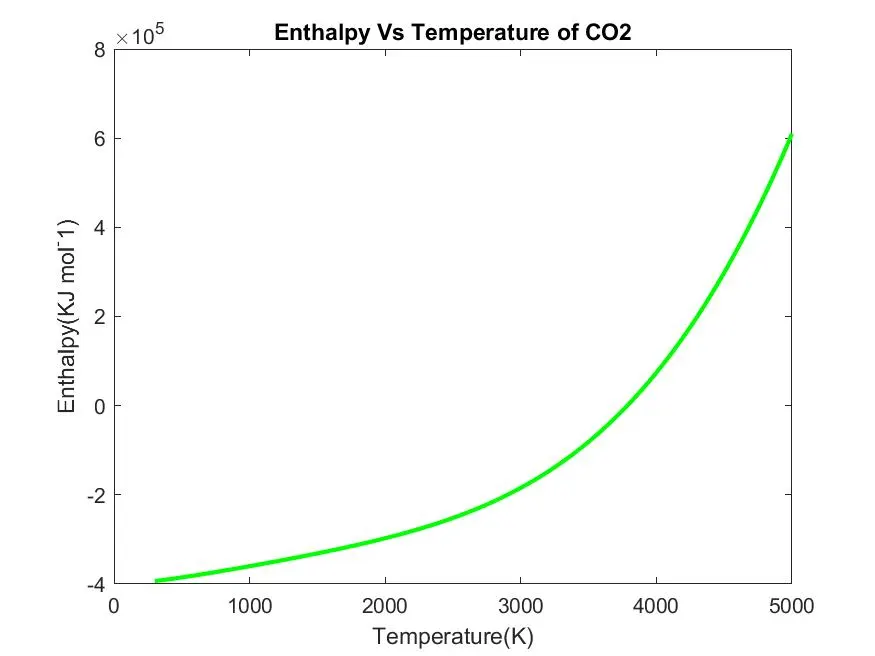
- Plots for o2, N2 and Co2 species (your program should be case insensitive, if it is going to take the species name as an input).
O2:
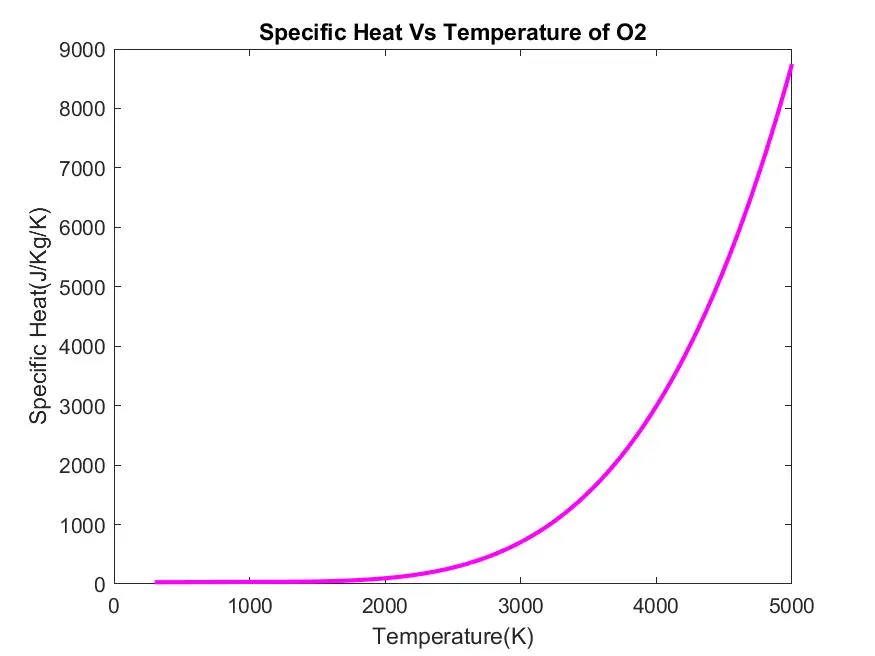
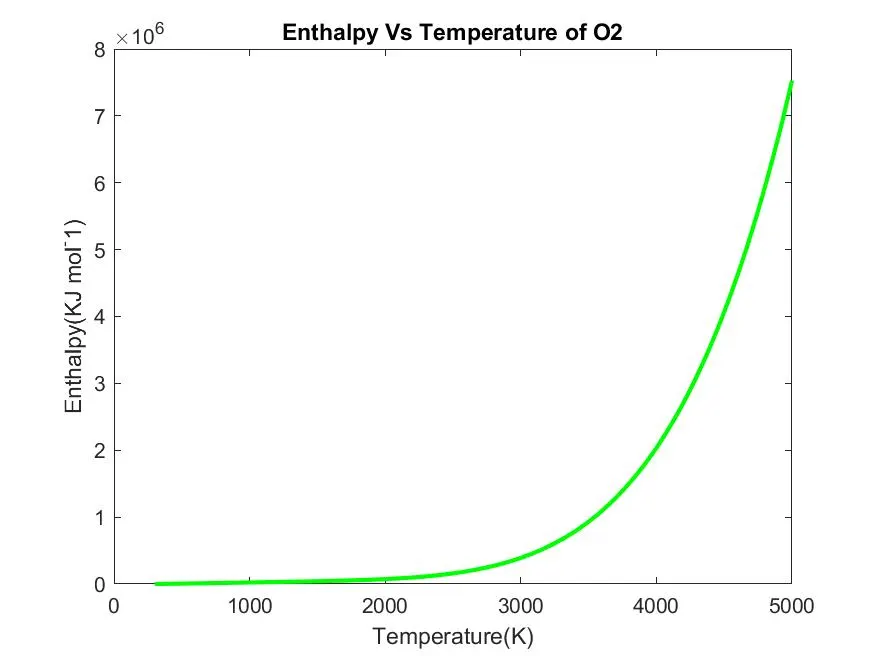
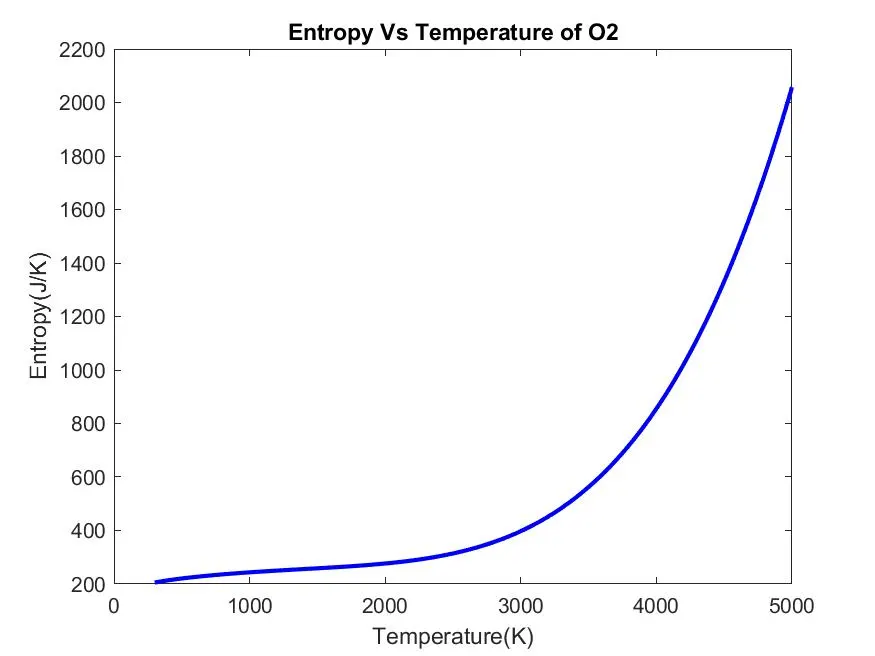
N2:
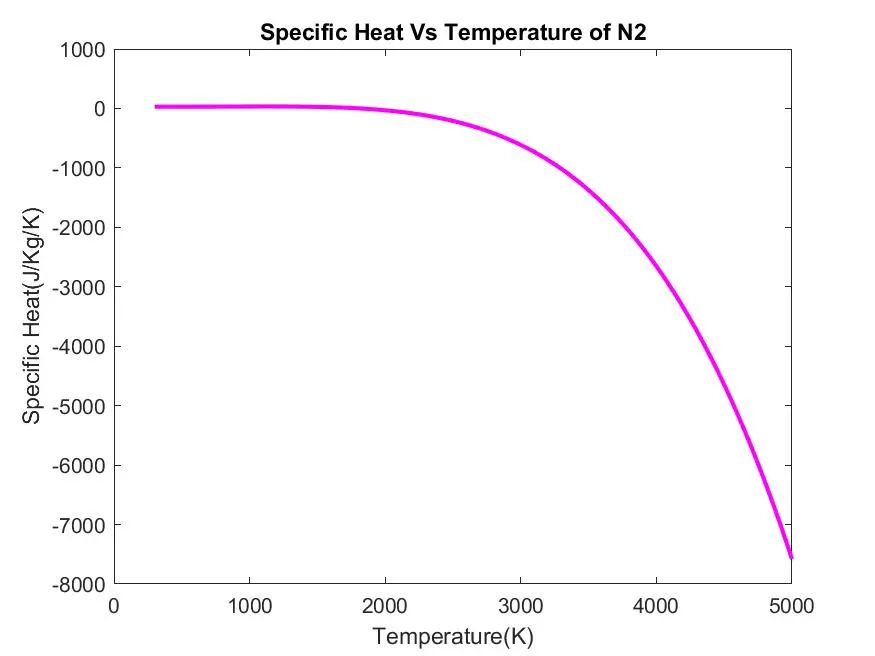
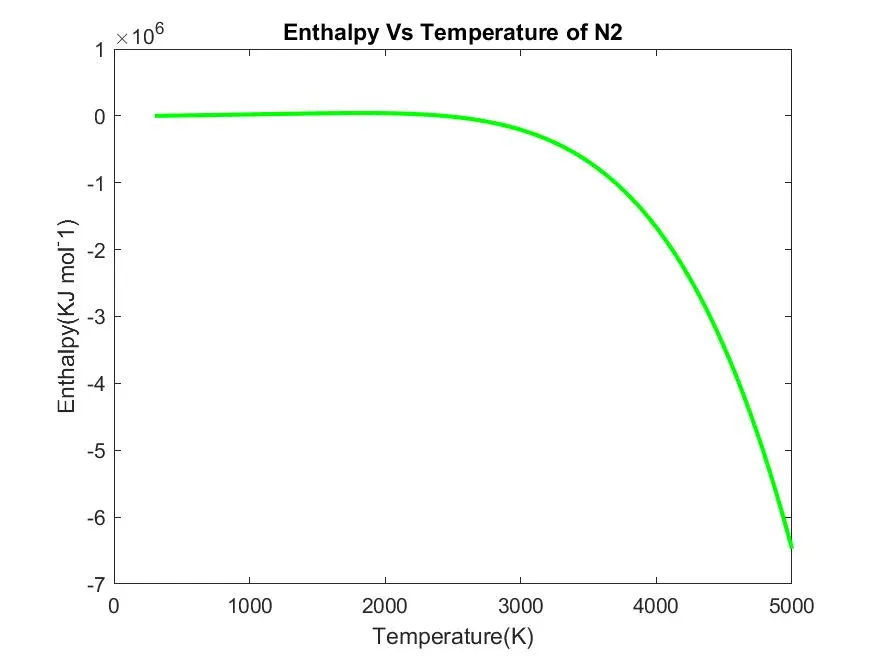
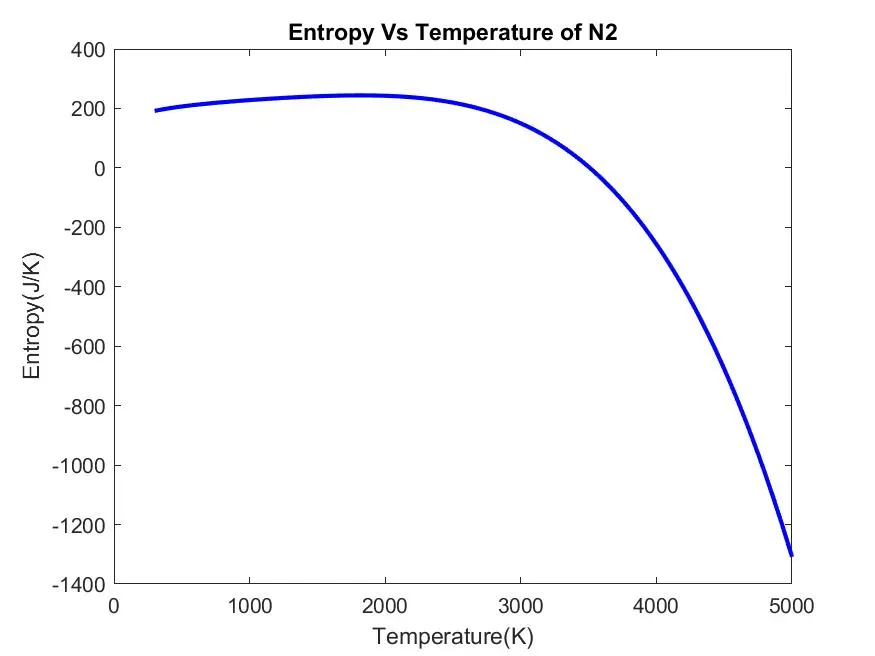
CO2:
Conclusion:
Thermodynamic data are generated with the give 'THERMO.dat' file and evaluated the properties of Specific Heat(Cp),Entropy(s), Enthalpy(h) by extracting the co-efficient of each species and save the plots as image file in the each folder with the respective name of the species.
Reference link:
https://in.mathworks.com/help/matlab/ref/mkdir.html
http://combustion.berkeley.edu/gri-mech/version30/files30/thermo30.dat
https://shepherd.caltech.edu/EDL/PublicResources/sdt/formats/chemkin.html
http://combustion.berkeley.edu/gri-mech/data/nasa_plnm.html
https://in.mathworks.com/matlabcentral/fileexchange/126784-thermodynamics