Project 1 - Parsing NASA thermodynamic data
Aim
1. Write a function that extracts the 14 co-efficients and calculates the enthalpy, entropy and specific heats for all the species in the data file
before writing the program we have to download the thermodynamic file from the given datafile and after that we have to find the cp,h,S for the proogram which created and finally the molecular weights of the atoms in the file
and we have to understand the specific heat, Enthalpy,entropy and molecular weight of the atoms
Molecular weight
The sum of the atomic masses of all atoms in a molecule, based on a scale in which the atomic masses of hydrogen, carbon, nitrogen, and oxygen are 1, 12, 14, and 16
Program for the file
f1 = fopen('THERMO.dat','r');
fgetl(f1);
temp = str2num(fgetl(f1));
%Global temparture
g_low = temp(1);
g_mid = temp(2);
g_high= temp(3);
for i = 1:3
fgetl(f1);
end
for j = 1:53
line = fgetl(f1);
A = strsplit(line,' ');
% to identify species
species =(A{1});
% Local_temparture
low_t = str2num(A{end-3});
high_t = str2num(A{end-2});
mid_t = str2num(A{end-1});
%co-efficients of A_line between A1 - A5
a_line = fgetl(f1);
a = findstr(a_line,'E');
% converting the strings to number
a1 = a_line(1:a(1)+3);
a1 = str2num(a1);
a2 = a_line(a(1)+4:a(2)+3);
a2 = str2num(a2);
a3 = a_line(a(2)+4:a(3)+3);
a3 = str2num(a3);
a4 = a_line(a(3)+4:a(4)+3);
a4 = str2num(a4);
a5 = a_line(a(4)+4:a(5)+3);
a5 = str2num(a5);
% Coefficients of B_line between B1 - B5
b_line = fgetl(f1);
b = findstr(b_line,'E');
%converting the Strings to number
b1 = b_line(1:b(1)+3);
b1 = str2num(b1);
b2 = b_line(b(1)+4:b(2)+3);
b2 = str2num(b2);
b3 = b_line(b(2)+4:b(3)+3);
b3 = str2num(b3);
b4 = b_line(b(3)+4:b(4)+3);
b4 = str2num(b4);
b5 = b_line(b(4)+4:b(5)+3);
b5 = str2num(b5);
% Coefficient of C_line between C11 - C14
c_line = fgetl(f1);
c = findstr(c_line,'E');
%converting the Strings to Number
c1 = c_line(1:c(1)+3);
c1 = str2num(c1);
c2 = c_line(c(1)+4:c(2)+3);
c2 = str2num(c2);
c3 = c_line(c(2)+4:c(3)+3);
c3 = str2num(c3);
c4 = c_line(c(3)+4:c(4)+3);
c4 = str2num(c4);
% Calculating the specific heat, enthalpy, entropy @ High temparture
R = 8.3145;
T_H = linspace(low_t,mid_t,100);
cp = (a1+(a2.*T_H)+(a3.*T_H.^2)+(a4.*T_H.^3)+(a5.*T_H.^4))*R;
H = (a1+(a2.*T_H/2)+(a3.*(T_H.^2)/3)+(a4.*(T_H.^3)/4)+(a5.*(T_H.^4)/5)+b1.*T_H)*R;
S = (a1*log(T_H)+(a2.*T_H)+(a3.*(T_H.^2)/2)+(a4.*(T_H.^3)/3)+(a5.*(T_H.^4)/4)+b2)*R;
% Calculating the specific heat, enthalpy, entropy @ Low temparture
T_L = linspace(mid_t,high_t,100);
cp1 = (b3+(b4.*T_L)+(b5.*T_L.^2)+(c1.*T_L.^3)+(c2.*T_L.^4))*R;
H1 = (b3+(b4.*T_L/2)+(b5.*(T_L.^2)/3)+(c1.*(T_L.^3)/4)+(c2.*(T_L.^4)/5)+c3.*T_L)*R;
S1 = (b3*log(T_L)+(b4.*T_L)+(b5.*(T_L.^2)/2)+(c1.*(T_L.^3)/3)+(c2.*(T_L.^4)/4)+c4)*R;
% To create a folder
str = sprintf('E:\\Project_1_nasa\\Nasa_therm_data\\%s',species);
mkdir(str);
cd(str);
% ploting the figures of specific heat,Enthalpy,entropy
figure(1)
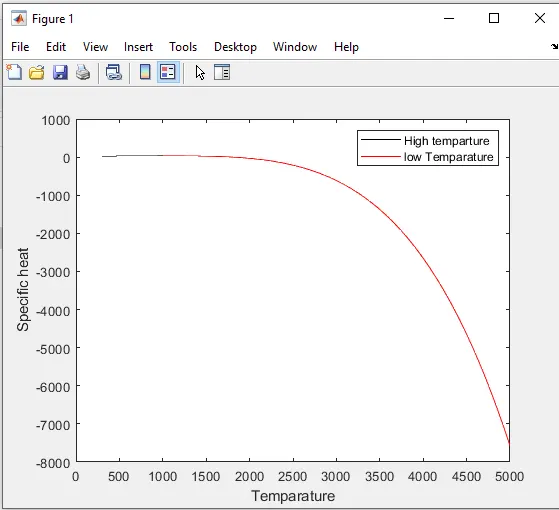
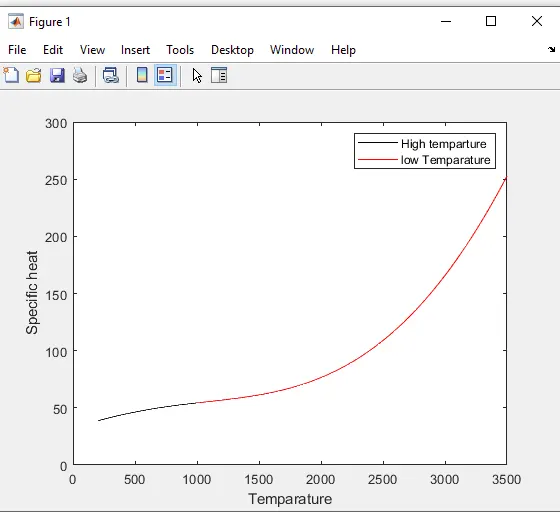
plot(T_H,cp,'color','K')
hold on
plot(T_L,cp1,'color','r')
hold off
xlabel('Temparature')
ylabel('Specific heat')
legend('High temparture','low Temparature')
saveas (gcf,'Specific heat')
figure(2)
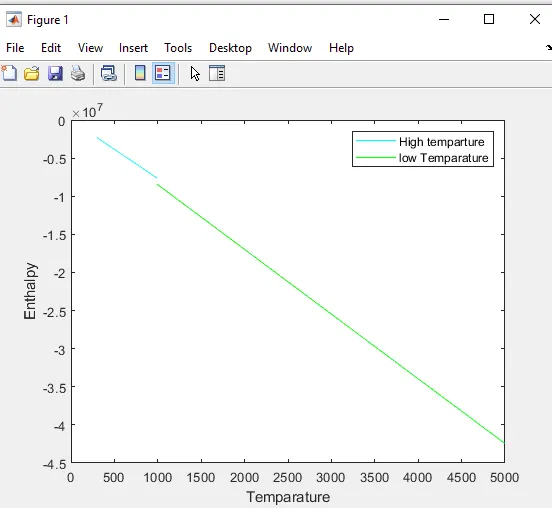
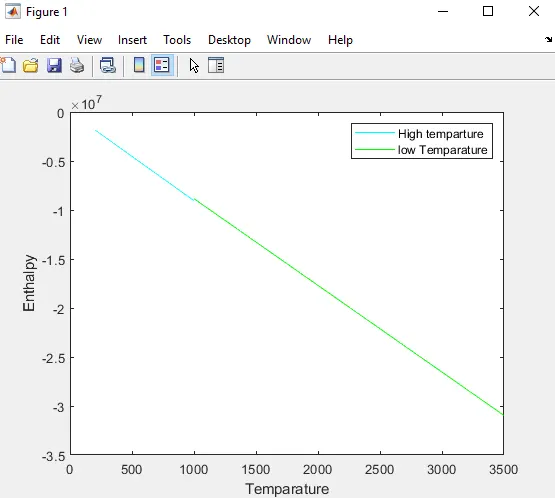
plot(T_H,H,'color','c')
hold on
plot(T_L,H1,'Color','g')
hold off
xlabel('Temparature')
ylabel('Enthalpy')
legend('High temparture','low Temparature')
saveas(gcf,'Enthalpy')
figure(3)
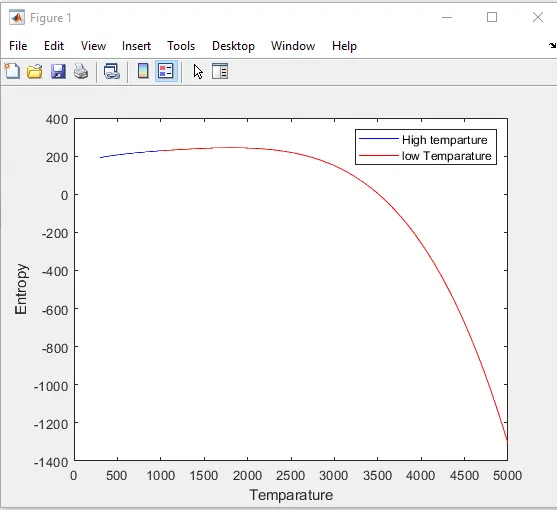
plot(T_H,S,'Color','b')
hold on
plot(T_L,S1,'Color','r')
hold off
xlabel('Temparature')
ylabel('Entropy')
legend('High temparture','low Temparature')
saveas(gcf,'Entropy')
cd ..
%To calculate Molecular weight
elements = ['H','C','N','O','AR','(S)'];
Atomic_weight = [1,12,14,16,40,0,0,0,0];
molecular_wt = 0;
for k = 1:length(species);
[num,status] = str2num(species(k));
if status == 0;
Tt = find(elements == species(k));
molecular_wt(k) = Atomic_weight(Tt);
else
molecular_wt(k-1) = num*molecular_wt(k-1);
end
end
t_M=sum(molecular_wt);
K = sprintf('Molecular weight of %s is %f',species,t_M);
disp(K)
end
Explanation
By this program we are able to get the output values of specific het,enthalpy, entropy and molecular weights for the nasa thermodynamic data
Commands used to get the code in the data file
Fgetl
Fopen
First with the use of fopen command we can able to open the thermo.data file and after that with the use of Fgetl command we can able to get the lines we want to load the variable from the file
By using fgetl command we can skip the first three lines of the file because the lines are header file which not needed after that we can load the temperature strings of Global_temp = '300 1000 5000'
with these strings we can find the low,mid,and high temperatures and convert the strings to the number using str2num command
afterthat we can identify the coefficients of a,b,c seperately using the method which used to convert the string to number in temperature convertion for the first line of the three coeffiecients are taken with1:a,b,c because it was a starting variable of the line after that for a2,b2,andc2 we can use the string of a1 due to were a2 starts from the ending of the a1 like that we can find those 14 coefficents
To find the Cp,S,H outputs
with this formula which is given to identify the cp,S,H for the data file with the high_temperature and low_temperature using linspace commands
after finding the outputs for the cp,h,and s we can now plot the figures of Enthalpy,Entrophy and Specific heat with the first seven coefficients as high temperature and second seven coefficient are low temperature and then with the mdir command we can able to create the directory which we need to save the figures in a same directory
After that to find the molecular weight of the species with the same str2num command and then we can run the program to get the needed output plots and molecular weights of the species
Errors faced while programing
While programing the data for cp,s,and h gets the error of arrays are not compitable in sizes and resolved it by rearranging the temperature function
while creating molecular weight gets Undefined function 'find' for input arguments of type 'string' used "=', instead of ' = ='
Screenshots of output
Function file for finding coefficients and main program to identify molecular weight are attached
plots for N2
Plots for O2
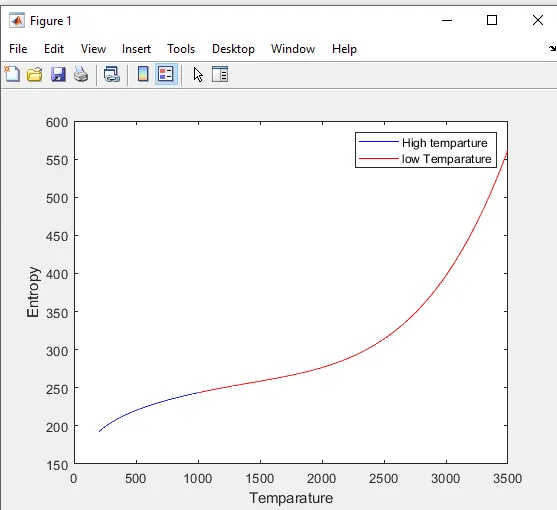
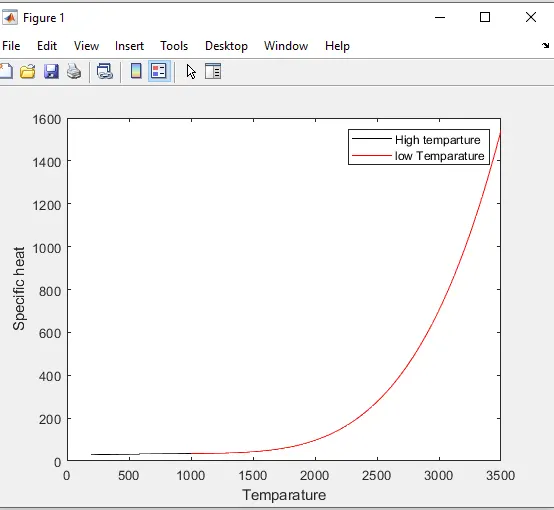
Plots for Co2
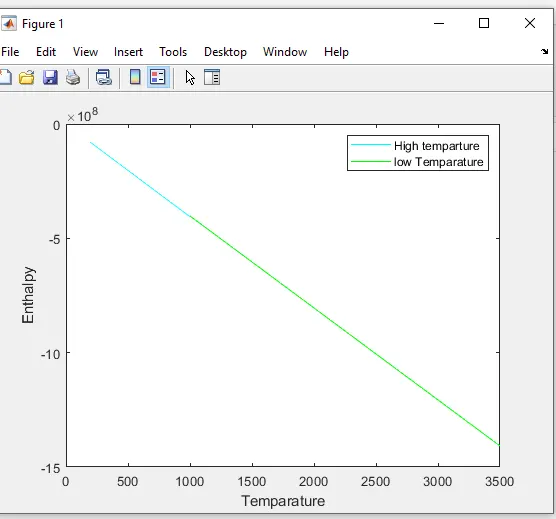
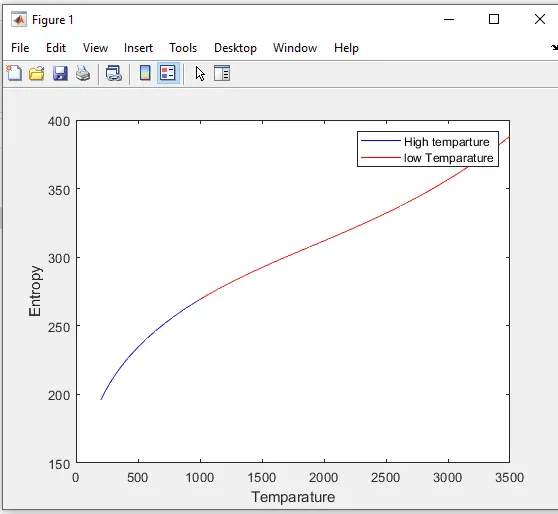
Drive link for plots of species