Project 1 - Parsing NASA thermodynamic data
NASA came up with polynomials that can be used to evaluate thermodynamic properties such as Cp, H and S. They have also documented the co-efficients that are required to evaluate these polynomials for 1000+ species.
To guide you we have broken down the problem into meaningful bits that you can work on individually.
1. Write a function that extracts the 14 co-efficients and calculates the enthalpy, entropy and specific heats for all the species in the data file. You will be reading this file NASA thermodynamic data(Tip: use fopen and fgetl). The formulae are shown below.
Here R is the universal gas constant, T is the temeprature
The FIRST 7 coefficients are HIGH-temperature coefficients and the SECOND 7 coefficients are LOW-temperature coefficients.
Also use the LOCAL TEMPERATURE RANGES which is unique for each individual species, not the GLOBAL TEMPERATURE RANGE.
2. Calculate the molecular weight of each species and display it in the command window.
3. Plot the Cp, Enthalpy and Entropy for the local temperature range (low temperature : high temperature) specific for each species.
4. Save the plots as images with appropriate names and dump them in separate folders for each species with suitable name. All these should be generated automatically.
5. The main program that you will submit will just take the "THERMO.dat" file as an input and generate Cp, H and S plots.
6. Please write a detailed report to describe your logic.
Attachments needed:
- Screenshot of the window where all the folders are saved.
- Plots for o2, N2 and Co2 species (your program should be case insensitive, if it is going to take the species name as an input).
NOTE:
The presentation of your code will be taken into consideration while grading. Labelling sections of your code using comments is appreciated.
Content expected in the report:
- Step-wise explanation of your code.
- Mention the errors faced while programming.
- Steps taken to overcome those errors.
- Screenshots showing errors thrown in command window.
Under references, mention the literature or online material you have used during your research.
GENERAL INSTRUCTIONS:
- The codes, plots, images, GIFs, and videos should be submitted only through the answer box.
- Use the Google Drive to share only the cad models or other answers which couldn't be done through the answer box.
NOTE:
- Violating the above instructions will lead to ZERO marks.
- Link sharing should be enabled while sharing the Google Drive link, else the challenge will be awarded ZERO marks.
For dysfunctional or inaccurate links 1 mark will be awarded
Just submitting your code without the report will result in a 0 grade
Your Answers
AIM:
To write a code in MATLAB tomparse nasa thermodynamic data file and then calculate thermodynamic properties of various gas species.
OBJECTIVE:
1. write a function that extracts the 14 coefficients and calculates the enthalpy, entropy and specific heats for all the species in the data file.
2.calculate molecular weight of each species.
3.Plotting the specific heat, enthalpy and entropy for the local temperature range.
4.Saving tge plots as images with appropriate names and dumping them in separate folders for each species.
THEORY:
file parsing:
File parsing is a string or symbol either in natural language computer language or data structure conferming to the rules of the former grammer.
RESULT:
1 The code for file parsing is done.
2. The graph for N2 O2 and CO2 is poltted
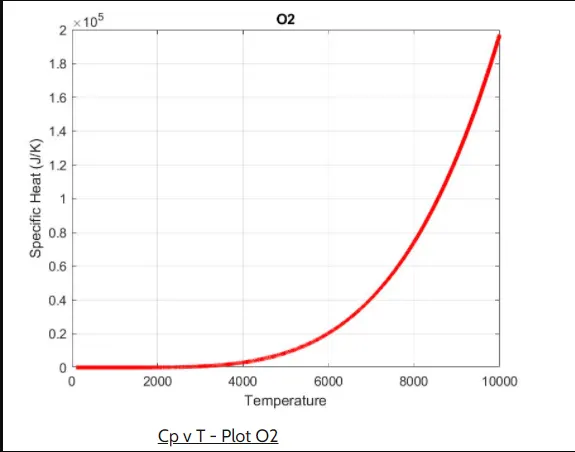
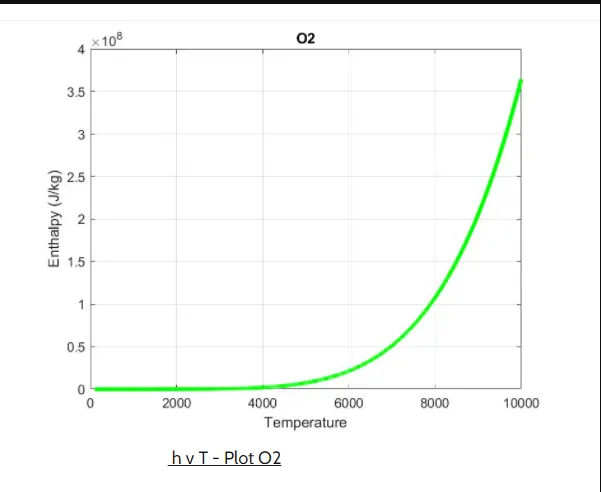
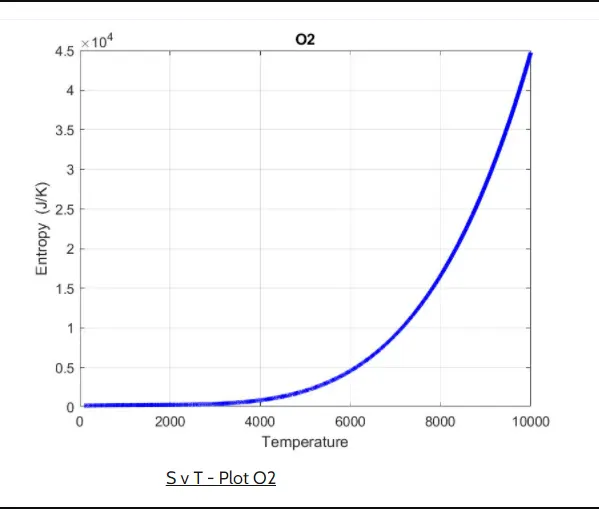
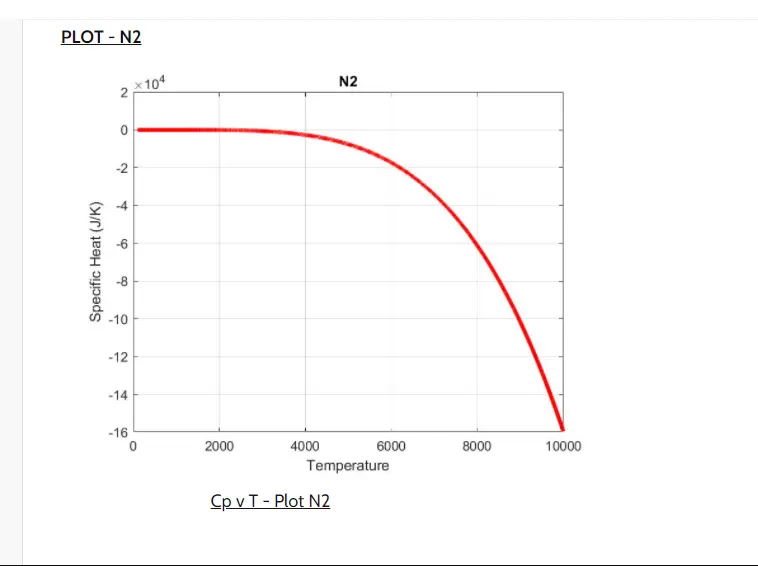
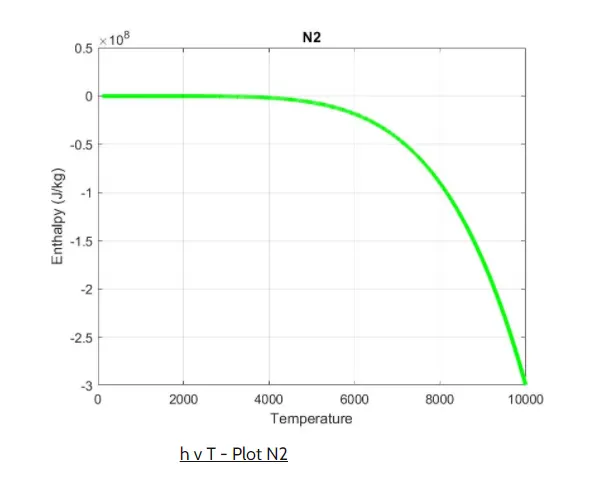
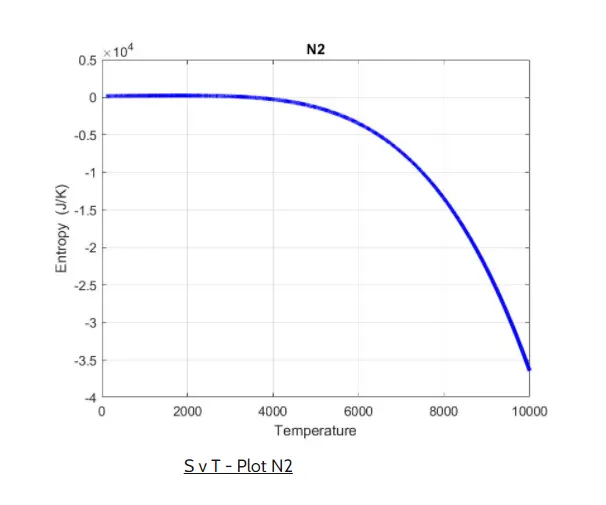
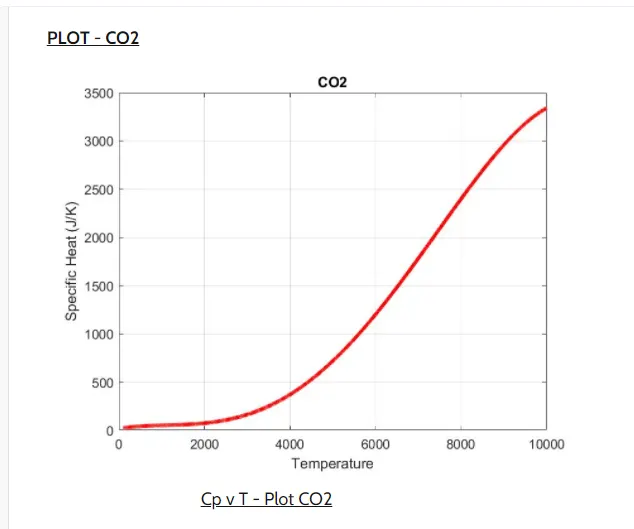
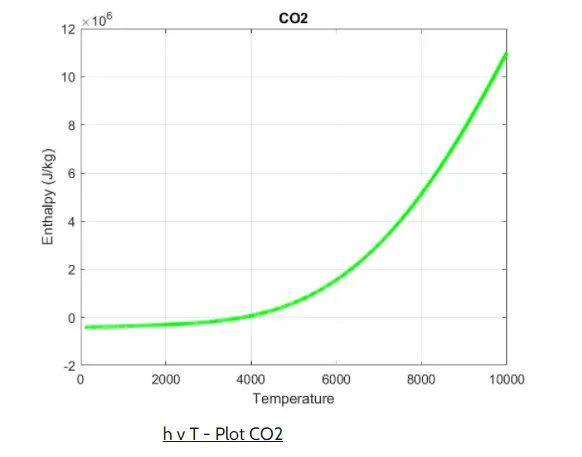
%function code moecular weight
function[m] = molecular_weight(species_name)
Atomic_mass = [15,999, 1.008, 12.011, 14.007, 39.948]
Elements = ['o', 'H', 'c', 'N', 'A'];

mol_wt = 0;
for i=1:length(species_name)
    for j=1:length(Elements)
        if strcmpi(species_name(i),Elements(j))
            mol_wt = mol_wt + Atomic_mass(j);
            z = j;
        end
    end
    var = str2double(species_name(i));
    if (var>1)
        mol_wt = mol_wt+(Atomic_mass(z)*(var-1));
    end
end
m = mol_wt;
end

%entropy code
function[entropy] = specific_heat_cal(a1,a2,a3,a4,a5,a6,a7,a8,a9,a10,a11,a12,~,a14,local_low_temp,local_mid_temp,local_high_temp,T)
if(T>local_mid_temp)
    s = (a1*log(T)+(a2*T)+(a3*(T.^2)/2)+(a4*(T.^3))+(a5*(T.^4)/4)+a7);
else
    s = (a8*log(T)+(a9*T)+(a10*(T.^2)/2)+(a11*(T.^3))+(a12*(T.^4)/4)+a14);
end

%enthalpy code
function[enthalpy] = specific_heat_cal(a1,a2,a3,a4,a5,a6,a7,a8,a9,a10,a11,a12,~,a14,local_low_temp,local_mid_temp,local_high_temp,T)
if(T>local_mid_temp)
    h = (a1*T+(a2*(T.^2)/2)+(a3*(T.^3)/3)+(a4*(T.^4)/4)+(a5*(T.^5)/5)+a6);
else
    h = (a8*T+(a9*(T.^2)/2)+(a10*(T.^3)/3)+(a11*(T.^4)/4)+(a12*(T.^5)/5)+a13);
end


%specificheat function
function[c_p] = specific_heat_cal(a1,a2,a3,a4,a5,a6,a7,a8,a9,a10,a11,a12,~,a14,local_low_temp,local_mid_temp,local_high_temp,T)
if(T>local_mid_temp)
    c_p = (a1+(a2*t)+(a3*(T.^2))+(a4*(T.^3))+(a5*(T.^4)));
else
    c_p = (a8+(a9*T)+(a10*(T.^2))+(a11*(T.^3))+(a12*(T.^4)));
end


%getting the data file
R = 8.314;
f1 = fopen('THERMO.dat','r');
tline1=fgetl(f1);
tline2=fgetl(f1);

%reading yhe header information

temp = strsplit(tline2,'');
global_low_temp=str2num(temp{2});
global_mid_temp=str2num(temp{3});
global_high_temp=str2num(temp{4});

%neglecting 3 unwamted lines
for i = 1:3
   skippedlines = fgetl(f1);
end

%reading the species
for i=1:53
     tline3=fgetl(f1);
     s = strsplit(tline3,'');
     species_name = s{1};
     A = strfind(tline3, 'G');
     temp_values=tline3(A+4:length(tline3));
     B=strsplit(temp_values,'');
     local_low_temp=str2double(B{1});
     local_mid_temp=str2double(B{3});
     local_high_temp=str2double(B{2});


     tline4 = fgetl(f1);
     f=strfind(tline4,'E');
     a1=str2double(tline4(1:(f(1)+3)));
     a2=str2double(tline4(f(1)+4:(f(2)+3)));
     a3=str2double(tline4(f(2)+4:(f(3)+3)));
     a4=str2double(tline4(f(3)+4:(f(4)+3)));
     a5=str2double(tline4(f(4)+4:(f(5)+3)));


     tline5=fgetl(f1);
     a6=str2double(tline5(1:(f(1)+3)));
     a7=str2double(tline5(f(1)+4:(f(2)+3)));
     a8=str2double(tline5(f(2)+4:(f(3)+3)));
     a9=str2double(tline5(f(3)+4:(f(4)+3)));
     a10=str2double(tline5(f(4)+4:(f(5)+3)));

     tline6=fgetl(f1);
     a11=str2double(tline6(1:(f(1)+3)));
     a12=str2double(tline6(f(1)+4:(f(2)+3)));
     a13=str2double(tline6(f(2)+4:(f(3)+3)));
     a14=str2double(tline6(f(3)+4:(f(4)+3)));

     T = linspace(local_low_temp,local_high_temp,100);
     c_p = R*specific_heat_cal(a1,a2,a3,a4,a5,a6,a7,a8,a9,a10,a11,a12,a13,a14,local_low_temp,local_mid_temp,local_high_temp,T);
     s = R*specific_heat_cal(a1,a2,a3,a4,a5,a6,a7,a8,a9,a10,a11,a12,a13,a14,local_low_temp,local_mid_temp,local_high_temp,T);
     h = specific_heat_cal(a1,a2,a3,a4,a5,a6,a7,a8,a9,a10,a11,a12,a13,a14,local_low_temp,local_mid_temp,local_high_temp,T);
     req_species = ["O2","N2","CO2"];

     if(species_name==req_species(1))||(species_name==req_species(2))||(species_name==req_species(3))
         mkdir(species_name);
         cd(species_name)


         figure(1)
         plot(T,c_p)
         title('specific heat vs temperature')
         xlabel('temperature')
         ylabel('specific heat')
         image=getframe(gfc);
         imwrite(image.cdata,'cp vs T.png')
         saveas(1,'specific_heat','jpg')


         figure(2)
         plot(T,s)
         title('enthalpy vs temperature')
         xlabel('temperature')
         ylabel('enthalpy')
         image=getframe(gfc);
         imwrite(image.cdata,'s vs T.png')
         saveas(2,'enthalpy','jpg')

         figure(3)
         plot(T,s)
         title('entropy vs temperature')
         xlabel('temperature')
         ylabel('entropy')
         image=getframe(gfc);
         imwrite(image.cdata,'cp vs T.png')
         saveas(3,'entropy','jpg')


         cd
     end

     molecular_wt = molecular_weight(species_name);
     k = sprintf('%s mol_wt = %f',species_name,molecular_wt);
     disp(k)
end