Project 1 - Parsing NASA thermodynamic data
AIM
Parsing NASA Thermodynamic Data
About
NASA came up with polynomials that can be used to evaluate thermodynamic properties such as Cp, H and S. They have also documented the coefficients that are required to evaluate the polynomials for 1000+ species.
Highlights
- Functions to extract the 14 coefficients and calculates the enthalpy, entropy and specific heats for all the species in the data file.
- The formula for calculations is shown below:

Here R is the universal gas constant, and T is the temperature.
- Note:
The FIRST 7 coefficients are HIGH-temperature coefficients and the SECOND 7 coefficients are LOW-temperature coefficients.
Also, the LOCAL TEMPERATURE RANGES are used which are unique for each individual species, not the GLOBAL TEMPERATURE RANGE.
- The molecular weights of each species are calculated.
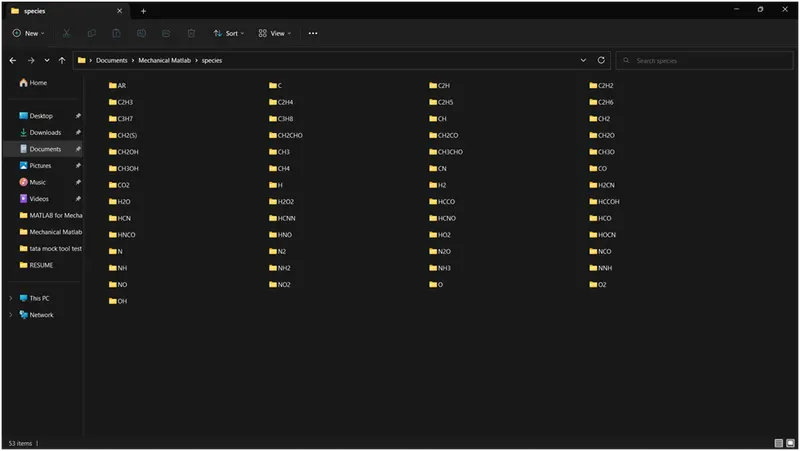
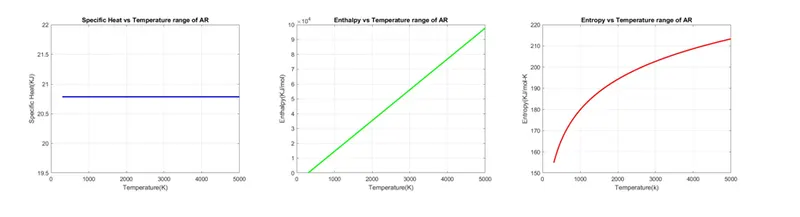
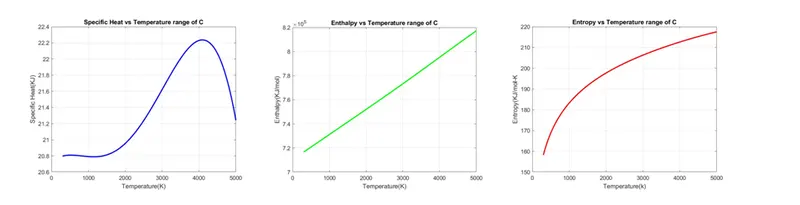
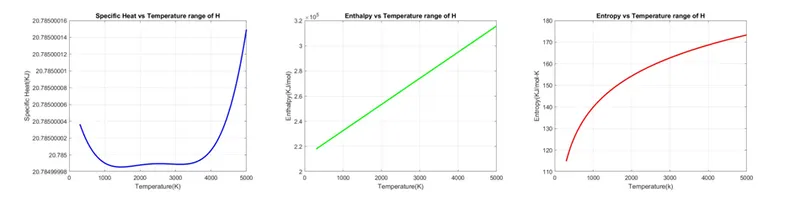
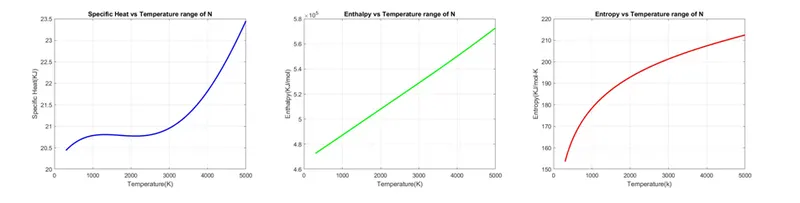
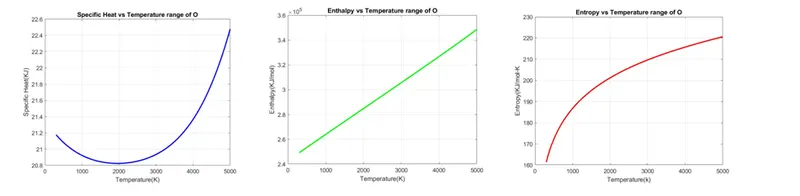
- Plots for Cp, Enthalpy and Entropy for the local temperature range (low temperature: high temperature) specific for each species are to be generated and stored in separate folders automatically.
- NASA Thermodynamic File:
THERMO.dat file is a data file containing 14 coefficients for 53 different elements given by NASA. These coefficients are utilized to calculate a particular element's specific heat, enthalpy and entropy. Each element has its own range of local temperatures.
LIST OF ELEMENTS
|
Ar |
C |
C2H |
C2H2 |
C2H3 |
C2H4 |
C2H5 |
C2H6 |
|
C3H7 |
C3H8 |
CH |
CH2 |
CH2(S) |
CH2CO |
CH2O |
CH3 |
|
CH3CHO |
CH3O |
CH3OH |
CH4 |
CN |
CO |
CO2 |
H |
|
H2 |
H2CN |
H2O |
H2O2 |
HCCO |
CCOH |
HCN |
HCNN |
|
HCNO |
HCO |
HNCO |
HNO |
HO2 |
HOCN |
N |
N2 |
|
N2O |
NCO |
NH |
NH2 |
NH3 |
NNH |
NO |
NO2 |
|
O |
O2 |
OH |
File Parsing
One of the most common tasks in research is analyzing data. Many computational chemistry programs output text files that include a large amount of information that is most important to you. In general, this is called file parsing.
Steps Taken
- Define the function.
- Create an Input Parser object.
- Add inputs to the scheme.
- Set properties to adjust parsing.
- Parse the inputs.
- Use the inputs in the function.
- Calling function.
- Generate useful plots.
Commands
- fopen – Open file, or obtain information about open files
Syntax
fileID = fopen(filename, permission)
This opens the file with the type of access specified by permission.
Permission: file access type, specified as a character vector or a string scalar. One can open a file in binary mode or in text mode. To open a file in binary mode, ‘a+’ creates a new file for reading or writing. Append data to the end of the file.
- fgetl - Read line from file, removing newline characters
Syntax
tline = fgetl(fileID)
This returns the next line of the specified file, removing the newline characters.
- If the file is nonempty, then fgetl returns tline as a character vector.
- If the file is empty and contains only the end-of-file marker, then fgetl returns tline as a numeric value -1.
- strsplit – Split string or character vector at the specified delimiter
Syntax
C = strsplit(str)
This splits str at whitespace into C. A whitespace character is equivalent to any sequence in the set {‘ ‘, ‘\f’, ‘\n’, ‘\r’, ‘\t’, ‘\v’}. If str has consecutive whitespace characters, then strsplit treats them as one whitespace.
- str2num – Convert character array or string to numeric array
Syntax
X = str2num(txt)
This converts a character array or string scalar to a numeric matrix. The input can include spaces, commas, and semicolons to indicate separate elements. If str2num cannot parse the input as numeric values, then it returns an empty matrix.
The str2num function does not convert cell arrays or nonscalar string arrays and is sensitive to spacing around + and – operators.
- strfind – Find strings within other strings
Syntax
k = strfind(str,pat)
k = strfind(str,pat) searches str for occurrences of pat. The output, k, indicates the starting index of each occurrence of pat in str. If pat is not found, then strfind returns an empty array, []. The strfind function executes a case-sensitive search.
- If str is a character vector or a string scalar, then strfind returns a vector of type double.
- If str is a cell array of character vectors or a string array, then strfind returns a cell array of vectors of type double.
- strcmp – Compare strings
Syntax
tf = strcmp(s1,s2)
This compares s1 and s2 and returns 1 (true) if the two are identical and 0 (false) otherwise. Text is considered identical if the size and content of each are the same. The return result tf(true or false result) is of data type logical.
The input arguments can be any combination of string arrays, character vectors, and cell arrays of character vectors.
- cd – Change the current folder
- pwd – Identify the current directory
- mkdir – Make a new folder
Syntax
mkdir folderName
This creates the folder folderName. If folderNAme exists, MATLAB issues a warning. If the operation is not successful, mkdir throws an error to the Command Window.
- saveas – Save the figure to a specific file format
Syntax
saveas(fig,filename)
This saves the figure or Simulink block diagram specified by fig to file filename. Specify the file name as a character vector or string that includes a file extension. The file extension defines the file format. If you do not specify an extension, then saveas saves the figure to a FIG-file. To save the current figure, specify fig as gcf.
- {_} consists of an array of class cells; basically, this type of class can contain any type of data. For example, line 20 in main code global_low_T = str2num(t{2}).
CODE EXPLANATION
- Making a directory using ‘mkdir’ with location address.
- After that, read the text file ‘Thermo.dat’ and open it by using ‘fopen’ and ‘r’ as reading commands.
- For reading the line in a text file using 'fgetl’.
- To obtain the temperature range, use ‘strsplit’ to split the temperature into a particular string cell.
- Used ‘str2num’ for converting string cells to numbers.
- Divided the temperature into a string and then converted to a number so that temperature values can be used separately to solve the NASA thermodynamics.
- Using ‘for & end’ loops to skip the next three comment lines in the text file.
- Reading all the 53 species to plot specific heat(Cp), enthalpy(H), and entropy(S), with temperature values, and to find the molecular weights.
- Used ‘for’ loop to read 53 species.
- Used ‘strfind’ to find string.
- Using ‘linspace’ specified the temperature range from low to high.
- Adding universal gas constant value ‘R’.
- Extracted higher and lower temperature coefficients by reading line by line from the species.
- Calling specific heat, enthalpy, and entropy function codes.
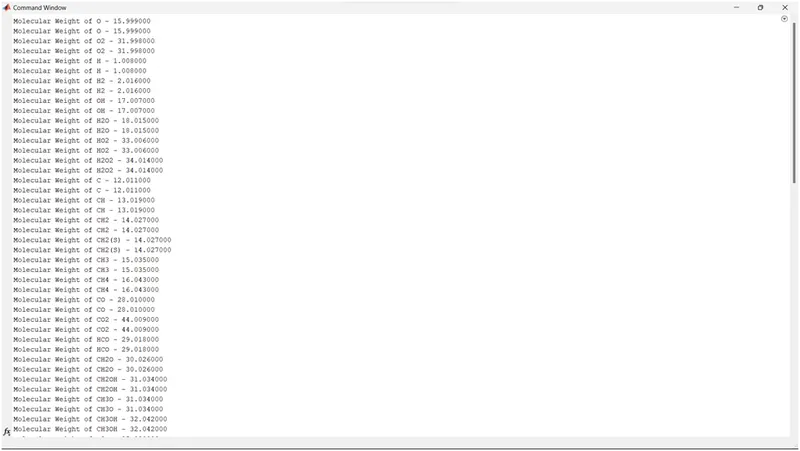
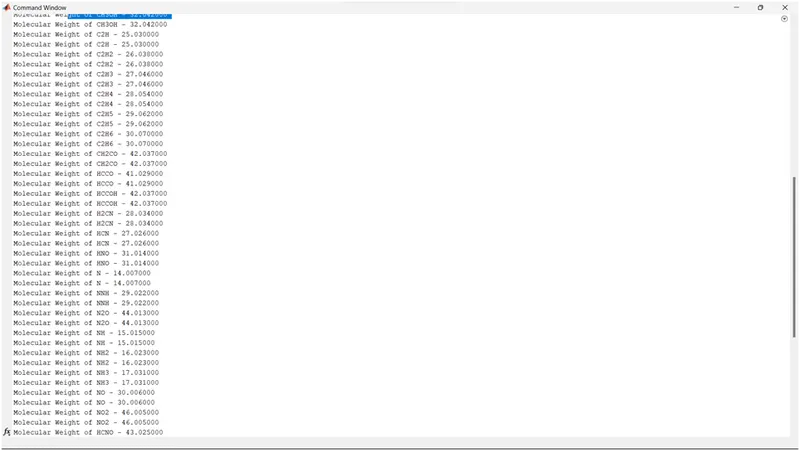
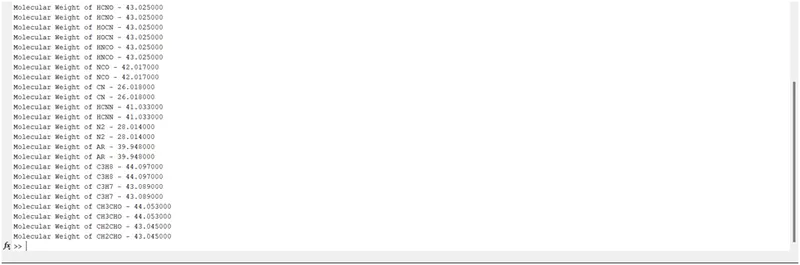
- Calculating Molecular weight.
CODE
Function Code
Specific Heat
It is the amount of energy that must be added, in the form of heat, to one unit of mass of the substance in order to cause an increase of one unit in its temperature.
Code
% function %
% calculating specific heat %

function [Cp] = specificheat(a1,a2,a3,a4,a5,a8,a9,a10,a11,a12,T,R,global_mid_T)

% calculating specific heat for higher and lower temperature respectively
% for low global temperature - minimum coefficients are considered
% else maximum coefficients

if T <= global_mid_T
    Cp = R.*(a8 + a9.*T + a10.*T.^2 + a11.*T.^3 + a12.*T.^4);
else
    Cp = R.*(a1 + a2.*T + a3.*T.^2 + a4.*T.^3 + a5.*T.^4);
end

end
Enthalpy
Enthalpy refers to the sum of a system’s internal energy with the product of its pressure and volume. In a system enclosed so as to prevent the mass transfer, for processes at constant pressure, the heat absorbed or released equals the change in enthalpy.
Code
% function %
% calculating enthalpy %

function [H] = enthalpy(a1,a2,a3,a4,a5,a6,a8,a9,a10,a11,a12,a13,T,R,global_mid_T)

% calculating enthalpy for higher and lower temperature respectively
% for low global temperature - minimum coefficients are considered
% else maximum coefficients

if T <= global_mid_T
    H = R.*T.*(a8 + (a9.*T)/2 + (a10.*(T.^2))/3 + (a11.*(T.^3))/4 + (a12.*(T.^4))/5 + (a13)./T);
else
    H = R.*T.*(a1 + (a2.*T)/2 + (a3.*(T.^2))/3 + (a4.*(T.^3))/4 + (a5.*(T.^4))/5 + (a6)./T);
end

end
Entropy
Entropy measures a system’s thermal energy per unit temperature that is unavailable for doing useful work.
Code
% function %
% calculating entropy %

function [S] = entropy(a1,a2,a3,a4,a5,a7,a8,a9,a10,a11,a12,a14,T,R,global_mid_T)

% calculating entropy for higher and lower temperature respectively
% for low global temperature - minimum coefficients are considered
% else maximum coefficients

if T <= global_mid_T
    S = R.*(a8.*log(T) + a9.*T + a10.*(T.^2)/2 + a11.*(T.^3)/3 + a12.*(T.^4)/4 + a14);
else
    S = R.*(a1.*log(T) + a2.*T + a3.*(T.^2)/2 + a4.*(T.^3)/3 + a5.*(T.^4)/4 + a7);
end

end
Molecular Weight of Species
Code
% function
% calculating molecular weight

function [MW] = molecular_weight(species)

% creating arrayof elements
atoms_name = ['H','C','O','N','Ar'];
% storing theatomic mass value in the array
atoms_weight = [1.008 12.011 15.999 14.007 39.948];

% assigning empty variable value
MW = 0;

% creating for loop
for i = 1:length(species)

    for j = 1:length(atoms_name)

        % comparing the string value
        if strcmp(species(i),atoms_name(j))
            % if above comparison is true value of molecular mass is
            % calculated
            MW = MW + atoms_weight(j);
            % storing the position for further use
            position = j;
        end

    end

    % converting the string to number
    n = str2num(species(i));

    % comparing if the value of k is greater than executed the further
    % statements
    if n>1
        % molecular mass calculation
        MW = MW + atoms_weight(position)*(n-1);
    end

end

% command to print the molecular mass value of species
fprintf('Molecular Weight of %s - ',species);
fprintf('%f',MW);
disp(' ');

end
Main Code
% MAIN CODE %
% parsing NASA thermodynamic data %

close all
clear all
clc

% Input values
R = 8.314;  % universal gas constant

% opening file in reading mode
f1 = fopen('THERMO.dat','r');
fgetl(f1);

global_T = fgetl(f1);

t = strsplit(global_T);

% Converting string cells to numbers using strnum
global_low_T = str2num(t{2});
global_mid_T = str2num(t{3});
global_high_T = str2num(t{4});

% temperature range and gas constant
% temperature range assumed
T = linspace(global_low_T,global_high_T,1000);

% Skipping three comment line from the file
for i = 1:3
    k = fgetl(f1);
end

for j = 1:53
    tline = fgetl(f1);
    A = strsplit(tline,' ');
    species = (A{1});

    % extracting the coefficients from first line
    tline1 = fgetl(f1);
    a = strfind(tline1,'E');

    % converting string to number
    low_T = str2num(A{end-3});
    mid_T = str2num(A{end-2});
    high_T = str2num(A{end-1});

    % Extracting higher and lower temperature coefficients
    % Extracting FIRST 7 coefficients i.e. HIGH-temperature coefficient

    a1 = tline1(1:a(1)+3);
    a1 = str2num(a1);

    a2 = tline1(a(1)+4:a(2)+3);
    a2 = str2num(a2);

    a3 = tline1(a(2)+4:a(3)+3);
    a3 = str2num(a3);

    a4 = tline1(a(3)+4:a(4)+3);
    a4 = str2num(a4);

    a5 = tline1(a(4)+4:a(5)+3);
    a5 = str2num(a5);

    tline2 = fgetl(f1);
    b = strfind(tline2,'E');

    a6 = tline2(1:b(1)+3);
    a6 = str2num(a6);

    a7 = tline2(b(1)+4:b(2)+3);
    a7 = str2num(a7);

    % finding lower coefficients
    a8 = tline2(b(2):b(3)+3);
    a8 = str2num(a8);

    a9 = tline2(b(3)+4:b(4)+3);
    a9 = str2num(a9);

    a10 = tline2(b(4)+4:b(5)+3);
    a10 = str2num(a10);

    tline3 = fgetl(f1);
    c = strfind(tline3,'E');

    a11 = tline3(1:c(1)+3);
    a11 = str2num(a11);

    a12 = tline3(c(1)+4:c(2)+3);
    a12 = str2num(a12);

    a13 = tline3(c(2)+4:c(3)+3);
    a13 = str2num(a13);

    a14 = tline3(c(3)+4:c(4)+3);
    a14 = str2num(a14);

    % calculate specific heat
    Cp = specificheat(a1,a2,a3,a4,a5,a8,a9,a10,a11,a12,T,R,global_mid_T);

    % calculating enthalpy
    H = enthalpy(a1,a2,a3,a4,a5,a6,a8,a9,a10,a11,a12,a13,T,R,global_mid_T);

    % calculating entropy
    S = entropy(a1,a2,a3,a4,a5,a7,a8,a9,a10,a11,a12,a14,T,R,global_mid_T);

    % calculate molecular weight of the species
    MW = molecular_weight(species);

    % writing molecular weight file
    MW_list = fopen('molecular weight.txt','a+');
    fprintf(MW_list,'Molecular weight of %s is %d \n',species,MW);
    fclose(MW_list);

    % Plotting Cp, H and S with temperature
    % Saving in a folder
    cd('C:\Users\hp\Documents\Mechanical Matlab\species');
    mkdir(species);
    cd(species);

    % plot1 Cp vs T
    figure(1)
    plot(T,Cp,'linewidth',2,'color','b');
    xlabel('Temperature(K)');
    ylabel('Specific Heat(KJ)');
    title(sprintf('Specific Heat vs Temperature range of %s',species));
    grid on
    saveas(figure(1),'specific heat.jpg');

    % Plot2 H vs T
    figure(2)
    plot(T,H,'linewidth',2,'color','g');
    xlabel('Temperature(K)');
    ylabel('Enthalpy(KJ/mol)');
    title(sprintf('Enthalpy vs Temperature range of %s',species));
    grid on
    saveas(figure(2),'Enthalpy.jpg');

    % Plot3 S vs T
    figure(3)
    plot(T,S,'LineWidth',2,'Color','r');
    xlabel('Temperature(k)');
    ylabel('Entropy(KJ/mol-K');
    title(sprintf('Entropy vs Temperature range of %s',species));
    grid on
    saveas(figure(3),'Entropy.jpg');

    cd('C:\Users\hp\Documents\Mechanical Matlab');

    % Molecular Weight
    W = molecular_weight(species);

end
OUTPUT
Molecular Weight Output in Command Window
Folder with plots of Different Species
Plots for atoms
- Ar
- C
- H
- N
- O
Drive Link