Project 1 - Parsing NASA thermodynamic data
Aim-write a code to prasing nasa thermodynamic file and also calculated the thermodynamic properties (Cp,H,S) of various gas species and also plots in figures.
File Parsing- parsing,syntax analysis is the process ofanalyzing a string of symbolsand others the term parsing comes from the latin pars meaning part of speech. aims at facilitating performing some kind of transformation on the data.
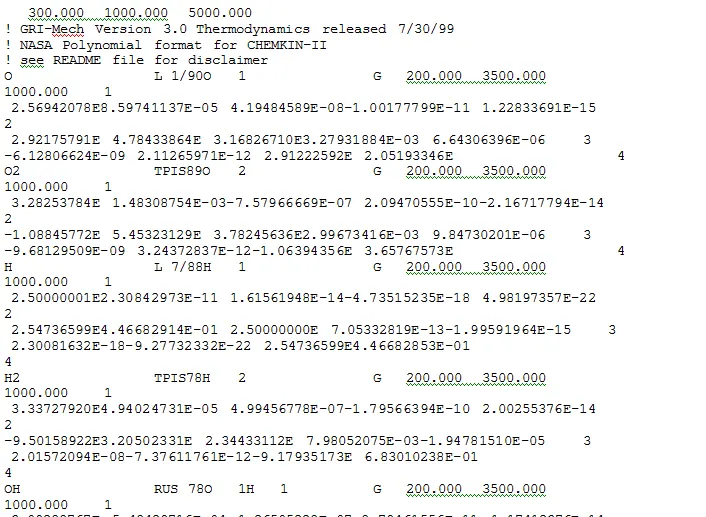
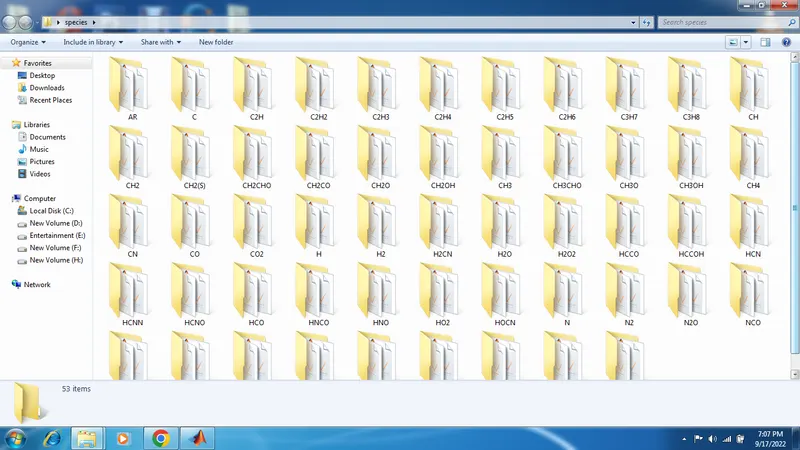
Thermodynamic file- The Nasa thermodynamic file which is THERMO.dat file in which there is temperature range and 53 species are given in these data and each species contain 14 coefficients and temperature ranges and we have to parse these 14 coefficients to find specific heat,Enthalpy & entropy.
NASA THERMO.dat file-
FORMULA- This three formula given below can useful to calculated to specific heat, enthalpy and entropy.

Specific heat-
specific heat is the heat required to raise the temperature of one gram of substance by one celcius degree.the specific heat unit is usally caloris or joules per gram per celcius degree.
Enrhalpy - Enthalpy is thermodyanamic property and enthalpy equal to the system's internal energy plus the product of its pressure and volume. In a system contained so as to prevent the mass transfer, for processes at constant pressure, the heat absorbed or released equals the change in enthalpy.
Entropy- The measure of a system's thermal energy per unit temperature that is unavailable for doing useful work. Because work is obtained from ordered molecular motion the amount of entropy is also a measure of the molecular disorder, or randomness, of a system.
MOLECULAR WEIGHT- Molecular weight is the measure of the sum of the atomic weight values of the atoms in a melecular. Molecular weight is used in chemistry to detemine stoichiomerty in chemical reactions and equations. Molecular weight is either unitless or expressed in terms of atomic mass units (amu) or Daltons (Da).
MAIN CODE -
clear all
close all
clc
% thermo file open and 'r' for reading the file
f=fopen('THERMO.dat','r');
% 1 to 5 skip the line
for i=1:5
    fgetl(f);    % fgetl command use for the choose line from a file
end
for j=1:53
% extraction of local temperatures
a=fgetl(f);
b=strsplit(a,' ');    % the splits are used for splitting the cell array
species=b{1};
low_temp= str2double(b{end-3});  % str2double  is conversion of string into number
high_temp= str2double(b{end-2});
middle_temp= str2double(b{end-1});


% extraction of coefficient
coeff_line1=fgetl(f);    % select the coefficient of line
% find position E
 pos_e=strfind(coeff_line1,'E');
 a1=str2double(coeff_line1(1:pos_e(1)+3));
 a2=str2double(coeff_line1((pos_e(1)+4):(pos_e(2)+3)));
 a3=str2double(coeff_line1((pos_e(2)+4):(pos_e(3)+3)));
 a4=str2double(coeff_line1((pos_e(3)+4):(pos_e(4)+3)));
 a5=str2double(coeff_line1((pos_e(4)+4):(pos_e(5)+3)));

coeff_line2=fgetl(f);
 pos_e1=strfind(coeff_line2,'E');
 a6=str2double(coeff_line2(1:pos_e1(1)+3));
 a7=str2double(coeff_line2((pos_e1(1)+4):(pos_e1(2)+3)));
 a8=str2double(coeff_line2((pos_e1(2)+4):(pos_e1(3)+3)));
 a9=str2double(coeff_line2((pos_e1(3)+4):(pos_e1(4)+3)));
 a10=str2double(coeff_line2((pos_e1(4)+4):(pos_e1(5)+3)));

 coeff_line3=fgetl(f);
 pos_e2=strfind(coeff_line3,'E');
  a11=str2double(coeff_line3(1:pos_e2(1)+3));
 a12=str2double(coeff_line3((pos_e2(1)+4):(pos_e2(2)+3)));
 a13=str2double(coeff_line3((pos_e2(2)+4):(pos_e2(3)+3)));
 a14=str2double(coeff_line3((pos_e2(3)+4):(pos_e2(4)+3)));

 % calulation Cp,H,S

 % creation of temp array
 T=linspace(low_temp,high_temp,1000);


% calulation Cp,H,S for htr
R=8.3145;
if T>middle_temp
Cp = (a1+(a2.*T)+(a3.*T.^2)+(a4.*T.^3)+(a5.*T.^4))*R;
H = (a1+(a2.*T/2)+(a3.*(T.^2)/3)+(a4.*(T.^3)/4)+(a5.*(T.^4)/5)+(a6./T))*R;
S = (a1*log(T)+(a2.*T)+(a3.*(T.^2)/2)+(a4.*(T.^3)/3)+(a5.*(T.^4)/4)+a7)*R;

 % calulation Cp,H,S for ltr
else
Cp = (a8+(a9.*T)+(a10.*T.^2)+(a11.*T.^3)+(a12.*T.^4))*R;
H=(a8+(a9.*T/2)+(a10.*(T.^2)/3)+(a11.*(T.^3)/4)+(a12.*(T.^4)/5)+(a13./T))*R;
S =(a8*log(T)+(a9.*T)+(a10.*(T.^2)/2)+(a11.*(T.^3)/3)+(a12.*(T.^4)/4)+a14)*R;

molecular_wt=molecular_weight(species);

end
cd('C:\Users\Sachin\Desktop\species\');
mkdir(species)
cd(species)

% plots

%Temperature vs specific heat
figure(1)
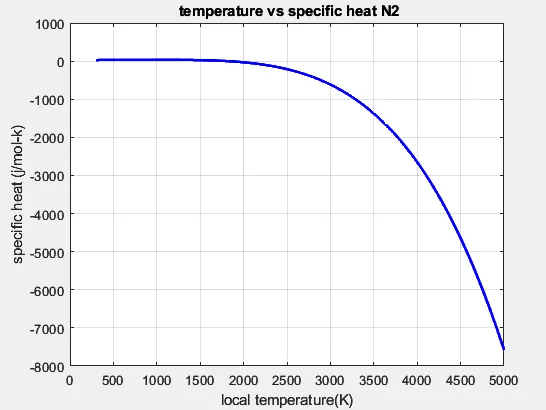
plot(T,Cp,'LineWidth',2,'color','b')
xlabel('local temperature(K)')
ylabel('specific heat (j/mol-k)')
grid on
title(sprintf(' temperature vs specific heat %s',species))
%Temperature vs specific heat
figure(2)
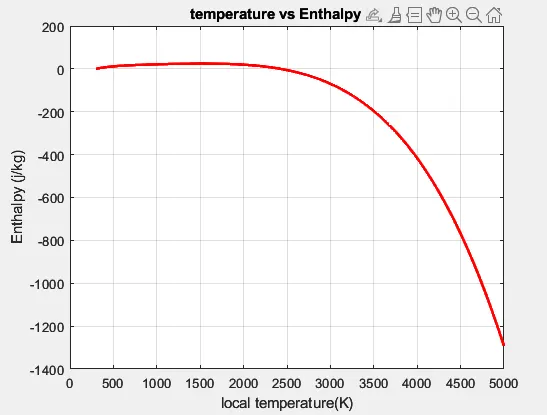
plot(T,H,'LineWidth',2,'color','r')
xlabel('local temperature(K)')
ylabel('Enthalpy (j/kg)')
grid on
title(sprintf('temperature vs Enthalpy %s',species))

%Temperature vs specific heat
figure(3)
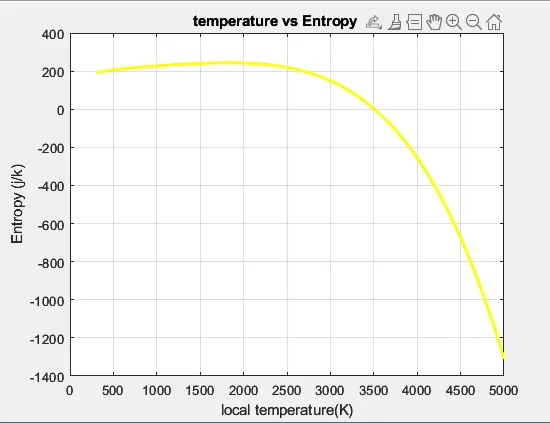
plot(T,S,'LineWidth',2,'color','Y')
xlabel('local temperature(K)')
ylabel('Entropy (j/k)')
grid on
title(sprintf(' temperature vs Entropy  %s',species))

% changing folder to species folder

saveas(figure(1),'cp,jpg');
saveas(figure(2),'H,jpg');
saveas(figure(3),'S,jpg');
cd(['C:\Users\Sachin\Desktop\species\',species]);
end
CODE FOR FUNCTION OF MOLECULAR WEIGHT-
% function for molecular weight

function W = molecular_weight(species)

atomic_name=['O','H','C','N','A'];
atomic_weight=[16 1 12 14 40];
% molecular_mass
W=0;
for i=1:length(species)
    for j=1:length(atomic_name)

        if strcmp(species(i),atomic_name(j))
            W=W+atomic_weight(j);
            location=j;
        end
    end

    n=str2double(species);
    if n>1
        W=W+atomic_weight(location)*(n-1);
    end
end
    fprintf('molecular_weight of %s',species);
    fprintf('%f',W);
    disp(' ')
    end
CODE EXPLANATION-
1) 1st write the three commands like clear all, close all and clc.
2) In the main program, gas constant is defind as the file THERMO.dat and it is opend using fopen command.
3) Extraction of local temperatures-
7) plotting is done for specific heat,Enthalpy & Entraopy in plotting one new command we added for changing the folder to species folder cd(['C:\Users\Sachin\Desktop\species\',species]); The cd commands is used for the changing the directory. Then we will use the ''saveas'' command to save the plots of different species in the directory folder. Now we will change the directory to which our main code file runs in MATLAB.
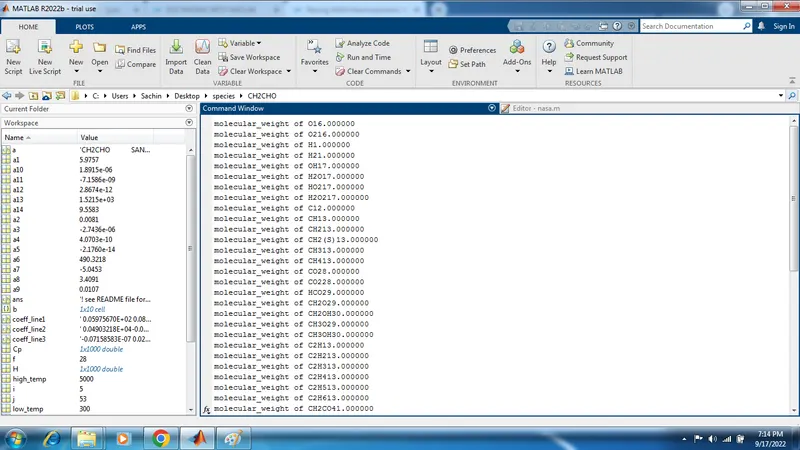
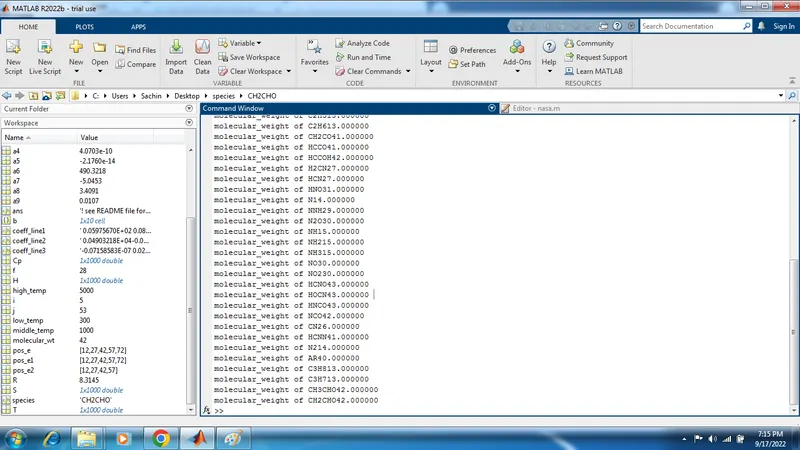
8) at end molecular weight is find out for all species.
Outputs-
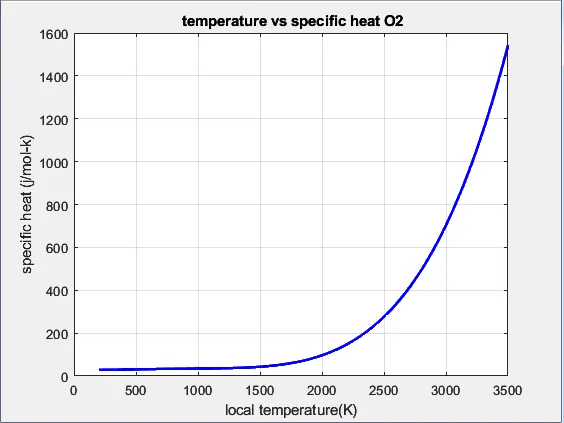
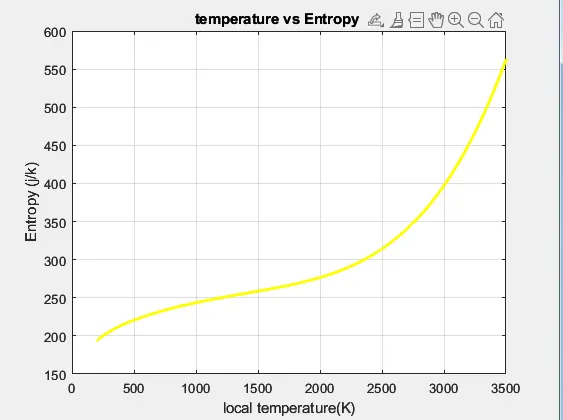
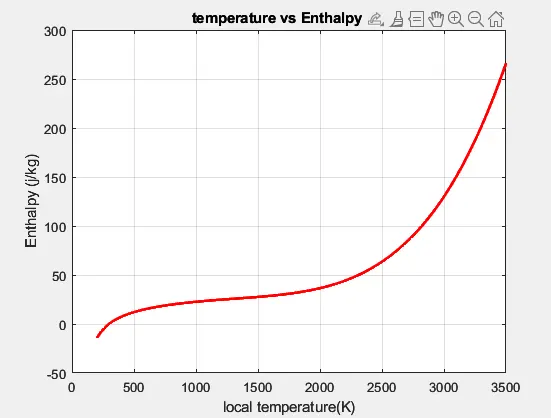
plots for O2-
plots for N2-
plots for CO2-
Screenshot of the window where all folders are saved -
workspace and Molecular weight values showing in command window -
CONCLUSION:
On successful parsing of data from NASA's Thermodynamic Data file, “variation of thermodynamic properties with temperature of certain species of molecules are observed with the help of plots” is obtained.