Project 1 - Parsing NASA thermodynamic data
AIM
To write a program for parsing the NASA thermodynamic data and calculating the molecular weight of each species.
Governing Equations
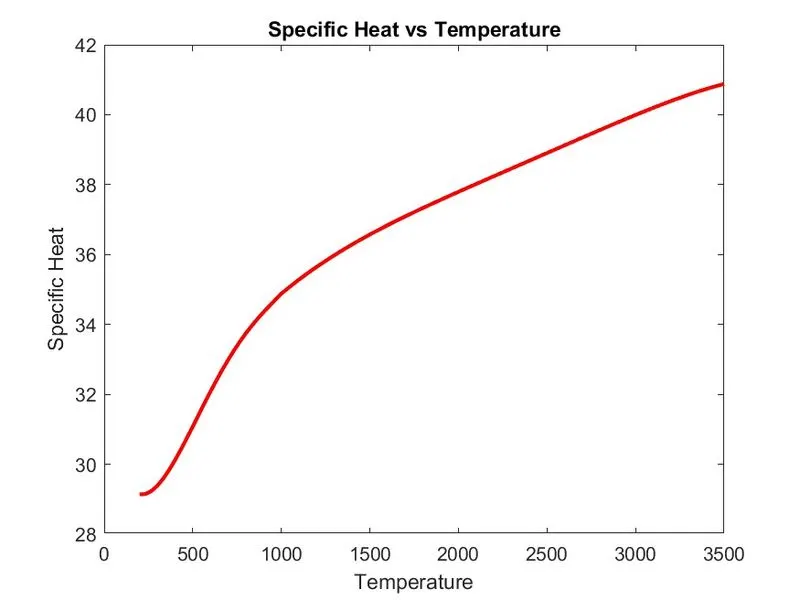
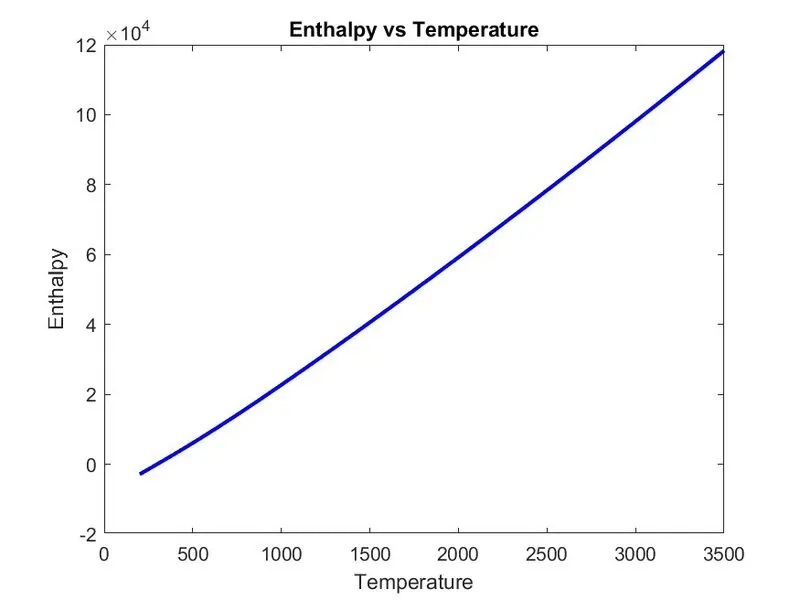
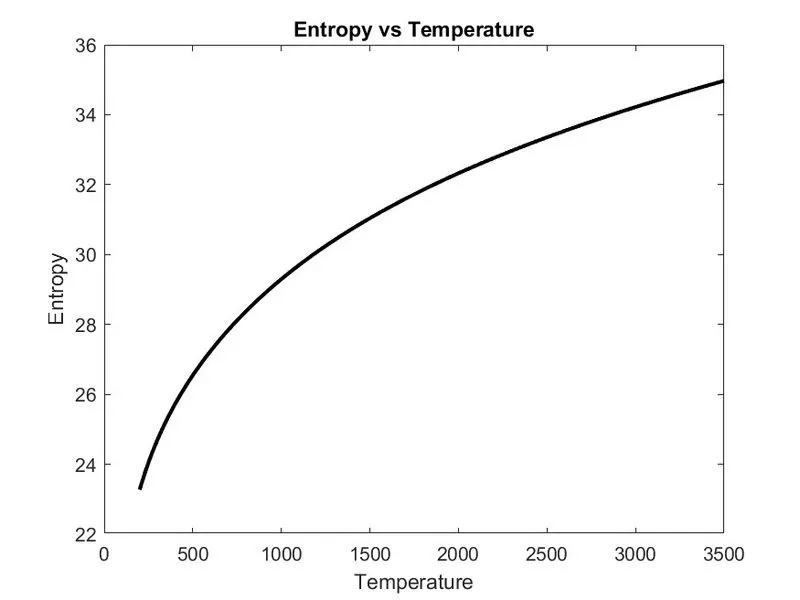
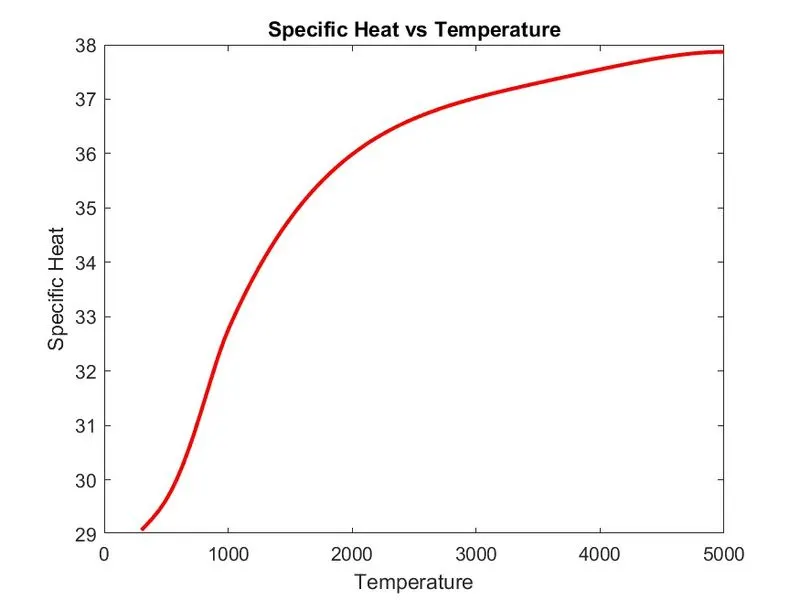
The equation to calculate specific heat, enthalpy and entropy is given below:
Cp = (a1 + a2 T + a3 T^2 + a4 T^3 + a5 T^4) R
H = (a1 + a2 T /2 + a3 T^2 /3 + a4 T^3 /4 + a5 T^4 /5 + a6 /T) R T
S = (a1 lnT + a2 T + a3 T^2 /2 + a4 T^3 /3 + a5 T^4 /4 + a7) R
where, Cp = Specific heat
H = Enthalpy
S = Entropy
T = Temperature
R = Universal gas constant = 8.314
a1 - a7 = Co-efficients at high temperature
a8 - a14 = Co-efficients at lower temperature
Objectives
1. To write a function that extracts the 14 co-efficients and calculates the enthalpy, entropy and specific heats for all the species in the data file.
2. To calculate the molecular weight of each species.
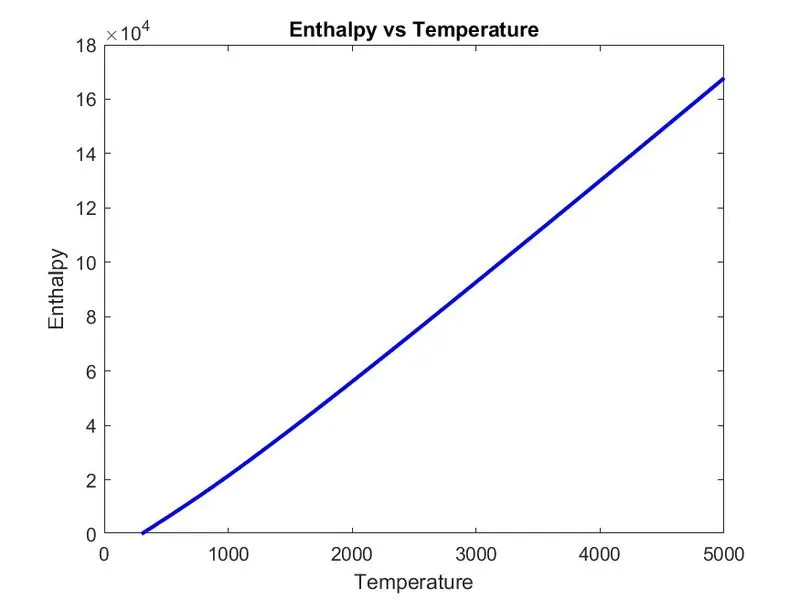
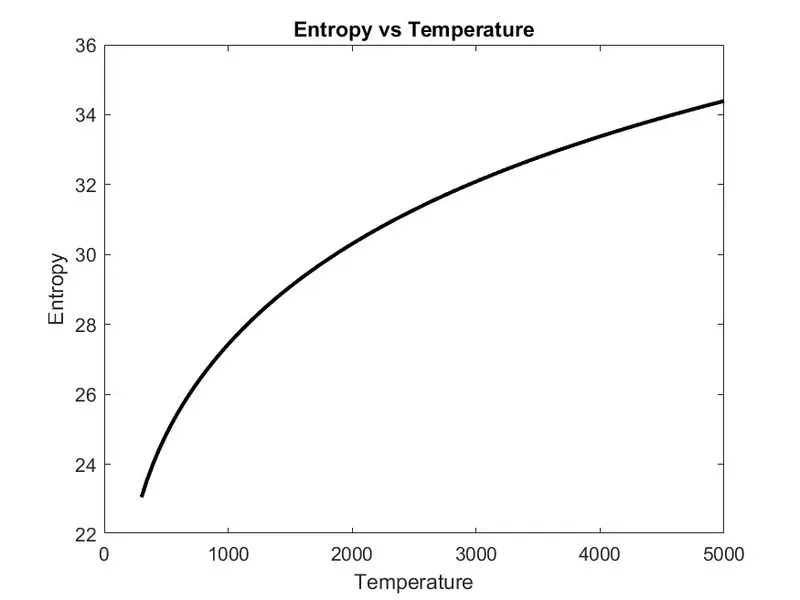
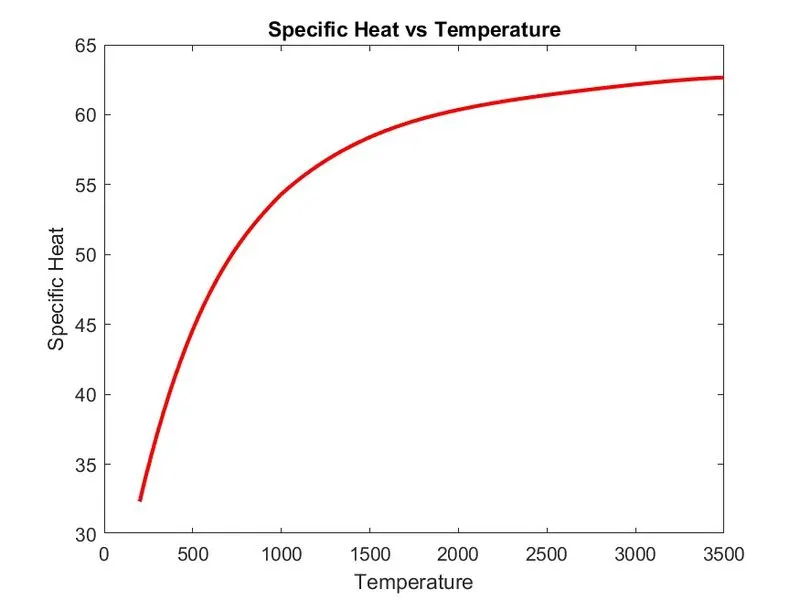
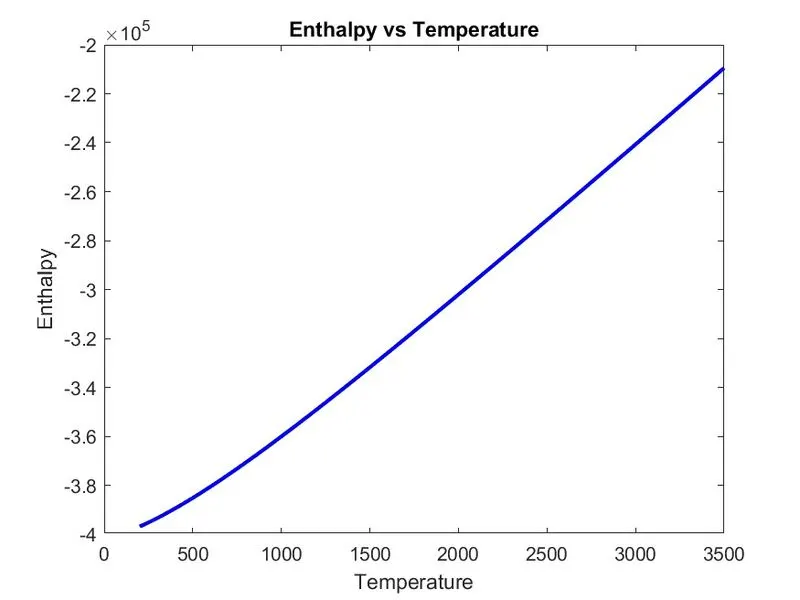
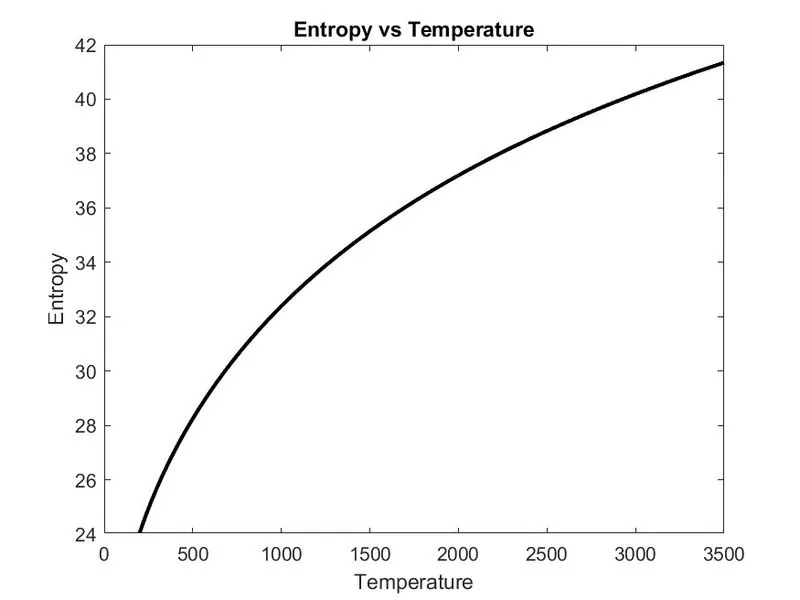
3. To plot the Cp, Enthalpy and Entropy for the local temperature range.
4. To save the plots as images with appropriate names and dump them in separate folders for each species with suitable name.
Codes
The main code for parsing the thermodynamic data and finding the specific heat, enthalpy and entropy is given below:
% Parsing the NASA thermodynamic data

clear all
close all
clc

% Get the data file
f1 = fopen('THERMO.dat','r');

% Get the heading of the file
Header = fgetl(f1);

% Splitting the string
global_temperature = fgetl(f1);
A = strsplit(global_temperature,' ');

% Global temperature range
global_low_temperature = str2num(A{2});
global_mid_temperature = str2num(A{3});
global_high_temperature = str2num(A{4});

% Skipping the next 3 lines
fgetl(f1);
fgetl(f1);
fgetl(f1);

number_of_gases = 53;

% Reading all line data
for i = 1:(number_of_gases)
    header = fgetl(f1);
    a = strsplit(header,' ');
    species_name = (a{1});
    % Read the local temperatures
    ltempl = str2num(a{end-3});   % Local Low temperature
    ltempm = str2num(a{end-1});   % Local Medium temperature
    ltemph = str2num(a{end-2});   % Local High temperature

    %find the coefficients
    tline1 = fgetl(f1);
    tline2 = fgetl(f1);
    tline3 = fgetl(f1);

    L1 = strfind(tline1,'E');         % Line 1
    coefficient1 = tline1(1:L1(1)+3);
    coefficient2 = tline1(L1(1)+4:L1(2)+3);
    coefficient3 = tline1(L1(2)+4:L1(3)+3);
    coefficient4 = tline1(L1(3)+4:L1(4)+3);
    coefficient5 = tline1(L1(4)+4:L1(5)+3);

    L2 = strfind(tline2,'E');         % Line 2
    coefficient6 = tline2(1:L2(1)+3);
    coefficient7 = tline2(L2(1)+4:L2(2)+3);
    coefficient8 = tline2(L2(2)+4:L2(3)+3);
    coefficient9 = tline2(L2(3)+4:L2(4)+3);
    coefficient10 = tline2(L2(4)+4:L2(5)+3);

    L3 = strfind(tline3,'E');         % Line 3
    coefficient11 = tline3(1:L3(1)+3);
    coefficient12 = tline3(L3(1)+4:L3(2)+3);
    coefficient13 = tline3(L3(2)+4:L3(3)+3);
    coefficient14 = tline3(L3(3)+4:L3(4)+3);

    % Convert string to numbers
    a1 = str2double(coefficient1);
    a2 = str2double(coefficient2);
    a3 = str2double(coefficient3);
    a4 = str2double(coefficient4);
    a5 = str2double(coefficient5);
    a6 = str2double(coefficient6);
    a7 = str2double(coefficient7);
    a8 = str2double(coefficient8);
    a9 = str2double(coefficient9);
    a10 = str2double(coefficient10);
    a11 = str2double(coefficient11);
    a12 = str2double(coefficient12);
    a13 = str2double(coefficient13);
    a14 = str2double(coefficient14);

    % Calculating Specific heat, enthalpy and entropy
    trange = linspace(ltempl,ltemph,100);
    R = 8.314;
    for j = 1:length(trange)
        if trange(j)>ltempm
            Cp(j) = (a1+a2.*trange(j)+a3.*trange(j).^2+a4.*trange(j).^3+a5.*trange(j).^4)*R;
            H(j) = (a1+(a2.*trange(j))/2+(a3.*trange(j).^2)/3+(a4.*trange(j).^3)/4+(a5.*trange(j).^4)/5+(a6./trange(j)))*R.*trange(j);
            S(j) = a1.*log(trange(j))+a2.*trange(j)+(a3.*trange(j).^2)/2+(a4.*trange(j).^3)/3+(a5.*trange(j).^4)/4+a7;
        else
            Cp(j) = (a8+a9.*trange(j)+a10.*trange(j).^2+a11.*trange(j).^3+a12.*trange(j).^4)*R;
            H(j) = (a8+(a9.*trange(j))/2+(a10.*trange(j).^2)/3+(a11.*trange(j).^3)/4+(a12.*trange(j).^4)/5+(a13./trange(j)))*R.*trange(j);
            S(j) = a8.*log(trange(j))+a9.*trange(j)+(a10.*trange(j).^2)/2+(a11.*trange(j).^3)/3+(a12.*trange(j).^4)/4+a14;
        end
    end

    % Create a folder
    cd('C:\Users\Sivadas\Desktop\Matlab\Parsing')
    mkdir(species_name)
    cd(species_name)
    %mkdir(species_name)

    % Createing plots
    % Plot for temperature and specific heat
    figure(1)
    plot(trange,Cp,'LineWidth',2,'Color','r')
    xlabel('Temperature')
    ylabel('Specific Heat')
    title('Specific Heat vs Temperature')

    % Plot for temperature and enthalpy
    figure(2)
    plot(trange,H,'LineWidth',2,'Color','b')
    xlabel('Temperature')
    ylabel('Enthalpy')
    title('Enthalpy vs Temperature')

    % Plot for temperature and entropy
    figure(3)
    plot(trange,S,'LineWidth',2,'Color','k')
    xlabel('Temperature')
    ylabel('Entropy')
    title('Entropy vs Temperature')

    % Save the plots
%     cd(species_name)
    saveas(1,'SpecificHeat.jpg')
    saveas(2,'Enthalpy.jpg')
    saveas(3,'Entropy.jpg')

%     cd ..
    cd('C:\Users\Sivadas\Desktop\Matlab')
    % Calculate molecular mass
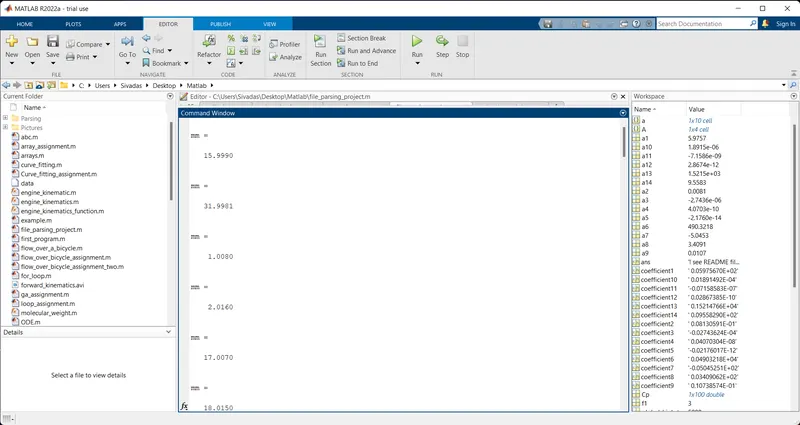
    mm = molecular_weight(species_name)

end
The function code to find the molecular weight of each species is given below:
% Molecular Weight
function [mm] = molecular_weight(species_name)
elements = ['H','C','O','N','A','S'];
atomic_wt = [1.008,12.0096,15.99903,14.00643,39.792,32.059];
mm = 0;
for i = 1:length(species_name)
    for j = 1:length(elements)
        if strcmp(species_name(i),elements(j))
            mm = mm+atomic_wt(j);
            pos=j;
        end
        n = str2num(species_name(i));
    end
    if n>1
        mm = mm+atomic_wt(pos)*(n-1);
    end

end
Explanation for Main code
1. We start the code by writing the heading of the program using '%' syntax followed by commands like clear all, close all and clc.
2. Then for reading the THERMO.dat file we use the 'fopen' command as shown below:
f1 = fopen('THERMO.dat','r')
3. Then we use the 'fgetl' command to read the first line.
Header = fgetl(f1)
4. Then we read the next line for global temperature using the 'fgetl' command and then the string is split by using the 'strsplit' command.
global_temperature = fgetl(f1);
A = strsplit(global_temperature,' ');