Project 1 - Parsing NASA thermodynamic data
Aim:
Write a function that extracts the 14 co-efficient and calculates the enthalpy, entropy and specific heats for all the species in the data file. You will be reading this file NASA thermodynamic data.
And formulate the following formulas
Specific heat(cp)
Specific heat capacity (Cp), often referred to as specific heat, is a fundamental thermophysical property of a substance. It indicates the substance's ability to store thermal energy and equals the amount of heat that must be added to one gram of the substance in order to raise its temperature by one Kelvin.
CpR=a1+a2⋅T+a3⋅T2+a4⋅T3+a5⋅T4
Enthalpy:
Enthalpy is an energy-like property or state function—it has the dimensions of energy (and is thus measured in units of joules or ergs), and its value is determined entirely by the temperature, pressure, and composition of the system and not by its history.
HRT=a1+a2⋅T2+a3⋅T23+a4⋅T34+a5⋅T45+a6⋅1T
Entropy:
entropy, the measure of a system's thermal energy per unit temperature that is unavailable for doing useful work. Because work is obtained from ordered molecular motion, the amount of entropy is also a measure of the molecular disorder, or randomness, of a system.
SR=a1⋅lnT+a2⋅T+a3⋅T22+a4⋅T33+a5⋅T44+a7
List of User Defined Functions Used
- NASA_File_Parsing.m : Main program to perform all the tasks
- species_data_collect.m : Function to extract name,local temperatures and coefficients of each species in the data file
- specific_heat_calc.m : Function to calculate Specific Heat for 500 temperature values of each element
- enthalpy_calc.m : Function to calculate Enthalpy for 500 temperature values of each element
- entropy_calc.m : Function to calculate Entropy for 500 temperature values of each element
- molecular_weight.m : Function to calculate Molecular Weight of each element
- plot_func.m : Function to plot(Cp,H,S) v/s T for each element
- element_plot_showcase.m : Function to allow user to view the plots of a particular element of user’s choice.
program for parsing the nasa thermodynamic data file
%main program to parse the thermodynamic data file
clear all
close all
clc
R=8.314 %universal gas constant in j/(mol*k)
%to open the data file
f1=fopen('thermo.dat','r');
fgetl(f1);
%extracting the global temperature data
global_temp_string=fgetl(f1);
global_temp=strsplit(global_temp_string,' ');
global_low_temp=str2double(global_temp{2});
global_mid_temp=str2double(global_temp{3});
global_high_temp=str2double(global_temp{4});
clear global_temp
clear global_temp_string
%calculate the number of species
frewind(f1)
string=fgetl(f1);
i=1;
while strcmp(string,'END')==0
string=fgetl(f1);
i=i+1;
end
clear string
total_species = (i-6)/4;
frewind(f1);
for i = 1:5 % Skipping first 5 lines
fgetl(f1);
end
clear i
% Extracting data regarding all the species data form 'THERMO.dat' file
% into the structure 'species_data'
% Extracting species name,local temperatures & coefficients
species_data = species_data_collect(f1,total_species);
% Calculation of Specific Heat for 500 temperature values
species_data = specific_heat_calc(species_data,R);
% Calculation of Enthalpy for 500 temperature values
species_data = enthalpy_calc(species_data,R);
% Calculation of Entropy for 500 temperature values
species_data = entropy_calc(species_data,R);
% Calculation of Molecular Weight for all species
species_data = molecular_weight(species_data);
% Plotting the Cp vs T, H vs T and S vs T plots for all the
% elements and saving them in seperate folders
plot_func(species_data)
% Displaying the Molecular Weights of elements
for i = 1:total_species
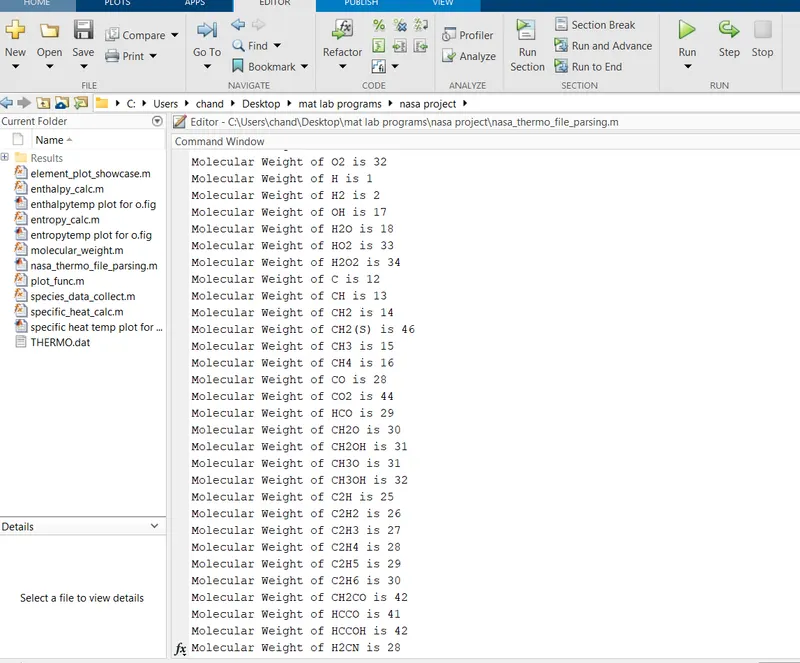
disp(['Molecular Weight of ',species_data(i).Name,' is ',num2str(species_data(i).Molec_Wt)])
end
fclose(f1);
program for enthalpy calculation:
%                     enthalpy_calc.m
% Function to calculate Enthalpy for 500 temperature values
% H = (a1 + a2*T/2 + a3*T^2/3 + a4*T^3/4 + a5*T^4/5 + a6/T)*R*T

function maindata = enthalpy_calc(maindata,R)
struct_size = length(maindata);
for i = 1:struct_size
    lmt = maindata(i).Local_Temp(3);
    T = maindata(i).Temp_Values;
    a = maindata(i).Coeff;
    for k = 1:length(T)
        % if condition: checks temperature with local mid temperature for
        % choosing the correct set of coefficients for H calculation
        if T(k)>= lmt
            % Here H will be calculated using high temperature
            % coefficients i.e a[1:7]
            H(k) = (a(1) + (a(2)*T(k))/2 + (a(3)*T(k)^2)/3 + (a(4)*T(k)^3)/4 + (a(5)*T(k)^4)/5 + a(6)/T(k))*R*T(k);
        else
            % Here H will be calculated using low temperature
            % coefficients i.e a[8:14]
            H(k) = (a(8) + (a(9)*T(k))/2 + (a(10)*T(k)^2)/3 + (a(11)*T(k)^3)/4 + (a(12)*T(k)^4)/5 + a(13)/T(k))*R*T(k);
        end
    end

    % Saving the Enthalpy Values of each species
    % in the structure 'maindata'
    maindata(i).Enthalpy_Values = H;
end
program for entropy calculation:
%                    entropy_calc.m
% Function to calculate entropy values for 500 temperature values
% S = a1*logT + a2*T + (a3*T^2)/2 + (a4*T^3)/3 + (a5*T^4)/4 + a7)*R

function maindata = entropy_calc(maindata,R)
struct_size = length(maindata);
for i = 1:struct_size
    lmt = maindata(i).Local_Temp(3);
    T = maindata(i).Temp_Values;
    a = maindata(i).Coeff;
    for k = 1:length(T)
        % if condition: checks temperature with local mid temperature for
        % choosing the correct set of coefficients for S calculation
        if T(k)>= lmt
            % Here S will be calculated using high temperature
            % coefficients i.e a[1:7]
            S(k) = (a(1)*log(T(k)) + a(2)*T(k) + (a(3)*T(k)^2)/2 + (a(4)*T(k)^3)/3 + (a(5)*T(k)^4)/4 + a(7))*R;
        else
            % Here S will be calculated using low temperature
            % coefficients i.e a[8:14]
            S(k) = (a(8)*log(T(k)) + a(9)*T(k) + (a(10)*T(k)^2)/2 + (a(11)*T(k)^3)/3 + (a(12)*T(k)^4)/4 + a(14))*R;
        end
    end
    % Saving the Entropy Values of each species
    % in the structure 'maindata'
    maindata(i).Entropy_Values = S;
end
end
program for molecular weight
% molecular_weight.m
% Function to calculate Molecular Weight
function maindata = molecular_weight(maindata)
% Creating character vector of all letters appearing in the element name
std_element = {'C','H','O','N','A','S'};
% Creating atomic weight vector corresponding to the letters
atomic_wt = [12,1,16,14,40,32];
struct_size = length(maindata);
for i = 1:struct_size
name = maindata(i).Name;
mol_wt = 0;
for j = 1:length(name)
for k = 1:length(std_element)
% Comparing the element name with vector-std_element
if strcmp(name(j),std_element(k))==1
mol_wt = mol_wt + atomic_wt(k);
pos = k;
break
end
end
% Converting the number(but actually a string) in element name into number
num = str2double(name(j));
if num>1
mol_wt = mol_wt + (atomic_wt(pos).*(num-1));
end
end
% Saving the Melocular Weight Values of each species
% in the structure 'maindata'
maindata(i).Molec_Wt = mol_wt;
end
endprogram for specific data collecton:
%                  species_data_collect.m
% This function extracts the species name,local temperatures and
% coefficients form the data file

function maindata = species_data_collect(f1,species_count)
% This function returns the species name,local temperatures and
% coefficients as the structure 'maindata'
for i = 1:species_count
    string = fgetl(f1);
    name = strtok(string);  % extracts the first token in 'string'
    temp_pos = strfind(string,'.'); % finding position of '.' in 'string'

    % Extracting the local temperatures
    local_low_temp = str2double(string(temp_pos(1)-3:temp_pos(1)+3));
    local_high_temp = str2double(string(temp_pos(2)-4:temp_pos(2)+3));
    local_mid_temp = str2double(string(temp_pos(3)-4:temp_pos(3)+3));

    % Saving the species name & local temperatures into the structure
    % 'maindata'
    maindata(i).Name = name;
    maindata(i).Local_Temp = [local_low_temp,local_high_temp,local_mid_temp];

    % Extracting coefficients from first line
    line1 = fgetl(f1);
    E_pos1 = strfind(line1,'E');
    a1 = str2double(line1(1:E_pos1(1)+3));
    a2 = str2double(line1(E_pos1(1)+4:E_pos1(2)+3));
    a3 = str2double(line1(E_pos1(2)+4:E_pos1(3)+3));
    a4 = str2double(line1(E_pos1(3)+4:E_pos1(4)+3));
    a5 = str2double(line1(E_pos1(4)+4:E_pos1(5)+3));

    % Extracting coefficients from second line
    line2 = fgetl(f1);
    E_pos2 = strfind(line2,'E');
    a6 = str2double(line2(1:E_pos2(1)+3));
    a7 = str2double(line2(E_pos2(1)+4:E_pos2(2)+3));
    b1 = str2double(line2(E_pos2(2)+4:E_pos2(3)+3));
    b2 = str2double(line2(E_pos2(3)+4:E_pos2(4)+3));
    b3 = str2double(line2(E_pos2(4)+4:E_pos2(5)+3));

    % Extracting coefficients from third line
    line3 = fgetl(f1);
    E_pos3 = strfind(line3,'E');
    b4 = str2double(line3(1:E_pos3(1)+3));
    b5 = str2double(line3(E_pos3(1)+4:E_pos3(2)+3));
    b6 = str2double(line3(E_pos3(2)+4:E_pos3(3)+3));
    b7 = str2double(line3(E_pos3(3)+4:E_pos3(4)+3));

    % Saving the coefficients in the structure 'maindata'
    maindata(i).Coeff = [a1 a2 a3 a4 a5 a6 a7 b1 b2 b3 b4 b5 b6 b7];

end
program for specific heat calculation:
%                specific_heat_calc.m
% Function to calculate Specific Heat for 500 temperature values
% Cp = (a1 + a2*T + a3*T^2 + a4*T^3 + a5*T^4)*R

function maindata = specific_heat_calc(maindata,R)
struct_size = length(maindata);
for i = 1:struct_size
    llt = maindata(i).Local_Temp(1);
    lht = maindata(i).Local_Temp(2);
    lmt = maindata(i).Local_Temp(3);
    T = linspace(llt,lht,500);
    a = maindata(i).Coeff;
    for k = 1:length(T)
        % if condition: checks temperature with local mid temperature for
        % choosing the correct set of coefficients for Cp calculation
        if T(k)>= lmt
            % Here Cp will be calculated using high temperature
            % coefficients i.e a[1:7]
            Cp(k) = (a(1) + a(2)*T(k) + a(3)*T(k)^2 + a(4)*T(k)^3 + a(5)*T(k)^4)*R;
        else
            % Here Cp will be calculated using low temperature
            % coefficients i.e a[8:14]
            Cp(k) = (a(8) + a(9)*T(k) + a(10)*T(k)^2 + a(11)*T(k)^3 + a(12)*T(k)^4)*R;
        end
    end

    % Saving the Temperature values & Specific Heat Values of each species
    % in the structure 'maindata'
    maindata(i).Temp_Values = T;
    maindata(i).Sp_Heat_Values = Cp;
end
end
program for plot function:
%                plot_func.m
% This function plots the Cp vs T , H vs T and S vs T graphs for all
% elements in the input argument 'maindata' structure and svaes them
% in seperate folders

function [] = plot_func(maindata)

struct_size = length(maindata);
for i = 1:struct_size
    name = maindata(i).Name;
    mkdir('Results',name);  % creates a new folder in the current directory

    % Plotting Specific Heat v/s Temperature Plot
    figure(1)
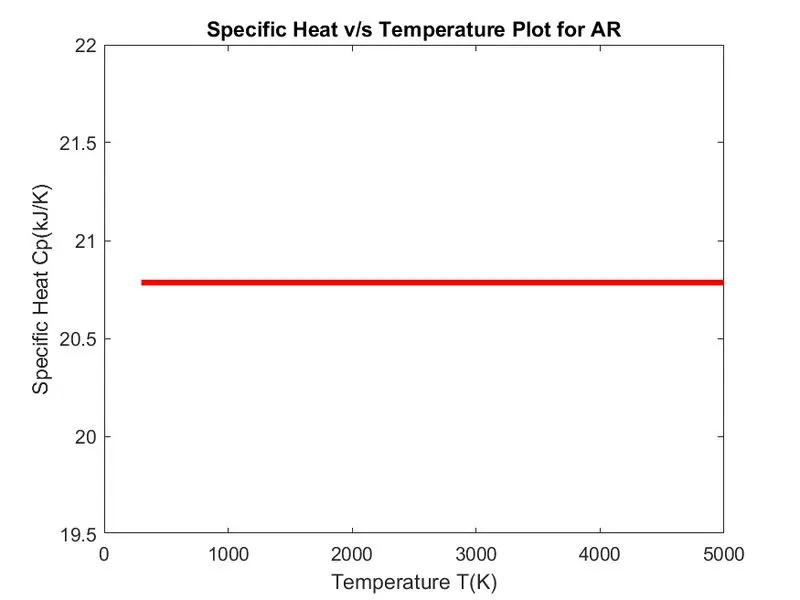
    plot(maindata(i).Temp_Values,maindata(i).Sp_Heat_Values,'color','r','linewidth',3)
    xlabel('Temperature T(K)')
    ylabel('Specific Heat Cp(kJ/K)')
    title(sprintf('Specific Heat v/s Temperature Plot for %s',name))

    % Plotting Enthalpy v/s Temperature Plot
    figure(2)
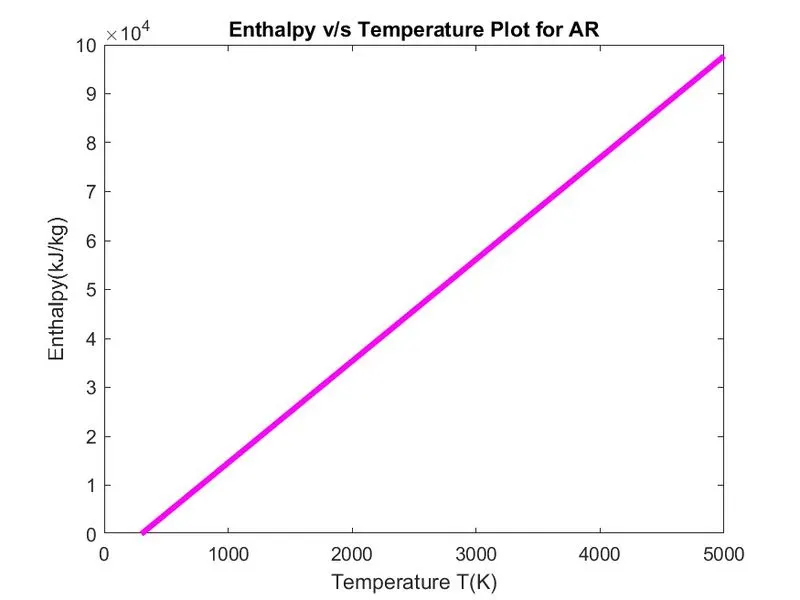
    plot(maindata(i).Temp_Values,maindata(i).Enthalpy_Values,'color','m','linewidth',3)
    xlabel('Temperature T(K)')
    ylabel('Enthalpy(kJ/kg)')
    title(sprintf('Enthalpy v/s Temperature Plot for %s',name))

    % Plotting Entropy v/s Temperature Plot
    figure(3)
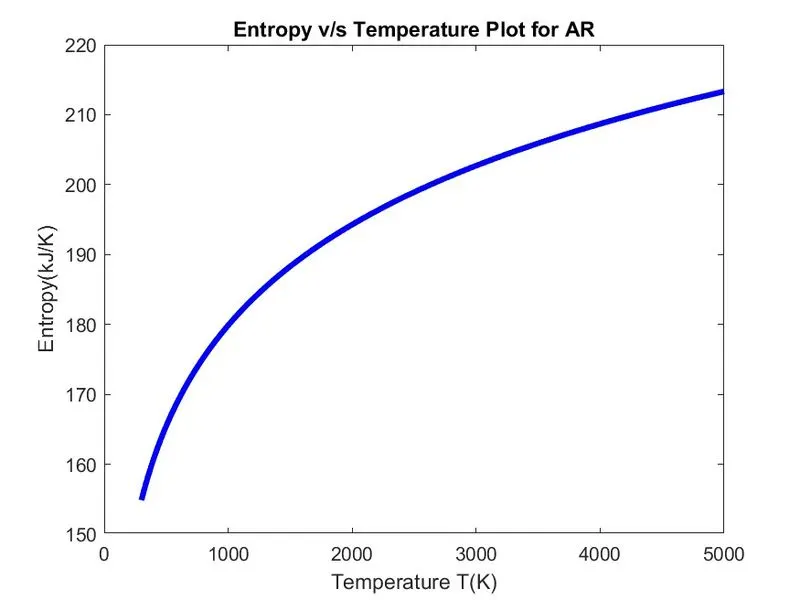
    plot(maindata(i).Temp_Values,maindata(i).Entropy_Values,'color','b','linewidth',3)
    xlabel('Temperature T(K)')
    ylabel('Entropy(kJ/K)')
    title(sprintf('Entropy v/s Temperature Plot for %s',name))

    path = 'C:\Users\chand\Desktop\mat lab programs\nasa project\Results';

    plot_1 = fullfile(path,name,'Specific_Heat_vs_Temperature_Plot.jpg');
    plot_2 = fullfile(path,name,'Enthalpy_vs_Temperature_Plot.jpg');
    plot_3 = fullfile(path,name,'Entropy_vs_Temperature_Plot.jpg');

      saveas(figure(1),plot_1)
    saveas(figure(2),plot_2)
    saveas(figure(3),plot_3)
end
end
program for element plot show:
%                           element_plot_showcase.m
% This function displays the Specific Heat,Enthalpy and Entropy plots of a
% specific element as per user input

function [] = element_plot_showcase(maindata)

% Asking User Response
choice = questdlg('Do you want to view H-T, S-T, C-T plot of any element?','User Response','Yes','No','No');
ctrl = 0;
while ctrl == 0
    switch choice
        case 'Yes'
            h = msgbox({'The elements present in the databse are as follows:'...
                    'O, O2, H, H2, OH, H2O, HO2, H2O2, C, CH, CH2, CH2(S)'...
                    'CH3, CH4, CO, CO2, HCO, CH2O, CH2OH, H3O, CH3OH, C2H'...
                    'C2H2, C2H3, C2H4, C2H5, C2H6, CH2CO, HCCO, HCCOH, H2CN'...
                    'HCN, HNO, N, NNH, N2O, NH, NH2, NH3, NO, NO2, HCNO, HOCN'...
                    'HNCO, NCO, CN, HCNN, N2, AR, C3H8, C3H7, CH3CHO, CH2CHO'});
                    user = inputdlg('Enter the element name: ');
                    delete(h);
                    pos = 0;
                    for n = 1:length(maindata)
                        temp_name = maindata(n).Name;
                        if strcmpi(temp_name,user)==1
                            pos = n;
                            break
                        end
                    end

                    if pos ~= 0
                        path = 'C:\Users\chand\Desktop\mat lab programs\nasa project\Results';
                        filename1 = fullfile(path,temp_name,'Enthalpy_vs_Temperature_Plot.jpg');
                        image1 = imread(filename1);
                        figure(1)
                        imshow(image1);

                        filename2 = fullfile(path,temp_name,'Entropy_vs_Temperature_Plot.jpg');
                        image2 = imread(filename2);
                        figure(2)
                        imshow(image2);

                        filename3 = fullfile(path,temp_name,'Specific_Heat_vs_Temperature_Plot.jpg');
                        image3 = imread(filename3);
                        figure(3)
                        imshow(image3);

                        choice = questdlg('Do you want to view H-T, S-T, C-T plot of any other element?','User Response','Yes','No','No');
                    else
                        uiwait(msgbox('Please enter a valid element name...!'))
                    end
        case 'No'
            ctrl = 1;
    end
end
end
screen shot for molicular weight of each specied:
screen shot for molicular data collecton folder:

images of each plot:
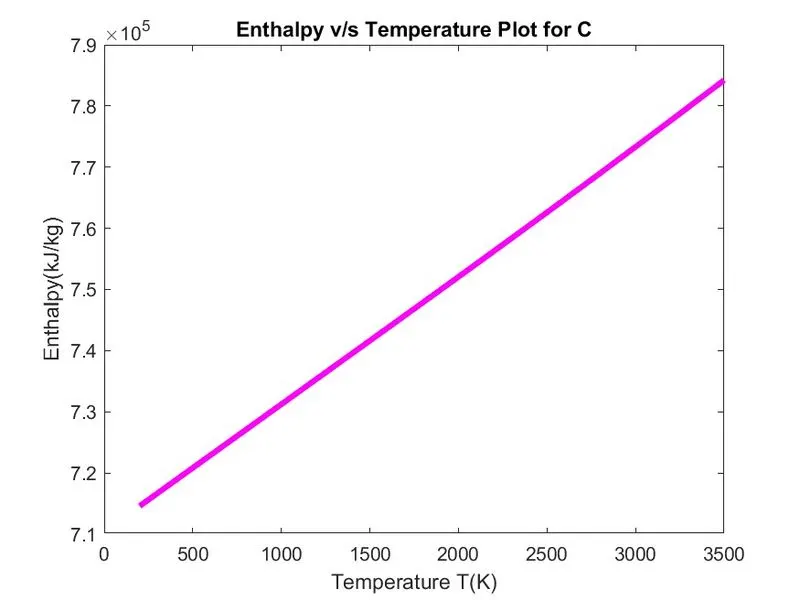
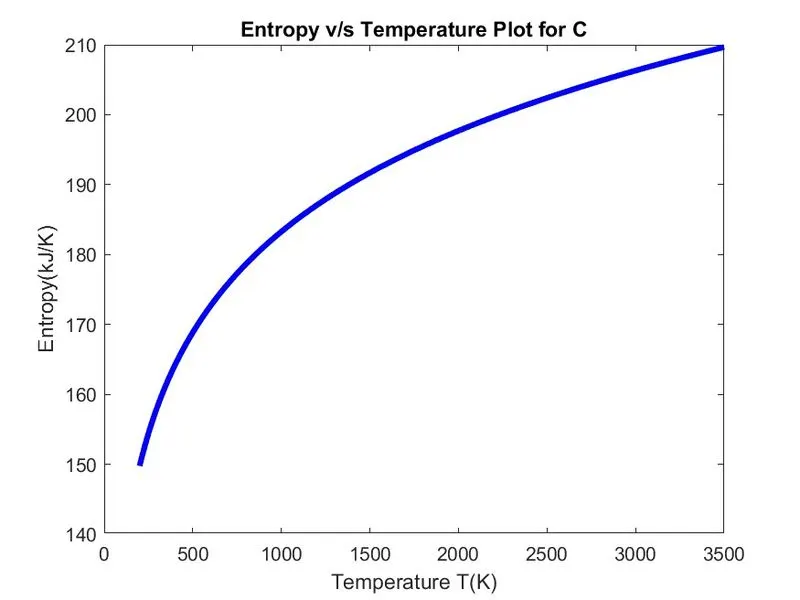
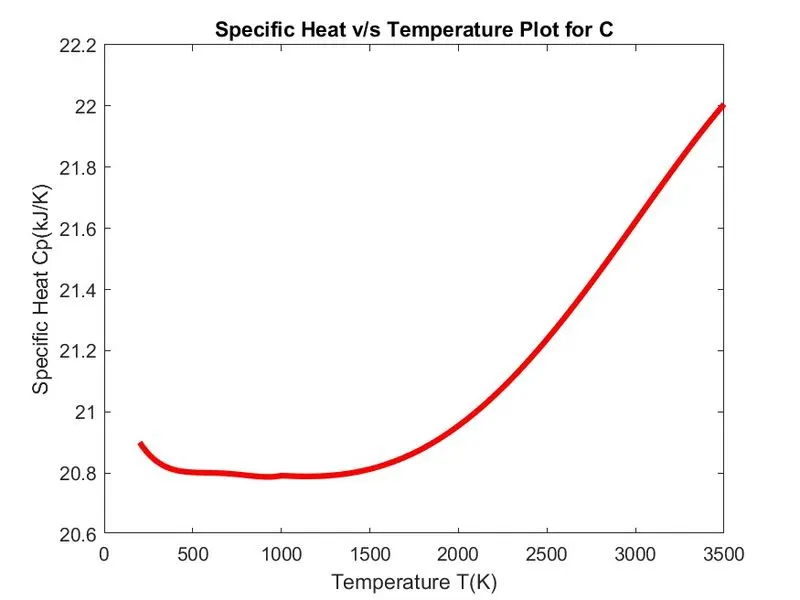
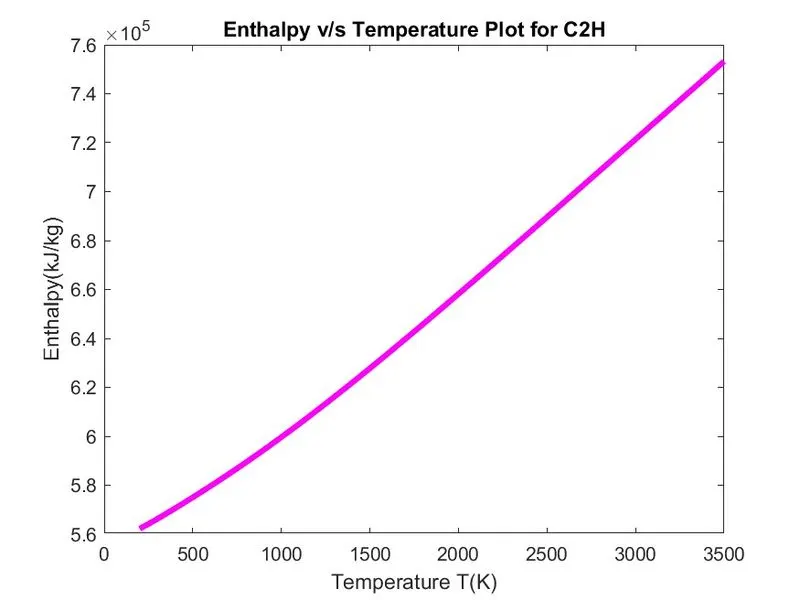
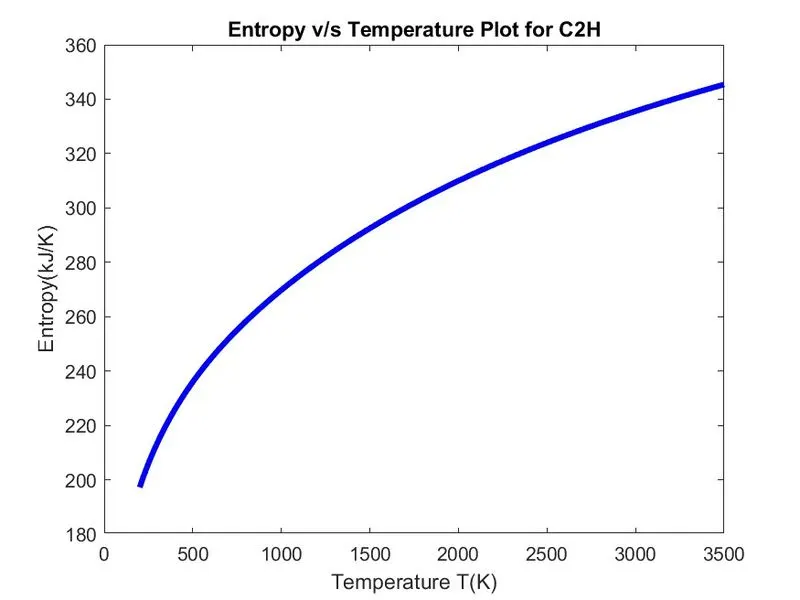
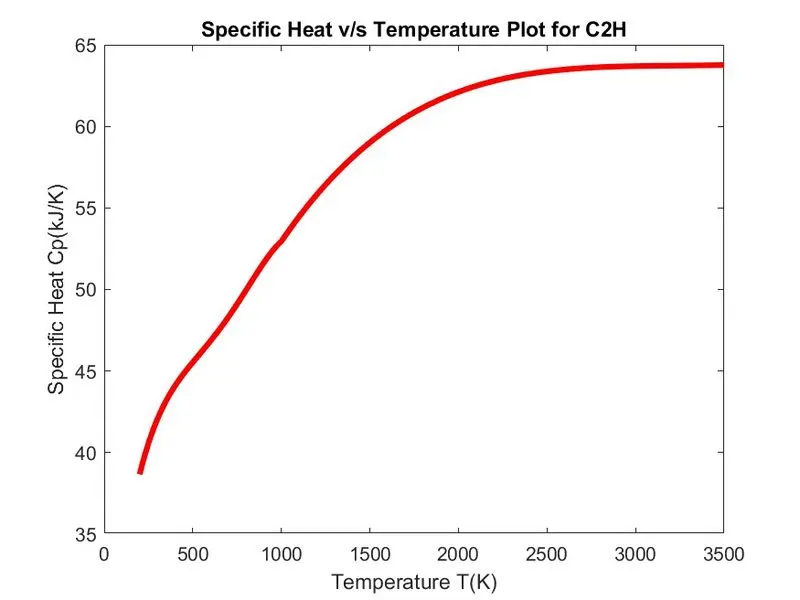
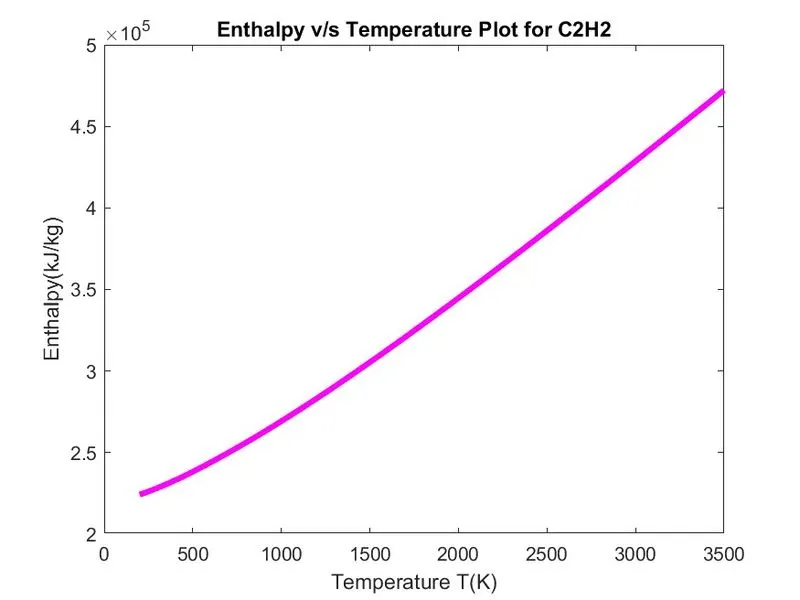
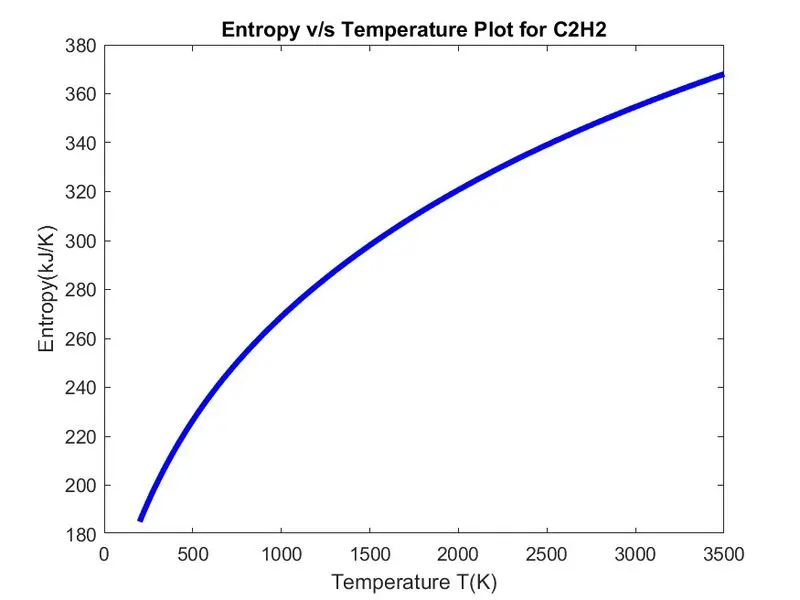
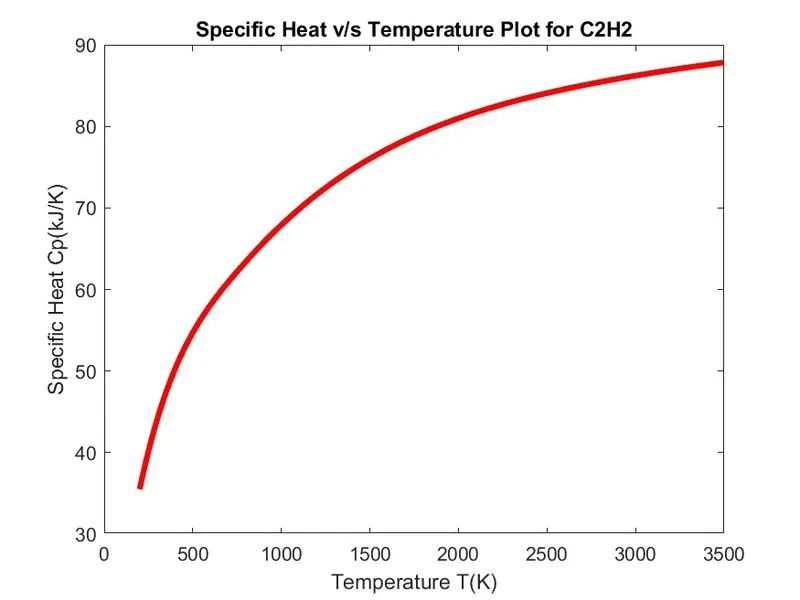
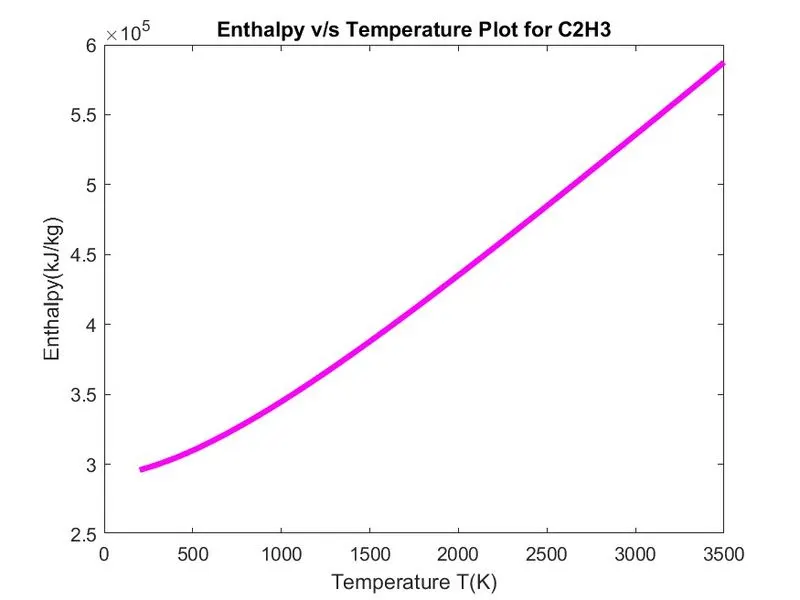
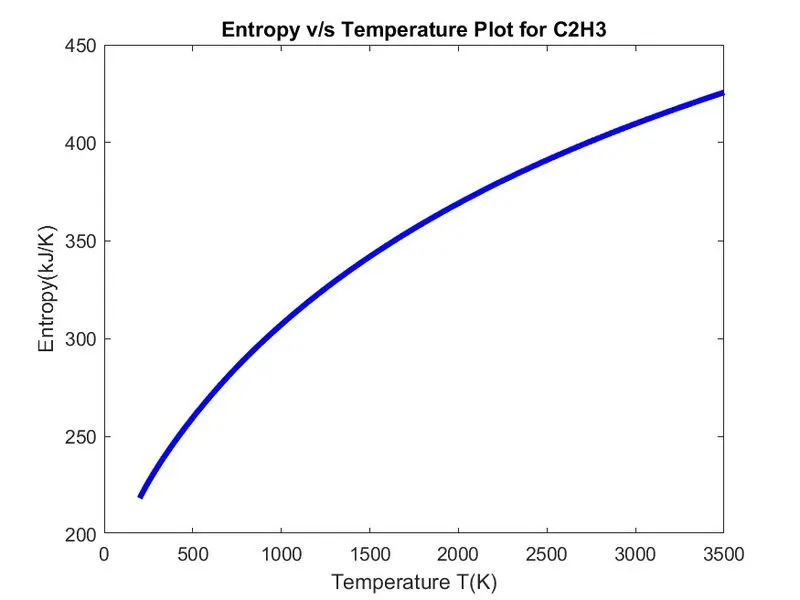
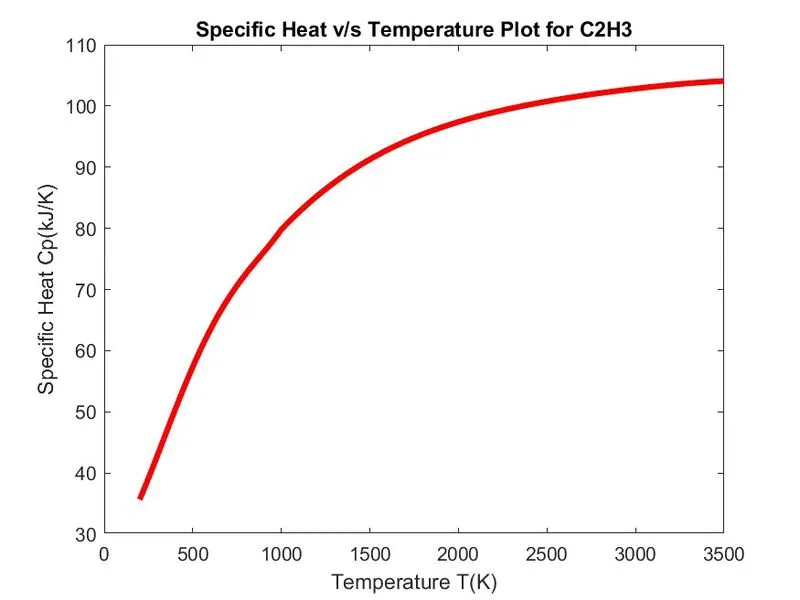
Conclusion
The file parsing project includes several modules from finding correct information, converting them to useful form, plotting the relations and saving them automatically at the correct location. All these tasks led to great learning of various functions related to file handling in MATLAB and cleared confusions between some functions too. This project helps to enhance the thought process and logical thinking also. Overall, it was interesting and a bit challenging project to complete.
references:
all thanks to all my teachers from skill lync to teach about and special thanks to Jophil Joseph he already done the project and great referenace to complete understand the project because a long study gap is difficult to understand the equations and excicute it.