Project 1 - Parsing NASA thermodynamic data
File Parsing in MATLAB
Objective :
- Write a MATLAB program to read given Thermo data file line by line.
- And store the required temperature values, species, individually.
- And calculate the species co-effcient by using functions and determine enthalpy, entropy, specific heat.
- To calculate the molecular weight of each species and write it in txt file
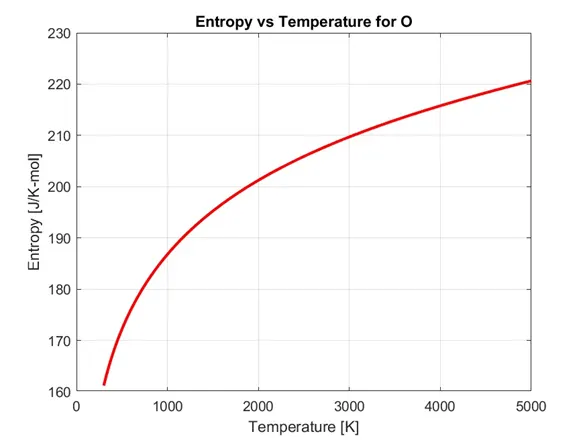
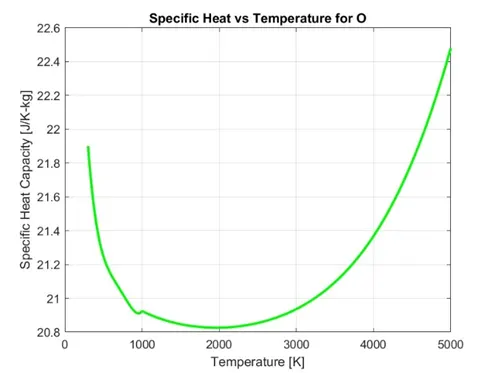
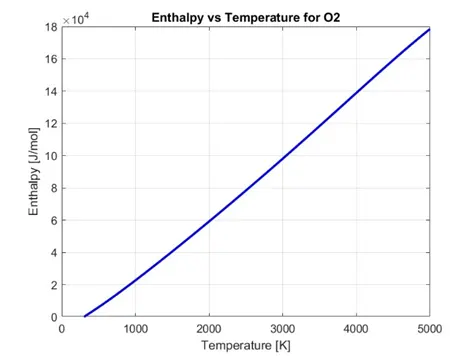
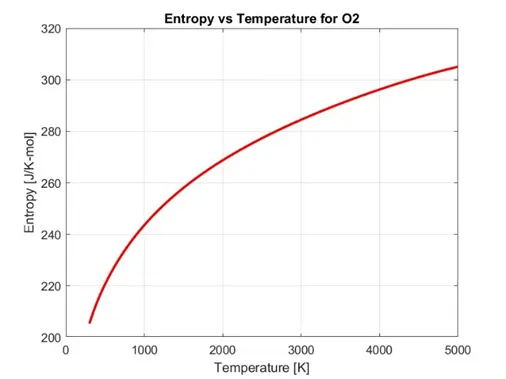
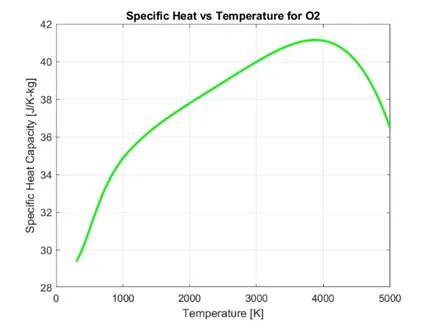
- Make plots for enthalpy, entropy, specific heat.
Input data:
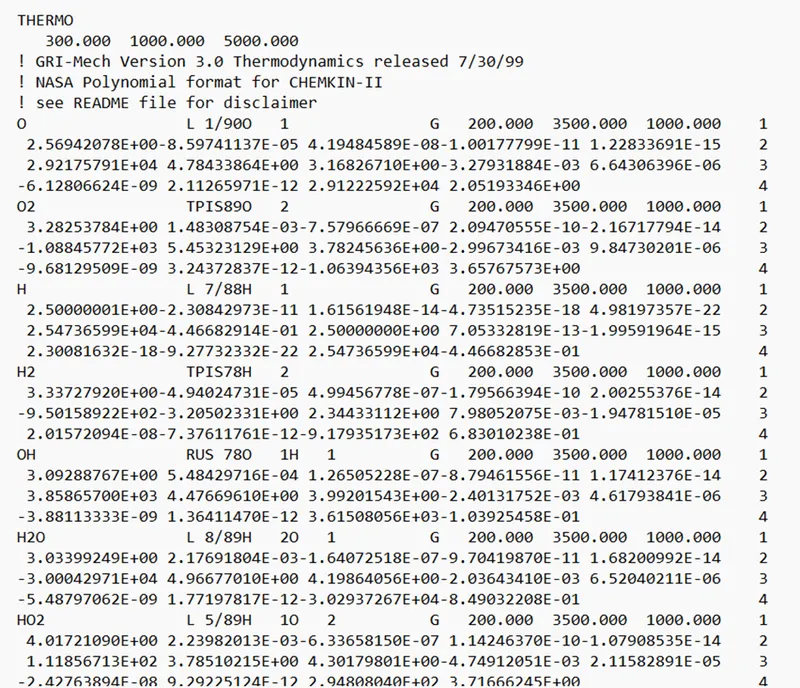
NASA thermodynamic properties data file with temperature and co-efficient s for each species.
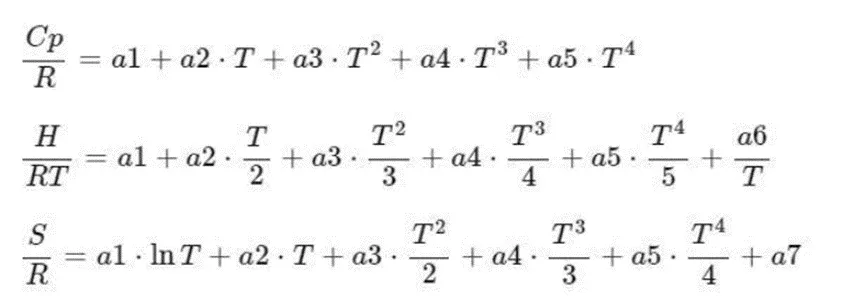
Below are the polynomial equations for calculating the Specific heat (Cp) ,Enthalpy (H) , Entropy (S).
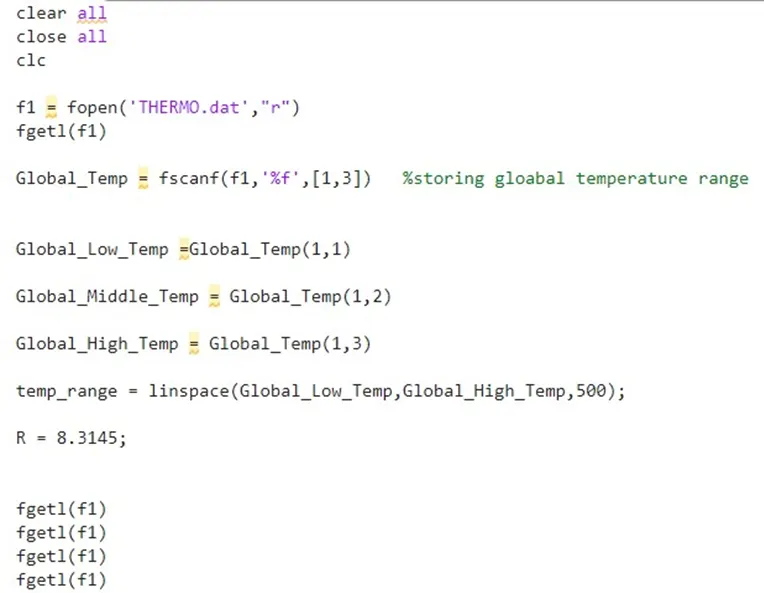
Main Code for Evaluate the Specific heat (Cp) ,Enthalpy (H) , Entropy (S) :
- Read the thermos.dat file line by line
- Store the temperature and species individually as array.
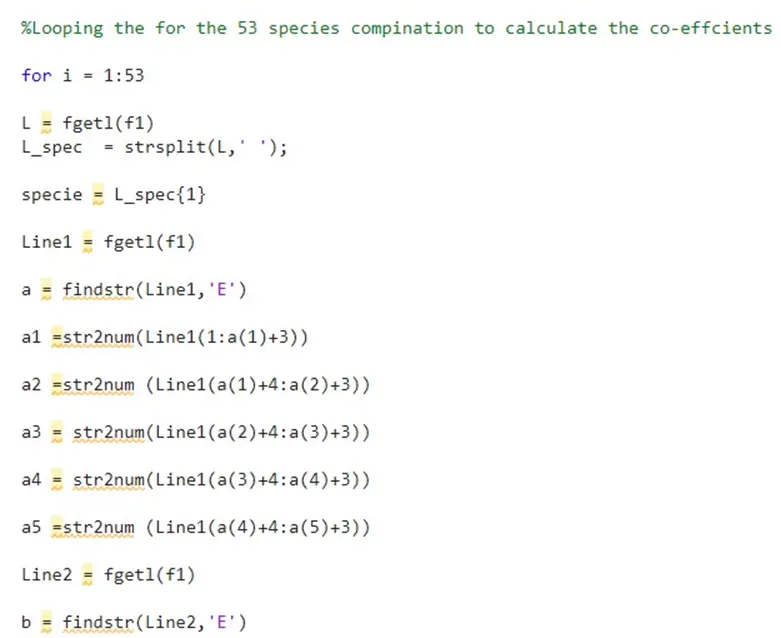
Loop for the total 53 species
Function for Enthalpy
function [h] = enthalpy(a1,a2,a3,a4,a5,a6,a8,a9,a10,a11,a12,a13,temp_range,Global_Middle_Temp,R)
%if the temperature is less than global mid temp then coefficients from a8 to a14 are used
%if the temperature is more than global mid temp then coefficients from a1 to a7 are used
for i = 1:length(temp_range)
if temp_range(i) <= Global_Middle_Temp
h(i) = (temp_range(i)*R.*(a8 + ((a9.*temp_range(i))./2) + ((a10.*temp_range(i).^2)./3) + ((a11.*temp_range(i).^3)./4) + ((a12.*temp_range(i).^4)./5) + (a13./temp_range(i))));
else
h(i) = (temp_range(i)*R.*(a1 + ((a2.*temp_range(i))./2) + ((a3.*temp_range(i).^2)./3) + ((a4.*temp_range(i).^3)./4) + ((a5.*temp_range(i).^4)./5) + (a6./temp_range(i))));
end
end
end
Function for Specific heat
function [cp] = specific_heat(a1,a2,a3,a4,a5,a8,a9,a10,a11,a12,temp_range,Global_Middle_Temp,R)
%if the temperature is less than global mid temp then coefficients from a8 to a14 are used
%if the temperature is more than global mid temp then coefficients from a1 to a7 are used
for i = 1:length(temp_range)
if temp_range(i) <= Global_Middle_Temp
cp(i) = R.*(a8 + a9.*temp_range(i) + a10.*temp_range(i).^2 + a11.*temp_range(i).^3 + a12.*temp_range(i).^4);
else
cp(i) = R.*(a1 + a2.*temp_range(i) + a3.*temp_range(i).^2 + a4.*temp_range(i).^3 + a5.*temp_range(i).^4);
end
end
Function for Entropy
function [s] = entropy(a1,a2,a3,a4,a5,a7,a8,a9,a10,a11,a12,a14,temp_range,Global_Middle_Temp,R)
%if the temperature is less than global mid temp then coefficients from a8 to a14 are used
%if the temperature is more than global mid temp then coefficients from a1 to a7 are used
for i = 1:length(temp_range) %marching over the local temperature array
if temp_range(i) <= Global_Middle_Temp
s(i) = R.*((a8*log(temp_range(i))) + a9.*temp_range(i) + ((a10.*temp_range(i).^2)./2) + ((a11.*temp_range(i).^3)./3) + ((a12.*temp_range(i).^4)./4) + a14);
else
s(i) = R.*((a1*log(temp_range(i))) + a2.*temp_range(i) + ((a3.*temp_range(i).^2)./2) + ((a4.*temp_range(i).^3)./3) + ((a5.*temp_range(i).^4)./4) + a7);
end
end
end
Program for calculating molecular weight .
Calculate the each specie molecular weight and write it in text file .
clear all
close all
clc
f1 = fopen('THERMO.dat',"r")
fgetl(f1)
molecular_weight = fopen('molecular_weight.txt','wt');
for i =1:53
L = fgetl(f1)
L_spec = strsplit(L,' ');
specie = L_spec{1}
% Molecular Weight Evaluation
Element = ['H','C','N','O','S','A'];
mass = [1 12 14 16 32 40];
for i = 1:length(specie)
for j = 1:length(Element)
if strcmp ((specie),Element(j)) % cpmpare the specie the and elemnets tocheck element is available in arrray
Mol_Weight = mass(j); % if available add mass
pos = j;
end
end
n = str2num(specie(i)); % to chec the element if repeating
if n > 1
Mol_Weight = mass(pos)*(n-1);
fprintf(molecular_weight,'Molecular Weight of %s is : %.2f n',specie,Mol_Weight);
end
end
fgetl(f1)
fgetl(f1)
fgetl(f1
end
Results & plots:
Plots for O:
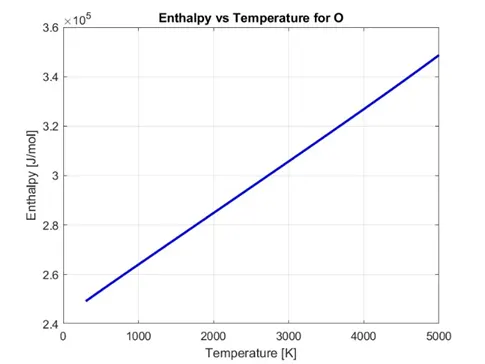
Plots for O2:
Summary
- Code written to calculate the enthalpy , entropy, specific heat values.
- Plots were made and saved in individual folder for each species specifically.
- Molecular weight for each species were calculated and write as text file.
All the results plots and codes and output files acan be found in following drive link
https://drive.google.com/drive/folders/16t_nmMcvEeQc5tI3fd_fjsrRVsanWFMS?usp=sharing
clear all
close all
clc

f1 = fopen('THERMO.dat',"r")
fgetl(f1)

Global_Temp = fscanf(f1,'%f',[1,3])   %storing gloabal temperature range


Global_Low_Temp =Global_Temp(1,1)

Global_Middle_Temp = Global_Temp(1,2)

Global_High_Temp = Global_Temp(1,3)

temp_range = linspace(Global_Low_Temp,Global_High_Temp,500);

R = 8.3145;


fgetl(f1)
fgetl(f1)
fgetl(f1)
fgetl(f1)

%Looping the for the 53 species compination to calculate the co-effcients

for i = 1:53

L = fgetl(f1)
L_spec  = strsplit(L,' ');

specie = L_spec{1}

Line1 = fgetl(f1)

a = findstr(Line1,'E')

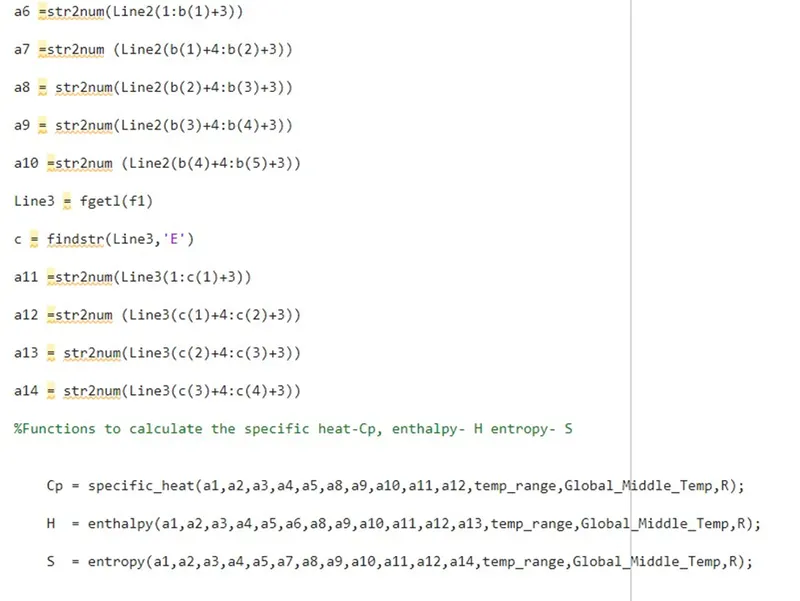
a1 =str2num(Line1(1:a(1)+3))

a2 =str2num (Line1(a(1)+4:a(2)+3))

a3 = str2num(Line1(a(2)+4:a(3)+3))

a4 = str2num(Line1(a(3)+4:a(4)+3))

a5 =str2num (Line1(a(4)+4:a(5)+3))

Line2 = fgetl(f1)

b = findstr(Line2,'E')

a6 =str2num(Line2(1:b(1)+3))

a7 =str2num (Line2(b(1)+4:b(2)+3))

a8 = str2num(Line2(b(2)+4:b(3)+3))

a9 = str2num(Line2(b(3)+4:b(4)+3))

a10 =str2num (Line2(b(4)+4:b(5)+3))

Line3 = fgetl(f1)

c = findstr(Line3,'E')

a11 =str2num(Line3(1:c(1)+3))

a12 =str2num (Line3(c(1)+4:c(2)+3))

a13 = str2num(Line3(c(2)+4:c(3)+3))

a14 = str2num(Line3(c(3)+4:c(4)+3))

%Functions to calculate the specific heat-Cp, enthalpy- H entropy- S


    Cp = specific_heat(a1,a2,a3,a4,a5,a8,a9,a10,a11,a12,temp_range,Global_Middle_Temp,R);

    H  = enthalpy(a1,a2,a3,a4,a5,a6,a8,a9,a10,a11,a12,a13,temp_range,Global_Middle_Temp,R);

    S  = entropy(a1,a2,a3,a4,a5,a7,a8,a9,a10,a11,a12,a14,temp_range,Global_Middle_Temp,R);

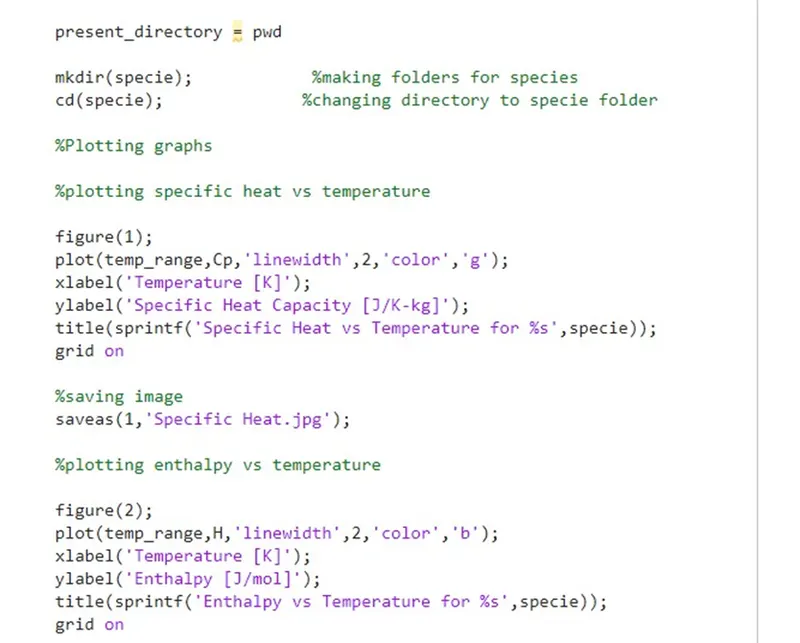
    present_directory = pwd

    mkdir(specie);            %making folders for species
    cd(specie);              %changing directory to specie folder

    %Plotting graphs

    %plotting specific heat vs temperature

    figure(1);
    plot(temp_range,Cp,'linewidth',2,'color','g');
    xlabel('Temperature [K]');
    ylabel('Specific Heat Capacity [J/K-kg]');
    title(sprintf('Specific Heat vs Temperature for %s',specie));
    grid on

    %saving image
    saveas(1,'Specific Heat.jpg');

    %plotting enthalpy vs temperature

    figure(2);
    plot(temp_range,H,'linewidth',2,'color','b');
    xlabel('Temperature [K]');
    ylabel('Enthalpy [J/mol]');
    title(sprintf('Enthalpy vs Temperature for %s',specie));
    grid on

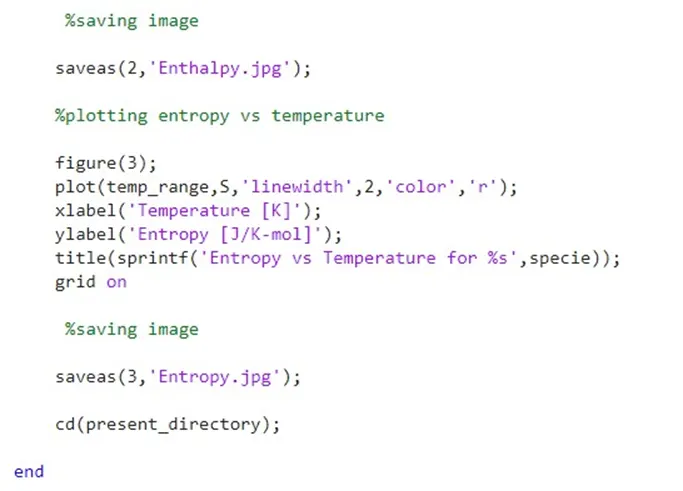
     %saving image

    saveas(2,'Enthalpy.jpg');

    %plotting entropy vs temperature

    figure(3);
    plot(temp_range,S,'linewidth',2,'color','r');
    xlabel('Temperature [K]');
    ylabel('Entropy [J/K-mol]');
    title(sprintf('Entropy vs Temperature for %s',specie));
    grid on

     %saving image

    saveas(3,'Entropy.jpg');

    cd(present_directory);

end

%function for enthalpy


function [h] = enthalpy(a1,a2,a3,a4,a5,a6,a8,a9,a10,a11,a12,a13,temp_range,Global_Middle_Temp,R)


%if the temperature is less than global mid temp then coefficients from a8 to a14 are used
%if the temperature is more than global mid temp then coefficients from a1 to a7 are used


    for i = 1:length(temp_range)
        if temp_range(i) <= Global_Middle_Temp
            h(i) = (temp_range(i)*R.*(a8 + ((a9.*temp_range(i))./2) + ((a10.*temp_range(i).^2)./3)  + ((a11.*temp_range(i).^3)./4) + ((a12.*temp_range(i).^4)./5) + (a13./temp_range(i))));
        else
            h(i) = (temp_range(i)*R.*(a1 + ((a2.*temp_range(i))./2) + ((a3.*temp_range(i).^2)./3)  + ((a4.*temp_range(i).^3)./4) + ((a5.*temp_range(i).^4)./5) + (a6./temp_range(i))));
        end
    end
end

%Function for entropy

function [s] = entropy(a1,a2,a3,a4,a5,a7,a8,a9,a10,a11,a12,a14,temp_range,Global_Middle_Temp,R)

%if the temperature is less than global mid temp then coefficients from a8 to a14 are used
%if the temperature is more than global mid temp then coefficients from a1 to a7 are used

    for i = 1:length(temp_range)                %marching over the local temperature array
        if temp_range(i) <= Global_Middle_Temp
           s(i) = R.*((a8*log(temp_range(i))) + a9.*temp_range(i) + ((a10.*temp_range(i).^2)./2)  + ((a11.*temp_range(i).^3)./3) + ((a12.*temp_range(i).^4)./4) + a14);
        else
            s(i) = R.*((a1*log(temp_range(i))) + a2.*temp_range(i) + ((a3.*temp_range(i).^2)./2)  + ((a4.*temp_range(i).^3)./3) + ((a5.*temp_range(i).^4)./4) + a7);
        end
    end
end

%Function for Specific Heat


function [cp] = specific_heat(a1,a2,a3,a4,a5,a8,a9,a10,a11,a12,temp_range,Global_Middle_Temp,R)

%if the temperature is less than global mid temp then coefficients from a8 to a14 are used
%if the temperature is more than global mid temp then coefficients from a1 to a7 are used

    for i = 1:length(temp_range)
        if temp_range(i) <= Global_Middle_Temp
           cp(i) = R.*(a8 + a9.*temp_range(i) + a10.*temp_range(i).^2  + a11.*temp_range(i).^3 + a12.*temp_range(i).^4);
        else
            cp(i) = R.*(a1 + a2.*temp_range(i) + a3.*temp_range(i).^2  + a4.*temp_range(i).^3 + a5.*temp_range(i).^4);
        end
    end
end


% for calculating molcular weight


clear all
close all
clc

f1 = fopen('THERMO.dat',"r")
fgetl(f1)

molecular_weight = fopen('molecular_weight.txt','wt');

for i =1:53

 L = fgetl(f1)
L_spec  = strsplit(L,' ');

specie = L_spec{1}

     % Molecular Weight Evaluation
   Element = ['H','C','N','O','S','A'];
   mass  = [1 12 14 16 32 40];

    for i = 1:length(specie)
        for j = 1:length(Element)
            if strcmp ((specie),Element(j)) % cpmpare the specie the and elemnets tocheck element is available in arrray

                Mol_Weight = mass(j); % if available add mass
                pos = j;
            end
        end
        n = str2num(specie(i)); % to chec the element if repeating

            if n > 1
                Mol_Weight = mass(pos)*(n-1);

                fprintf(molecular_weight,'Molecular Weight of %s is : %.2f n',specie,Mol_Weight);

            end
    end

fgetl(f1)
fgetl(f1)
fgetl(f1)

end