Project 1 - Parsing NASA thermodynamic data
AIM:
- To write a code to extract the data i.e.,coefficients from NASA Thermodynamic file and use the coefficients to calculate Specific heat,Enthaly and Entrophy for each species in the given file.
- To write a function code for the given functions to calculate Specific heat,Enthaly and Entrophy for each species in the given file.
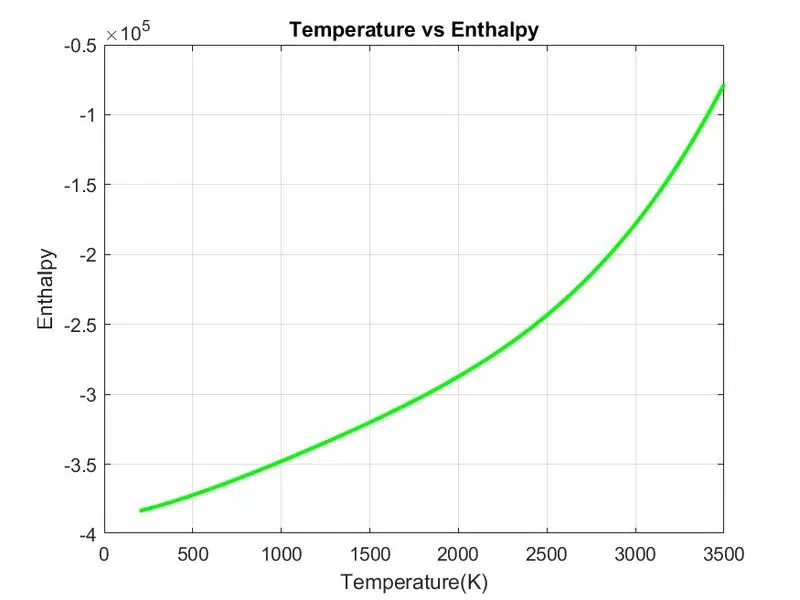
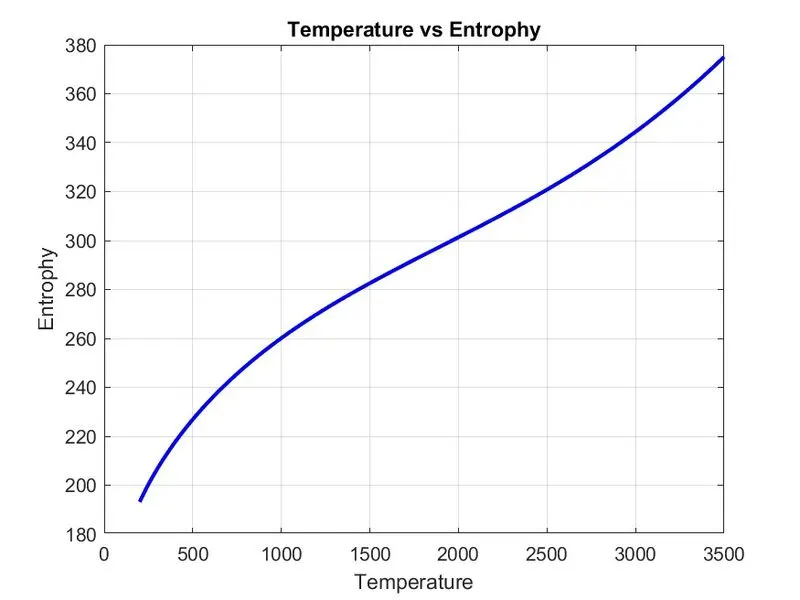
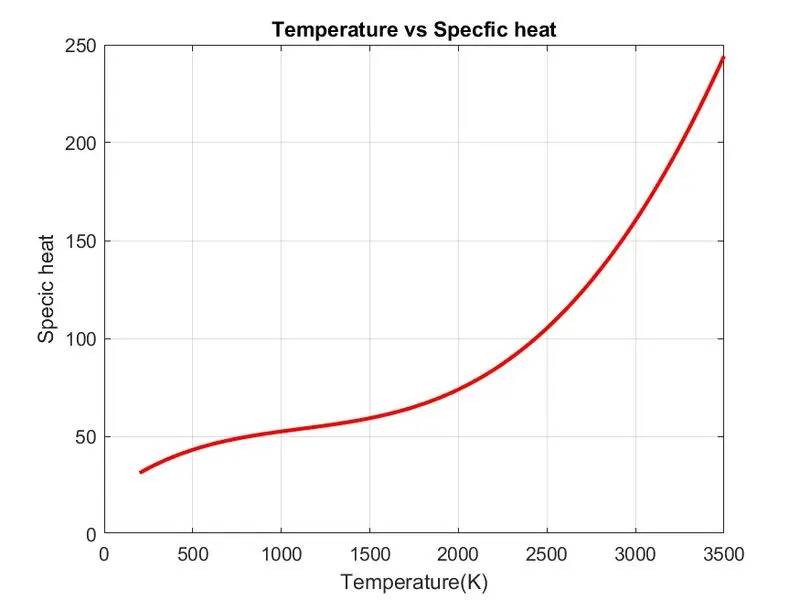
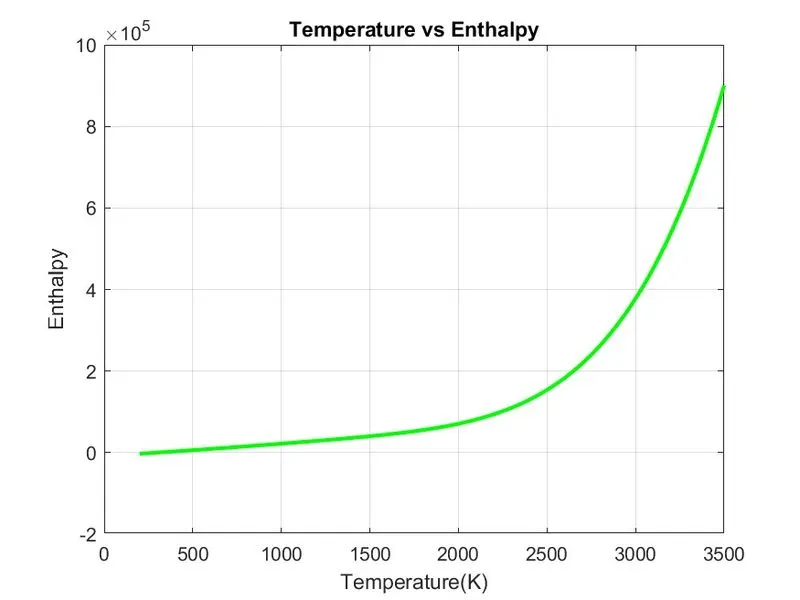
- To plot the calculated data i.e., Specific heat,Enthalpy & Entrophy of the species.
- To save the plots of all species in separate folder.
General Procedure:
- Open the script file and write the code in MATLAB
- Save the file and save the function file correct function name and save it in the same folder.
EXPLANATION:
SPECIFIC HEAT:
In thermodynamics, the specific heat capacity (symbol cp) of a substance is the heat capacity of a sample of the substance divided by the mass of the sample. Informally, it is the amount of heat that must be added to one unit of mass of the substance in order to cause an increase of one unit in temperature. The SI unit of specific heat capacity is joule per kelvin per kilogram, J⋅kg−1⋅K−1
Cp = Q / (ΔT ⨉ m)
Cp=Specific Heat capacity
Q=Heat Energy
ΔT=Change in temperature
m=mass
ENTHALPY:
Enthalpy is the measurement of energy in a thermodynamic system. The quantity of enthalpy equals to the total content of heat of a system, equivalent to the system's internal energy plus the product of volume and pressure.
H = U + pV
U = Internal energy
p =Pressure
V =Volume of the system
ENTROPHY:
Entropy, the measure of a system's thermal energy per unit temperature that is unavailable for doing useful work. Because work is obtained from ordered molecular motion, the amount of entropy is also a measure of the molecular disorder, or randomness, of a system.
ΔS= Q rev/T
ΔS= change in entropy
Q rev= Heat
T = Temperature
CODING EXPLANATION:
- Given file contains thermal coefficients of species and local temperature and global tempertaure.
- Load the file using fopen command and store it.
- Given data is structured continously.
- Using fget1 command,each line is read.
- Given data is split and convert these data to cell array using strsplit.
- Converted cell arrays are converted into strings using str2num.
- Global temperatures are stored separately in variable.
- Skip the comments using same fget1 command.
- Using fget1 command, header of the species block is read.
- Species name is extracted from the line.
- Local temperatures are extracted and converted as strings.
- First 7 coefficients are high temperature coefficients and next 7 coefficients are low temperature coefficients.
- All those coefficients are separated line by line using fget1 command and convert it to strings using str2double.
- From given formula,function file has created for calculating Specific heat,enthalpy and entrophy.
- From the calculated data,Specific heat ,Enthalpy and Entrophy has been calculated.
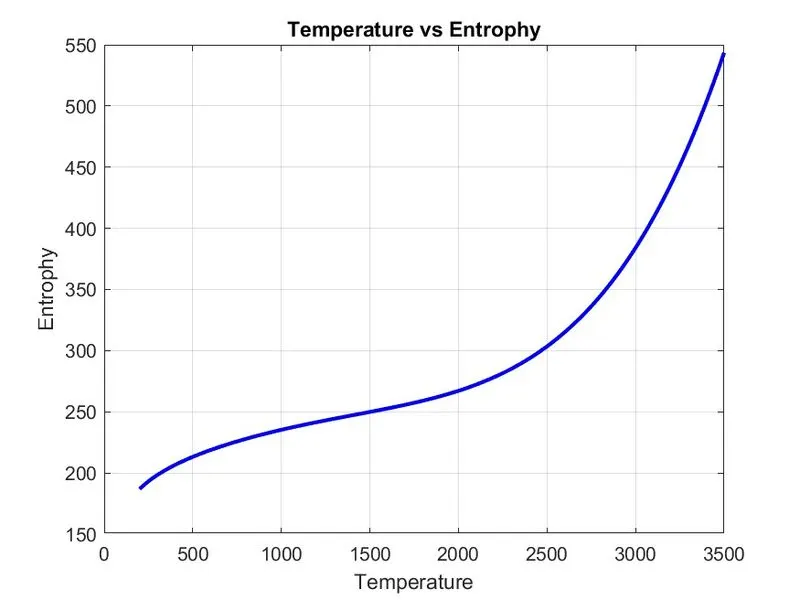
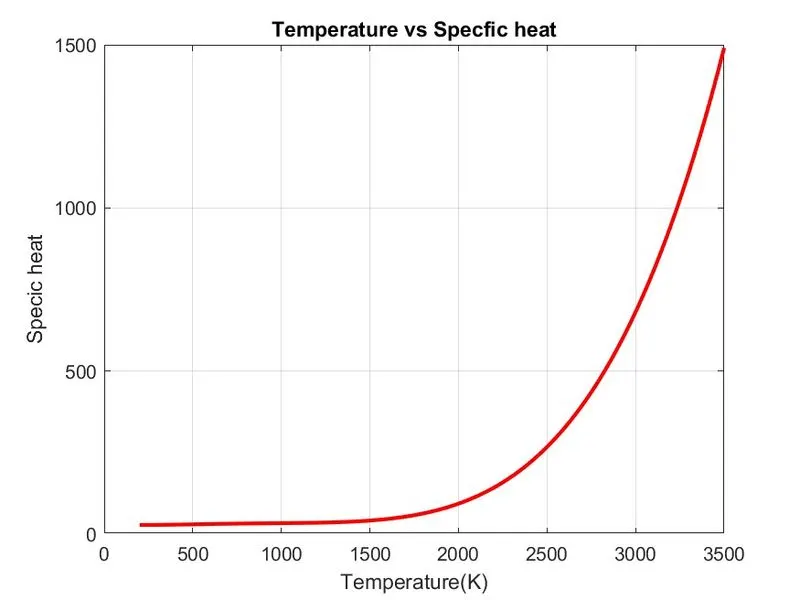
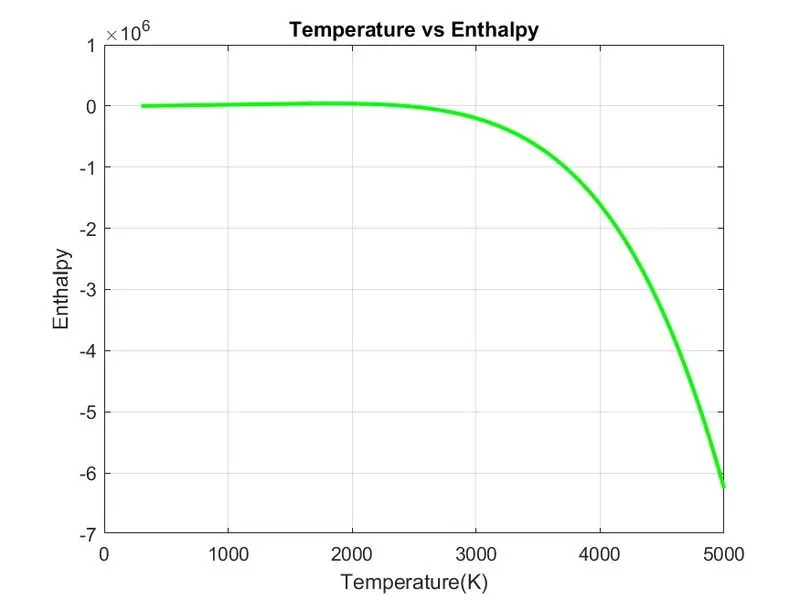
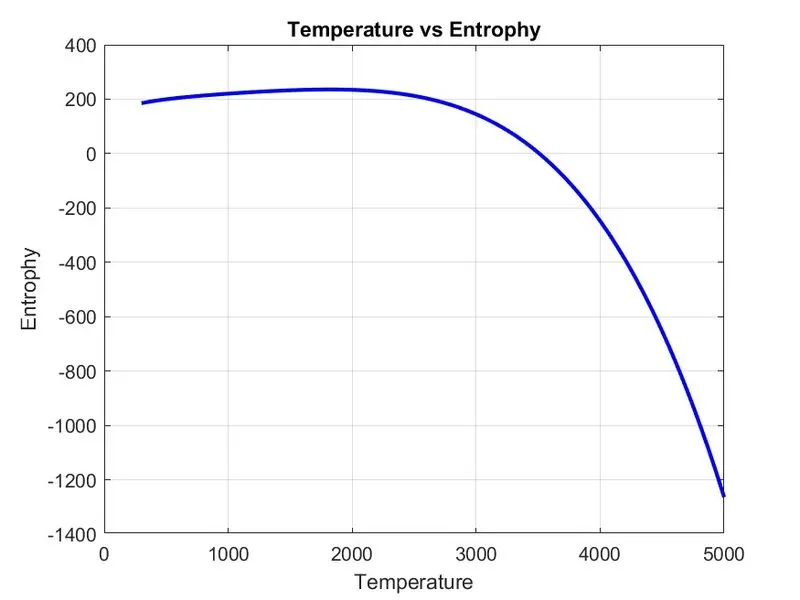
- Plot separate graphs for Specific heat,Enthalpy and entrophy using plot command.
- Using mkdir and cd command,a new directory is created and changed to that folder.
- All plotted graphs are saved in that folder using saveas command.
- Return to the old directory using cd command
- Using for loop, Specific heat ,Enthalpy and Entrophy for all species are calculated.
- Molecular weight for each species has been calculated using function file.
- An array has been for common compound species.
- Values of compond species are stored in separate species.
- Using nested for loop,one loop for species name and another loop for common species.
- Using if loop and strcmp command,species name and common compund species are compared.
- Molecular weight are calculated easily for simple terms.
- For complex compound species, another if loop is used.
CODING:
close all
clear all
clc

%Reading thermo.dat file%
File=fopen('THERMO.dat',"r");

Header=fgetl(File);
temperture=fgetl(File);
temp=strsplit(temperture,' ');


%Temp_low
temp_low=str2num(temp{2});

%temp_mid
temp_mid=str2num(temp{3});

%temp_high
temp_high=str2num(temp{4});


%Skipping Commens
for i=1:3
Comments=fgetl(File);
end

for i=1:53
%Head of the Species block
species=fgetl(File);
tmp=strsplit(species,' ');

species_name=tmp{1};

%Getting local low & high temperatures


local_low_temp=(tmp{end-3});
t1=str2num(local_low_temp);
local_mid_temp=(tmp{end-1});
t2=str2num(local_mid_temp);
local_high_temp=(tmp{end-2});
t3=str2num(local_high_temp);

%Calculating Temperature
T=linspace(t1,t3,500);

%Parsing Species block
    tmp1=fgetl(File);
    tmp01=findstr(tmp1,'E');
   %First line of Species block
    a1=str2double(tmp1(1:15));
    a2=str2double(tmp1(16:30));
    a3=str2double(tmp1(31:45));
    a4=str2double(tmp1(46:60));
    a5=str2double(tmp1(61:75));


    %Second line of Species block
      tmp2=fgetl(File);
    tmp02=findstr(tmp2,'E');

    a6=str2double(tmp2(1:15));
    a7=str2double(tmp2(16:30));
    a8=str2double(tmp2(31:45));
    a9=str2double(tmp2(46:60));
    a10=str2double(tmp2(61:75));

     %Second line of Species block
      tmp3=fgetl(File);
    tmp03=findstr(tmp3,'E');

    a11=str2double(tmp3(1:15));
    a12=str2double(tmp3(16:30));
    a13=str2double(tmp3(31:45));
    a14=str2double(tmp3(46:60));

    %Calculating Specific Heat,Enthalpy and Entrophy
    [C_p,H,S]=coeff(a1,a2,a3,a4,a5,a6,a7,a8,a9,a10,a11,a12,a13,a14,t2,T);


    %Creating Directory
    mkdir(species_name)
    cd(species_name)


    %Plotting the Graphs

    figure(1)
    plot(T,C_p,'LineWidth',2,'Color','r')
    grid on
    xlabel('Temperature(K)')
    ylabel('Specic heat')
    title('Temperature vs Specfic heat')

    f1_name=sprintf('Specific heat of %s',species_name);
    saveas(gcf,f1_name,'jpg')


    figure(2)
    plot(T,H,'LineWidth',2,'Color','g')
    grid on
    xlabel('Temperature(K)')
    ylabel('Enthalpy')
    title('Temperature vs Enthalpy')
    f2_name=sprintf('Enthalpy of %s',species_name);
    saveas(gca,f2_name,'jpg')

figure(3)
    plot(T,S,'LineWidth',2,'Color','b')
    grid on
    xlabel('Temperature')
    ylabel('Entrophy')
    title('Temperature vs Entrophy')
    f3_name=sprintf('Entrophy of %s',species_name);
    saveas(gcf,f3_name,'jpg')

    %Changing Directory
    cd ..

    %Calculating Molecular weight of Species name
    mw=mole_wt(species_name);

end
FUNCTION FILE:
SPECIFIC HEAT,ENTHALPY & ENTROPHY
function [C_p,H,S]=coeff(a1,a2,a3,a4,a5,a6,a7,a8,a9,a10,a11,a12,a13,a14,t2,T)
R=8.0314;
high_temp_coeff=a1:a7;
low_temp_coeff=a8:14;
if (T>t2)
C_p=R*(a1+a2*(T)+a3*(T.^2)+a4*(T.^3)+a5*(T.^4));
H=R*(a1*T+(a2.*(T.^2))./2+(a3.*(T.^3))./3+(a4.*(T.^4))./4+a5.*(T.^5)./5+a6);
S=R*((a1*log(T))+(a2*T)+(a3*(T.^2))./2+(a4*(T.^3))./3+(a5*(T.^4))./4+a7);
else
C_p=R*(a8+a9*(T)+a10*(T.^2)+a11*(T.^3)+a12*(T.^4));
H=R*(a8*T+(a9*(T.^2))./2+(a10*(T.^3))./3+(a11*(T.^4))./4+(a12*(T.^5))./5+a13);
S=R*((a8*log(T))+(a9*T)+(a10*(T.^2))./2+(a11*(T.^3))./3+(a12*(T.^4))./4+a14);
end
MOLECULAR WEIGHT:
function mw=mole_wt(species_name)

element=(species_name);

%Creating an array for species name
Sp_name=['C','H','O','N','A'];

%Molecular weight for Species name
val=[12.011 1.007 15.999 14.007 39.948];

mw=0;
for i=1:length(element)
    for j=1:length(Sp_name)
        if strcmp(element(i),Sp_name(j))
            mw=mw+val(j);
            pos=j;
        end
    end
    k=str2num(element(i));
    if (k>1)
        mw=mw+val(pos)*(k-1);
    end
end
    fprintf('Molecular weight of %s is %f',element,mw)
end
RESULT:
- Graphs are plotted for all species.
- All plotted graphs are stored in separate folder.
- Molecular weight of species has been calculated.
Plotting
O2
N2
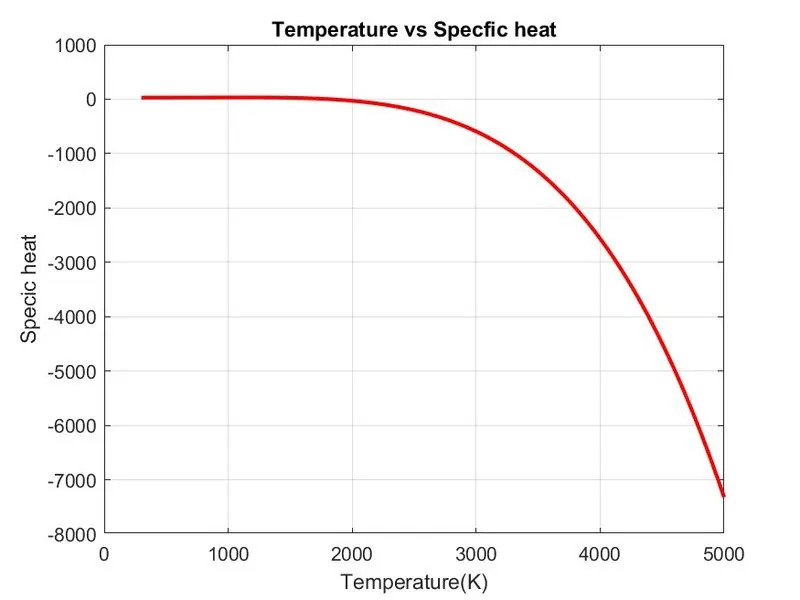
Co2