Project 1 - Parsing NASA thermodynamic data
INTRODUCTION: MATLAB code for parsing of NASA thermodynamic data to compute the thermodynamic properities specific heat(cp),enthalpy(H),entropy(S) from the polynomials.
1) main code:
% coding for parsing of a 'NASA thermodynamic file' to calculate specific
% heat(cp),enthalpy(H),entropy(s) & molecular weight for defined local temperatures & plotting
% for the variables cp,H,S with respect to temperature.
clear
close all
clc

% NASA thermodynamic datafile reading
f1=fopen('THERMO.dat','r');
for i= 1:5
fgetl(f1)
end
for j=1:53
    a= fgetl(f1);
    b= strsplit(a,' ');
    species=b{1};

%  local temperatures of species (mono atomic oxygen)

posdot = strfind(a,'.');
low_temp = a(posdot(1)-3:posdot(1)+3);
low_temp = str2double(low_temp);

mid_temp = a(posdot(3)-4:posdot(3)+3);
mid_temp = str2double(mid_temp);

high_temp = a(posdot(2)-4:posdot(2)+3);
high_temp = str2double(high_temp);

% extracting the temperature coefficients of line1
line1= fgetl(f1);
posl1= strfind(line1,'E');
t1= str2double(line1(1:posl1(1)+3));
t2= str2double(line1(posl1(1)+4:posl1(2)+3));
t3= str2double(line1(posl1(2)+4:posl1(3)+3));
t4= str2double(line1(posl1(3)+4:posl1(4)+3));
t5= str2double(line1(posl1(4)+4:posl1(5)+3));

% extracting the temperature coefficients of line2
line2= fgetl(f1);
posl2= strfind(line2,'E');
t6= str2double(line2(1:posl2(1)+3));
t7= str2double(line2(posl2(1)+4:posl2(2)+3));
t8= str2double(line2(posl2(2)+4:posl2(3)+3));
t9= str2double(line2(posl2(3)+4:posl2(4)+3));
t10= str2double(line2(posl2(4)+4:posl2(5)+3));

% extracting the temperature coefficients of line3
line3= fgetl(f1);
posl3= strfind(line3, 'E');
t11= str2double(line3(1:posl3(1)+3));
t12= str2double(line3(posl3(1)+4:posl3(2)+3));
t13= str2double(line3(posl3(2)+4:posl3(3)+3));
t14= str2double(line3(posl3(3)+4:posl3(4)+3));


% mathematical polynomials/formulae used to compute CP,H & S
% for loop instructions to find w.r.t local temperatures of various species.

T = linspace(low_temp,high_temp,100);
R= 8.314;
 for i=1:length(T)
     if T(i)>mid_temp
         cp(i)= (t1+t2.*T(i)+t3.*T(i).^2+t4.*T(i).^3+t5.*T(i).^4)*R;
         H(i)= R*T(i).*(t1+((t2*T(i)/2))+((t3*T(i).^2)/3)+((t4*T(i).^3)/4)+((t5*T(i).^4)/5)+((t6./T(i))));
         S(i)= (t1.*log(T(i))+t2.*T(i)+t3.*(T(i)^2)/2+t4.*(T(i)^3)/3+t5.*(T(i)^4)/4+t7)*R;
     else
         cp(i)= (t8+t9.*T(i)+t10.*T(i).^2+t11.*T(i).^3+t12.*T(i).^4)*R;
         H(i)= R*T(i).*(t8+((t9*T(i)/2))+((t10*T(i).^2)/3)+((t11*T(i).^3)/4)+((t12*T(i).^4)/5)+((t13./T(i))));
         S(i)= (t8.*log(T(i))+t9.*T(i)+t10.*(T(i)^2)/2+t11.*(T(i)^3)/3+t12.*(T(i)^4)/4+t14)*R;
     end
 end

% creating folders
% cd('/Users/sudharshankumarmanne/Documents/MATLAB')
mkdir(species);
cd(species);


% plotting on Specific heat vs Temperature
figure(1)
plot(T,cp)
xlabel('Temperature')
ylabel('specific heat')
title('specific heat vs Temperature of ', species)

% plotting on Enthalpy vs Temperature
figure(2)
plot(T,H)
xlabel('Temperature')
ylabel('Enthalpy')
title('Enthalpy vs Temperature of ', species)

% plotting on Entropy vs Temperature
figure(3)
plot(T,S)
xlabel('Temperature')
ylabel('Entropy')
title('Entropy vs Temperature of ', species)

% saving the generated graphs in the image formats.

    saveas(figure(1),'specific heat.png')
    saveas(figure(2),'Enthalpy.png')
    saveas(figure(3),'Entropy.png')

    cd ..

%   molecular weight function calling
% dispaying the molecular weights of speicies in the command window.

[Weight] = mol_wt(species);
k = sprintf('%s Weight = %f',species,Weight);
disp(k)
end
2) function script:
% function script to compute molecular weight for species of NASA thermodynamic data
function [Weight]= mol_wt(species)
Weight = 0;
atomic_names=['H','C','N','O','A'];
atomic_weight= [1,12,14,16,40];
for i= 1:length(species)
    for j=1:length(atomic_names)
        if strcmpi(species(i),atomic_names(j))
           Weight=Weight+atomic_weight(j);
            position=j;
        end
    end
    number = str2double(species(i));
    if (number>1)
        Weight = Weight + atomic_weight(position)*(number-1);
    end
%     W = Weight;
end
end
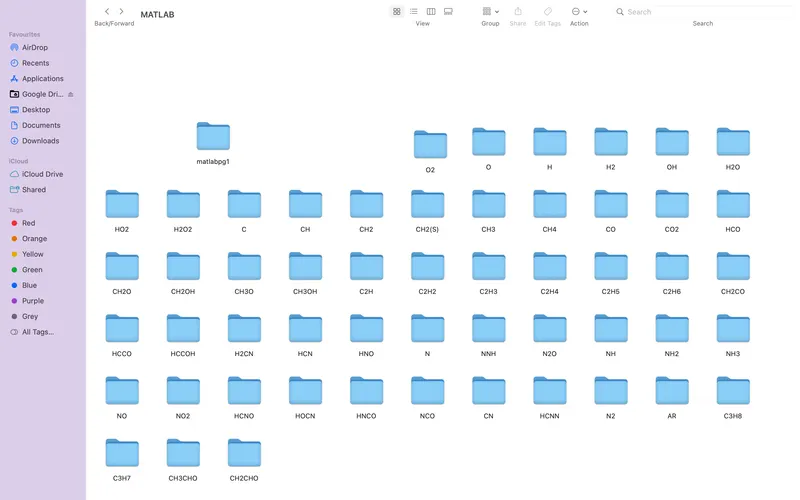
Folders for plots of various species:
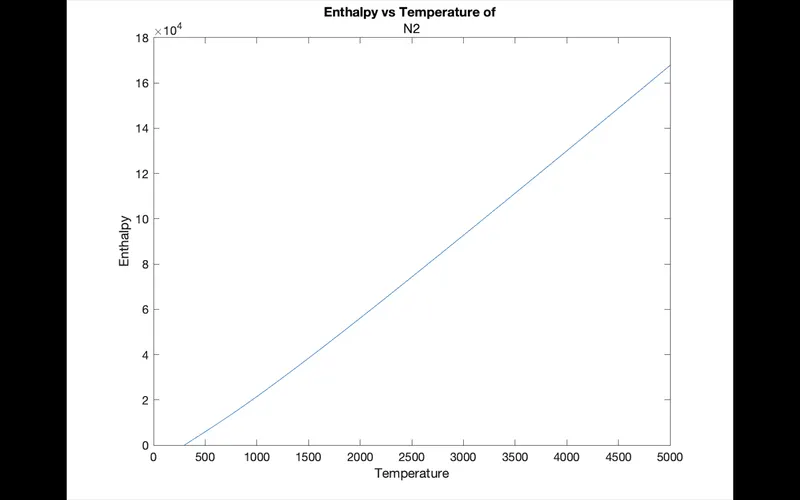
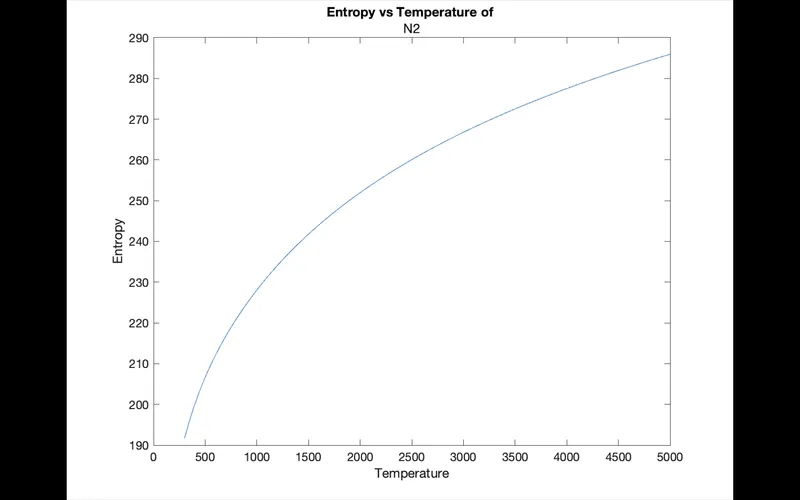
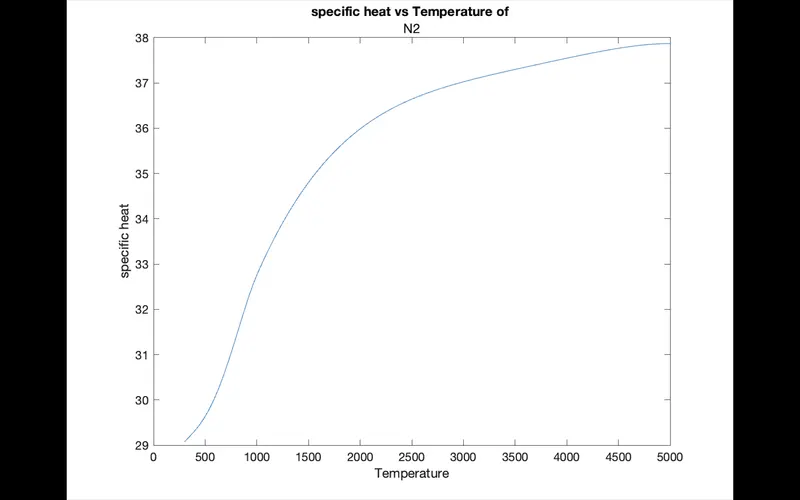
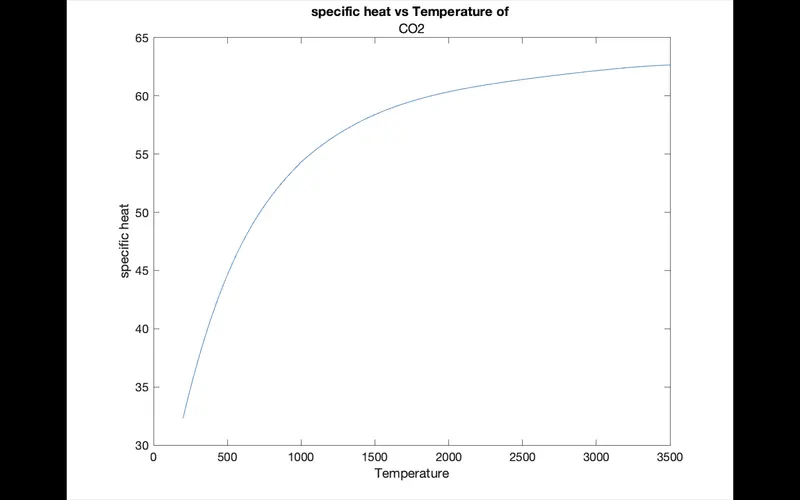
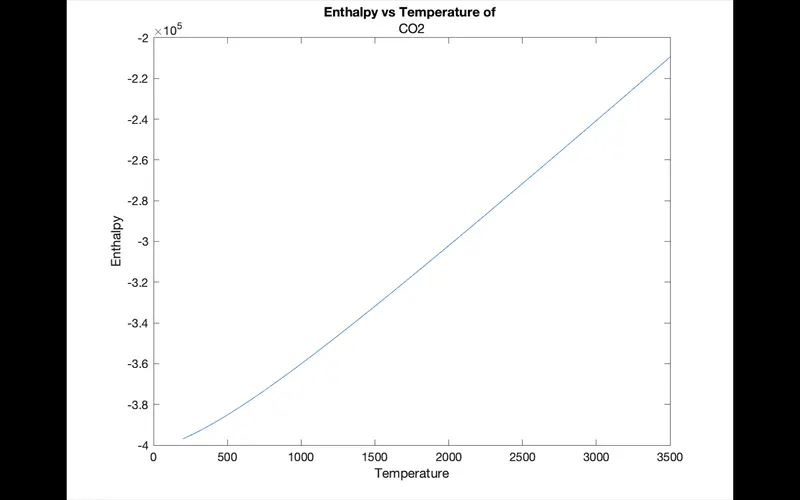
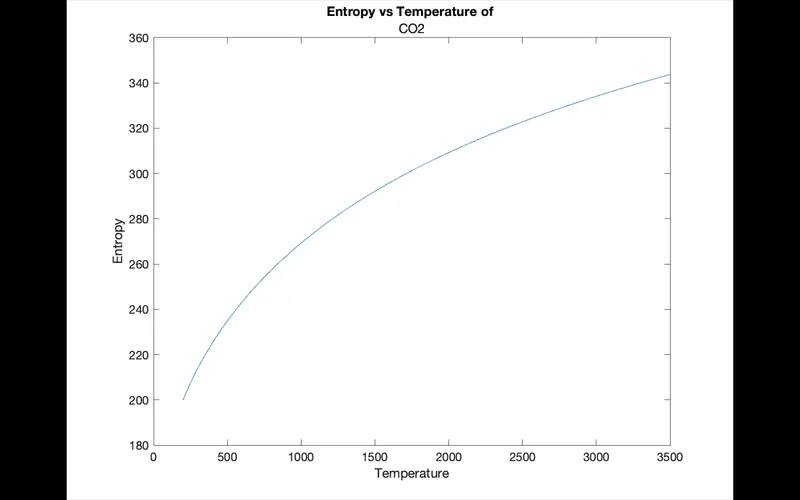
plots of N2, O2 & CO2:
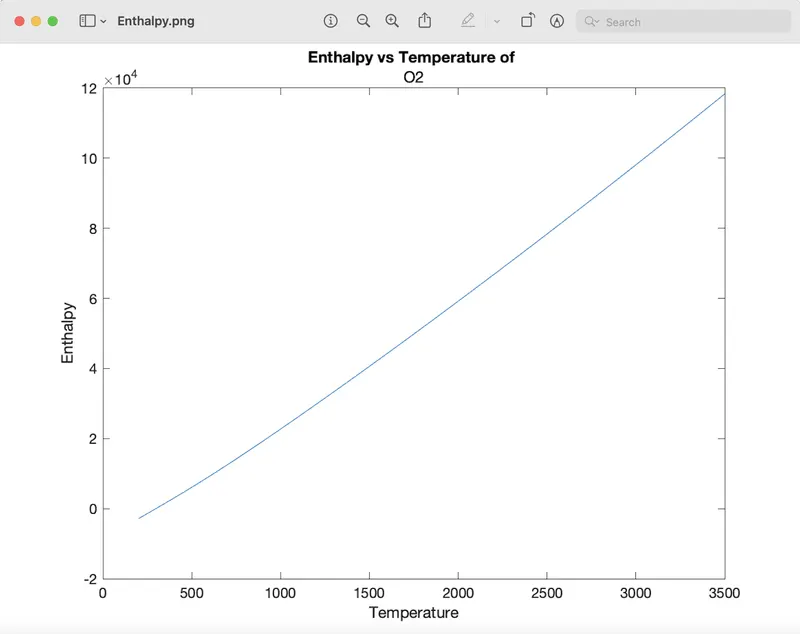
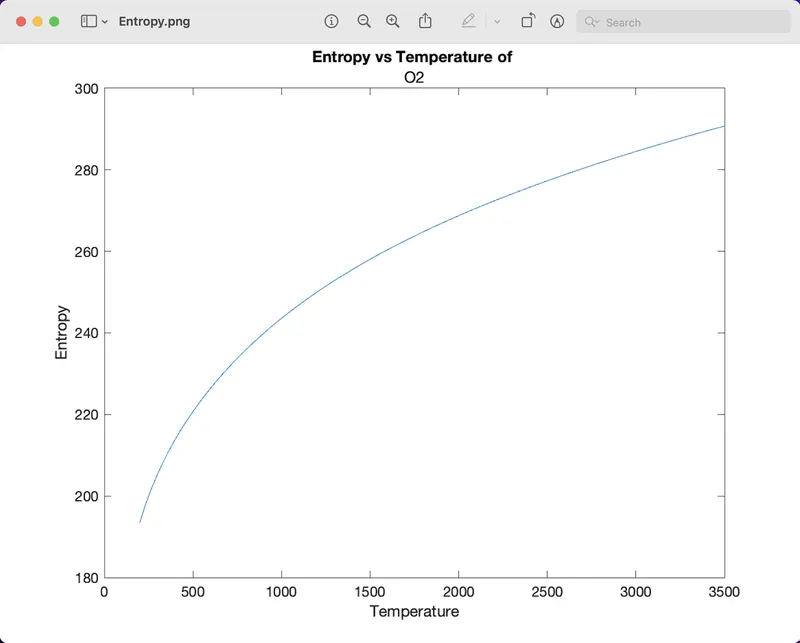
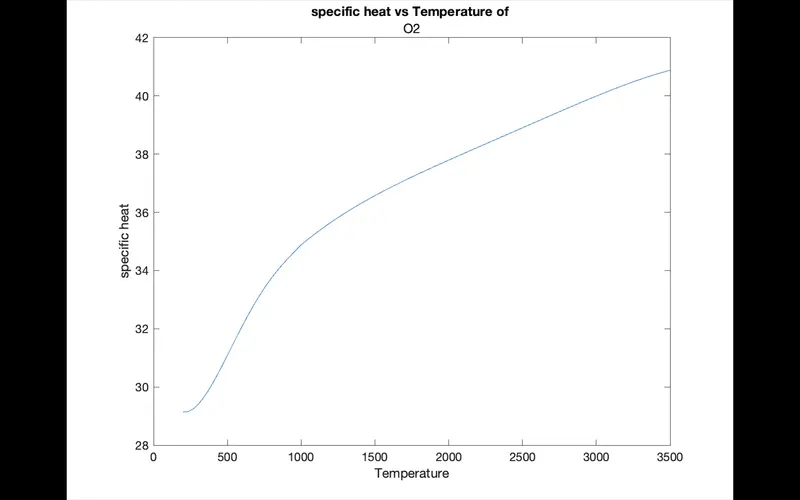
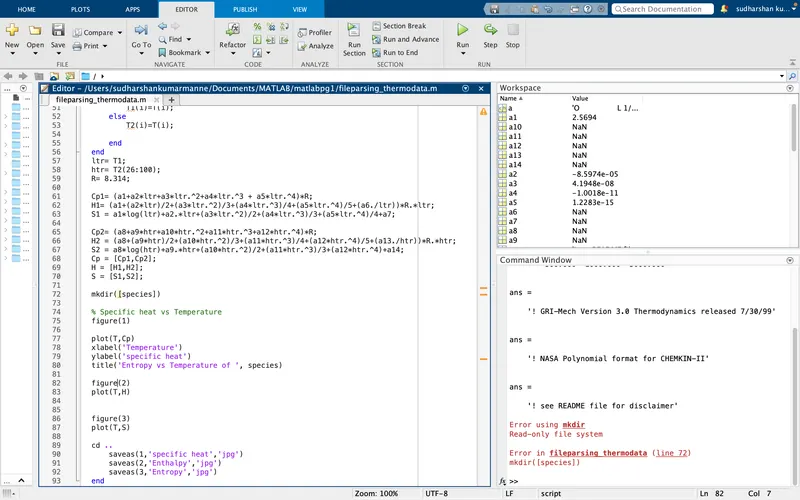
Errors screen shots:
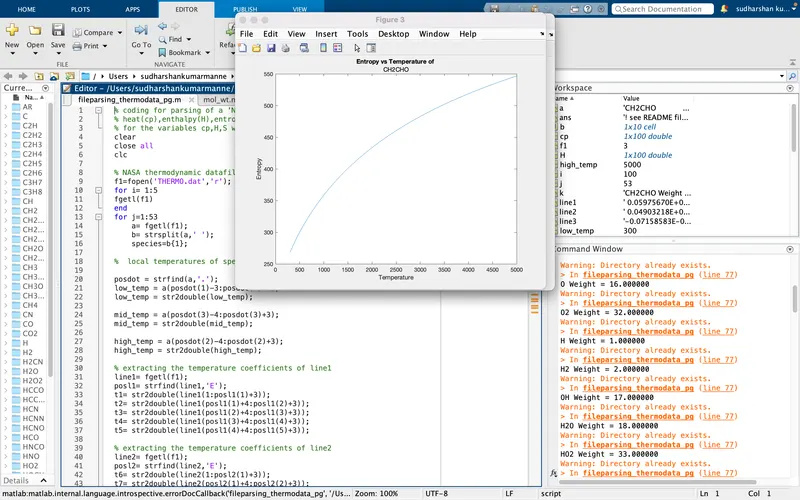
output :
Explanation:
- firstly, loaded the NASA thermodynamic data from the THERMO.dat file & opened the file in the code script using the command fopen thus stored in the string f1.
- as well as the header lines of data file got read line by line using fgetl command ,as following for loop instructions.
- in addition , followed for loop instructions for upto 53 species , in order to find positioning & extraction of coefficients for each species based on thermodynamic data exist in the file, such that used strsplit & fgetl commands used for the string position finding & reading the lines of various species in the file.
- furtherly , extracted the local temperatures of species followed by position of string/character which is given by the strfind command & then converted the strings into numbers using str2double command, thus stored them such as low temperature, middle temperature & high temperature respectively.
- moreover , extracted the temperature coefficients from the data file stored in string f1 followed by the position of string E in each temperature coefficient of species using the command strfind , and the each line of coefficients of species got read line by line using the fgetl command respectively.
- eventually computed the thermodynamic properties specific heat(Cp), enthalpy(H) & entropy(S) w.r.t input variable local temperature range using the linspace command & for loop/if loop instructions for each species from the standard mathematical formulae/polynomials as the temperature coefficients are input from the data file.
- thus created folders for all the species using the command mkdir in order to save all the generated plots in the directory, such as Cp vs T , H vs T , S vs T of various species(53) in the data file. such that generated plots of thermodynamic proprties for each species using plot command, as well as saved those generated graphs images using the saveas command in supported format as (.png) respectively.
- in addtion to the main code , developed/coded function script to calcualte the molecular weights of all species given the THERMO.dat file using standard mathematical formulae followed by the standard atomic weights. such that initially the molecular weight assigned/defined as zero for the calculation purpose as well as the arrays created for atomic names and atomic weights using the square brackets command.
- such that nested for loop instructions were used in the calculation of molecular weights for the range/length of species w.r.t the length/range of atomic names specified in the arrays as [ H,C,N,O,A] followed by atomic weights as [ 1 ,12 ,14, 16, 40] respectively.
- thus specified the condition if for string comparison of species & atomic names were made using the strcompi such that found final value of weight from the sum of initial weight & atomic weight of names specified in array.
- eventually converted the string of species into numbers using the command str2double for the calculation of moeluclar weight using the mathematical formulae followed by the conditon if as number>1 & atomic name positon respectively.
- hence the mol_wt function script template used in the main code to print & display the calculated molecular weights of all the species using the sprintf & disp(k) commands respectively.
Errors:
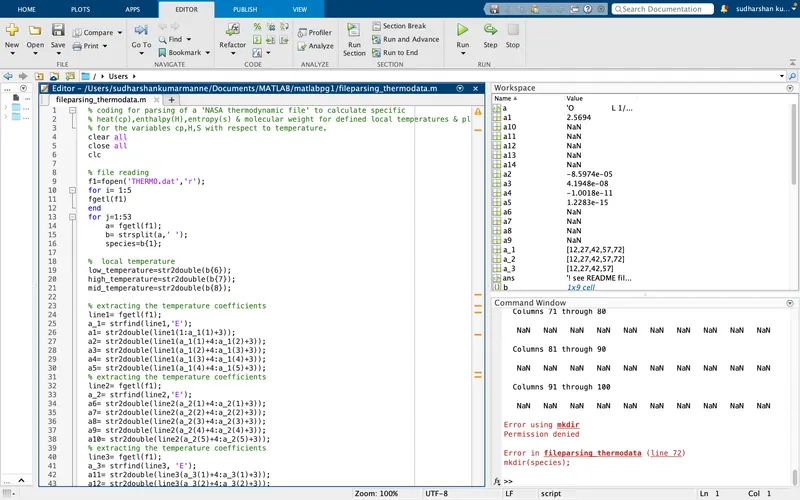
- faced error in the extraction of temperature coefficients from the THERMO.dat file as displayed as NaN in the workspace/command window, such that rectified by following the accurate positioning of string/character (.) for local temperatures & string (E) for all the temperature coefficients ,thus extracted accurately.
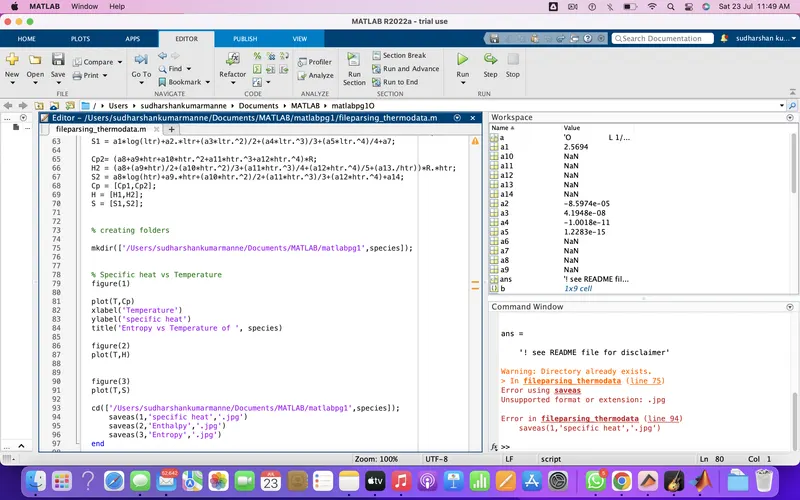
- another error made in the folder creation using mkdir for species plots, such that used square brackets inside the normal brackets as ([species]), thus rectified by removing the square brackets instead used normal brackets only.
- final error made in the saving of plots of graphs generated for the species such as used unsupported format (.jpg), thus rectified by replacing (.png) format instead.
inference:
- hence obtained the accurate output of thermodynamic properties/ molecular weights for all the species of THERMO.dat file.
- as from this challenge & results , understood that the fileparsing plays a significant role in the transformation/automation of any kind of larger manual data into computational language process inorder to compute the requred parameters & aquiring the output results in easier method or simple efforts.