Project 1 - Parsing NASA thermodynamic data
AIM:-To write a code in MATLAB to parse nasa thermodynamic data file and then calculate thermodynamic properties of various gas species.
OBJECTIVE:-
- Write a function that extracts the 14 coefficients and calculates the enthalpy,entropy and specific heats for all the species in the data file.
- Calculating molecular weight of each species.
- Plotting the specific heat,enthalpy and entropy for the local temperature range.
- Saving the plots as images with appropriate names and dumping them in seperate folders for each species.
THEORY:-
File Parsing:- File parsing is a method to extract the data from raw file. file parsing converts unstructured data or unreadable data into more readable and valuable information.parsers are usually programmatically built based on particular data to read, analyse, transform, and provide more structured results. However, when the data is complex, we might need to write some additional rules and conditions, which are sometimes challenging.
For specific Heat
c_p = R*(c1+(c2.*temp)+(c3.*(temp.^2))+(c4.*(temp.^3))+(c5.*(temp.^4)));
For enthalpy
H = R.*temp.*(c1+(c2.*(temp./2))+(c3.*(temp.^2./3 ))+(c4.*(temp.^3./4))+(c5.*(temp.^4./5))+(c6./temp));
For entropy
S = R*(c1.*log(temp)+(c2.*temp)+(c3.*(temp.^2./2))+(c4.*(temp.^3./3))+(c5.*(temp.^4./4))+c7);
where
temp=local temprature
c1-c7=high temperature coefficient
c8-c14=low temprature coefficient
R=Gas constant=8.314
Main Code:-
%% AIM:- To write a code in MATLAB to parse nasa thermodynamic data file and then calculate thermodynamic properties of various gas species.

clear all
close all
clc

%% input variables

 % R is universal gas constant
 R = 8.314;
data = fopen('THERMO.dat','r');

for i = 1:5
    get=fgetl(data);
end


%% for specises

   for i = 1:53
   %% reading species line
   f1 = fgetl(data);
   s = strsplit(f1,' ');
   species_name = s{1};
   low_temp = str2num(s{end-3});
   mid_temp = str2num(s{end-1});
   high_temp = str2num(s{end-2});
%    local_temp = [low_temp,mid_temp,high_temp];

   %% reading species 2nd line

   f2 = fgetl(data);
   find = strfind(f2,'E');
   c1 = str2num(f2(1:find(1)+3));
   c2 = str2num(f2(find(1)+4:find(2)+3));
   c3 = str2num(f2(find(2)+4:find(3)+3));
   c4 = str2num(f2(find(3)+4:find(4)+3));
   c5 = str2num(f2(find(4)+4:find(5)+3));

   %% reading species 3rd line

   f3 = fgetl(data);
   find = strfind(f3,'E');
   c6 = str2num(f3(1:find(1)+3));
   c7 = str2num(f3(find(1)+4:find(2)+3));
   c8 = str2num(f3(find(2)+4:find(3)+3));
   c9 = str2num(f3(find(3)+4:find(4)+3));
   c10 = str2num(f3(find(4)+4:find(5)+3));

   %% reading species 4th line

   f4 = fgetl(data);
   find = strfind(f4,'E');
   c11 = str2num(f4(1:find(1)+3));
   c12 = str2num(f4(find(1)+4:find(2)+3));
   c13 = str2num(f4(find(2)+4:find(3)+3));
   c14 = str2num(f4(find(3)+4:find(4)+3));

   high_temp_coefficients = [c1,c2,c3,c4,c5,c6,c7];
   low_temp_coefficients = [c8,c9,c10,c11,c12,c13,c14];

   temp = linspace(low_temp,high_temp,100);

   %% to calculate

    %specific heat by creating function

    c_p = specific_heat(c1,c2,c3,c4,c5,c8,c9,c10,c11,c12,mid_temp,temp,R);

    %enthalpy by creating function

    H = enthalpy(c1,c2,c3,c4,c5,c6,c8,c9,c10,c11,c12,c13,mid_temp,temp,R);

    %entropy by creating function

    S = entropy(c1,c2,c3,c4,c5,c7,c8,c9,c10,c11,c12,c14,mid_temp,temp,R);

    mkdir('D:\Software Extract\Matlab\Install\bin\challenges',species_name);
    cd(species_name)

    figure(1)
    plot(temp,c_p,'color','r')
    xlabel('Temptaure[K]')
    ylabel('Specific Heat[KJ/K-mol-K]')
    legend('Specific Heat Vs Temprature','location','North')
    title('Specific Heat vs Temprature')
    saveas(figure(1),'cp vs temp.jpg')

    figure(2)
    plot(temp,H,'color','g')
    xlabel('Temptaure[K]')
    ylabel('Enthalpy[KJ]')
    legend('Enthalpy Vs Temprature','location','North')
    title('Enthalpy vs Temprature')
    saveas(figure(2),'h vs temp.jpg')

    figure(3)
    plot(temp,S,'color','b')
    xlabel('Temptaure[K]')
    ylabel('Entropy[KJ/K]')
    legend('Entropy Vs Temprature','location','North')
    title('Entropy vs Temprature')
    saveas(figure(3),'s vs temp.jpg')

    cd ..

    %% calculating Molecular weight

    [M]=molecular_weight(species_name);

   end
Function Specific Heat Code:-
function [c_p] = specific_heat(c1,c2,c3,c4,c5,c8,c9,c10,c11,c12,mid_temp,temp,R)

if (temp <= mid_temp)

    c_p = R*(c8+c9.*(temp)+(c10.*(temp.^2))+(c11.*(temp.^3))+(c12.*(temp.^4)));

else

    c_p = R*(c1+(c2.*temp)+(c3.*(temp.^2))+(c4.*(temp.^3))+(c5.*(temp.^4)));


end

end
Function Enthalpy Code:-
function [H] = enthalpy(c1,c2,c3,c4,c5,c6,c8,c9,c10,c11,c12,c13,mid_temp,temp,R)

if (temp <= mid_temp)

     H = R.*temp.*(c8+(c9.*(temp./2))+(c10.*(temp.^2./3))+(c11.*(temp.^3./4))+(c12.*(temp.^4./5))+(c13./temp));

else

   H = R.*temp.*(c1+(c2.*(temp./2))+(c3.*(temp.^2./3  ))+(c4.*(temp.^3./4))+(c5.*(temp.^4./5))+(c6./temp));

end
end
Function Entropy Code:-
function [S] = entropy(c1,c2,c3,c4,c5,c7,c8,c9,c10,c11,c12,c14,mid_temp,temp,R)

if (temp <= mid_temp)

    S = R*(c8.*log(temp)+c9.*(temp)+(c10.*(temp.^2./2))+(c11.*(temp.^3./3))+(c12.*(temp.^4./4))+c14);

else

    S = R*(c1.*log(temp)+(c2.*temp)+(c3.*(temp.^2./2))+(c4.*(temp.^3./3))+(c5.*(temp.^4./4))+c7);

end

end
Function Molecular Weight Code:-
function [mol_wt] = molecular_weight(species_name)

atomic_mass=[1.008,12.011,14.007,15.999,39.948];
elements=['H','C','N','O','A'];  %A = AR = Argon

mol_wt=0;
for i=1:length(species_name)
    for j=1:length(elements)
        if strcmpi(species_name(i),elements(j))
            mol_wt = mol_wt+atomic_mass(j);
            z=j;
        end
end
    f = str2num(species_name(i));
    if (f >= 1)
        mol_wt = mol_wt + (atomic_mass(z)*(f-1));
    end
end
   molecular_weight  = sprintf('Molecular weight of %s is %f',species_name,mol_wt);
   disp(molecular_weight)
end
Result:- We are getting directory with the specises name and graphs.
1. Directory

Plots for O2:-
1. Cp vs temp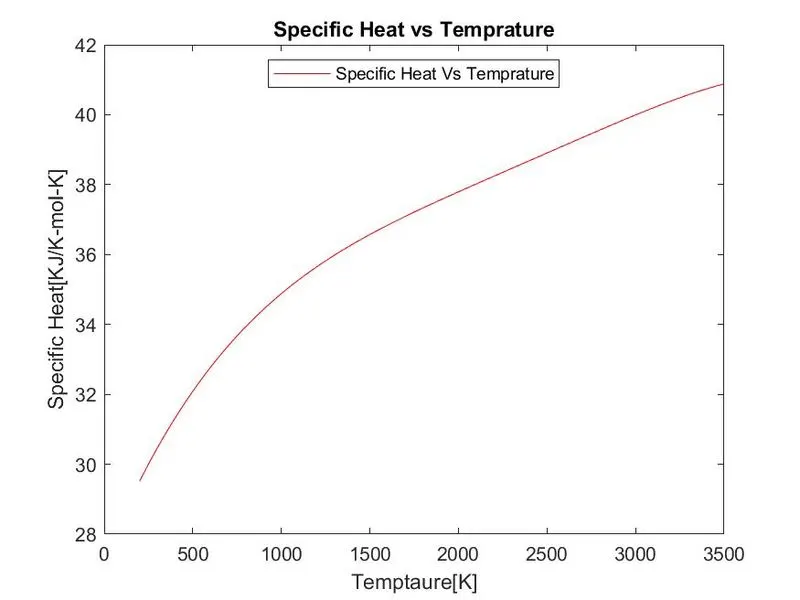
2. enthalpy vs temp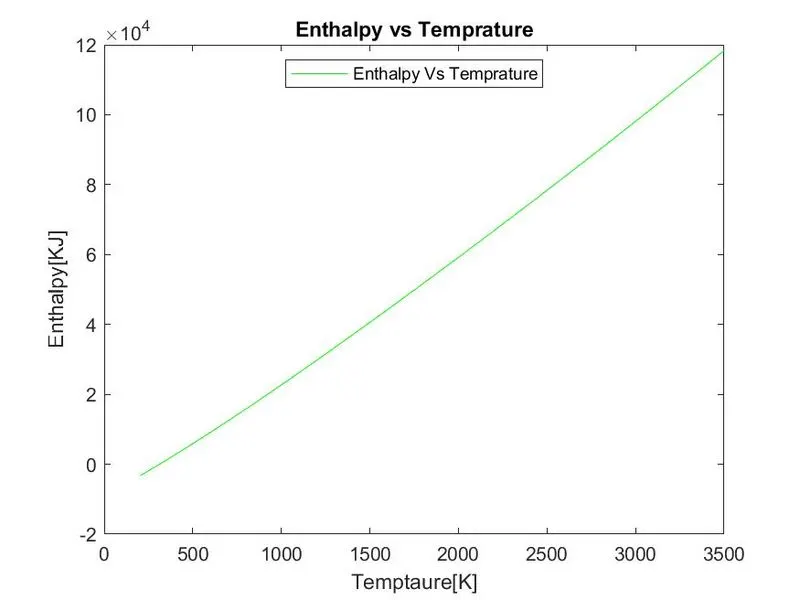
3. entropy vs temp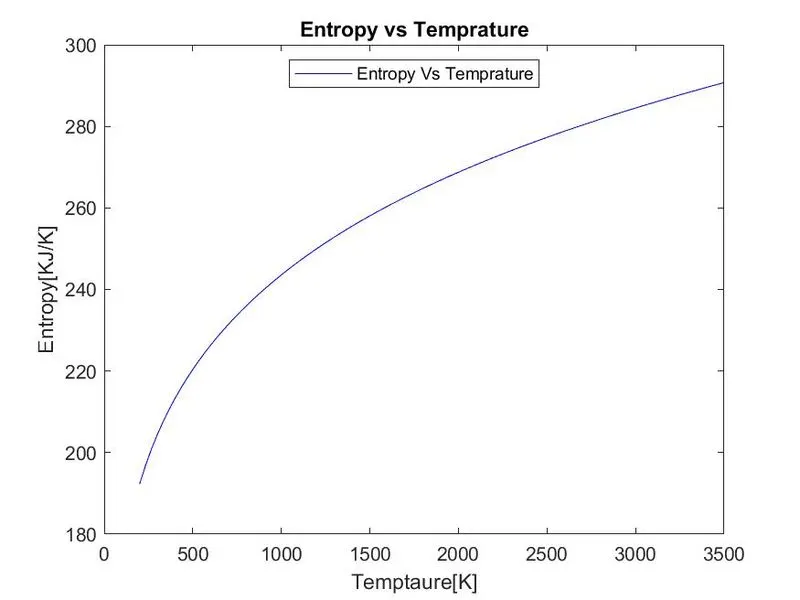
Plots for N2:-
1. Cp vs temp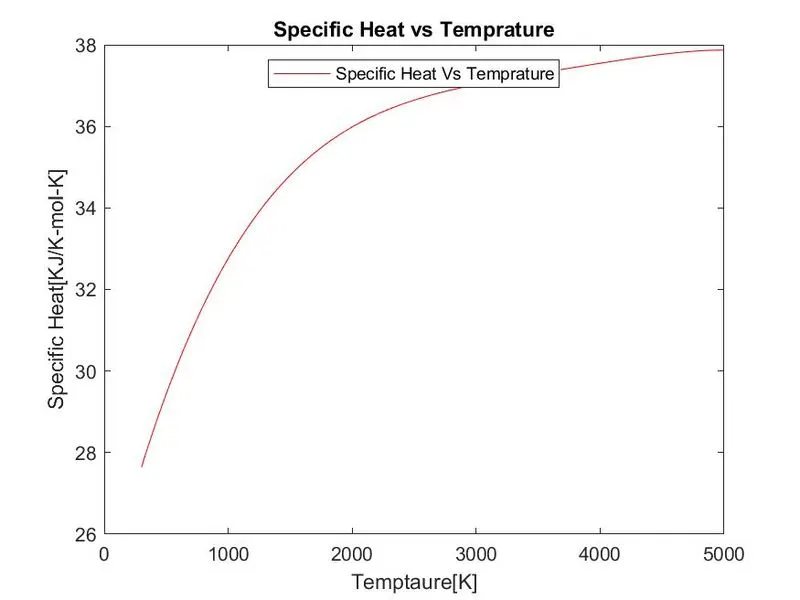
2. enthalpy vs temp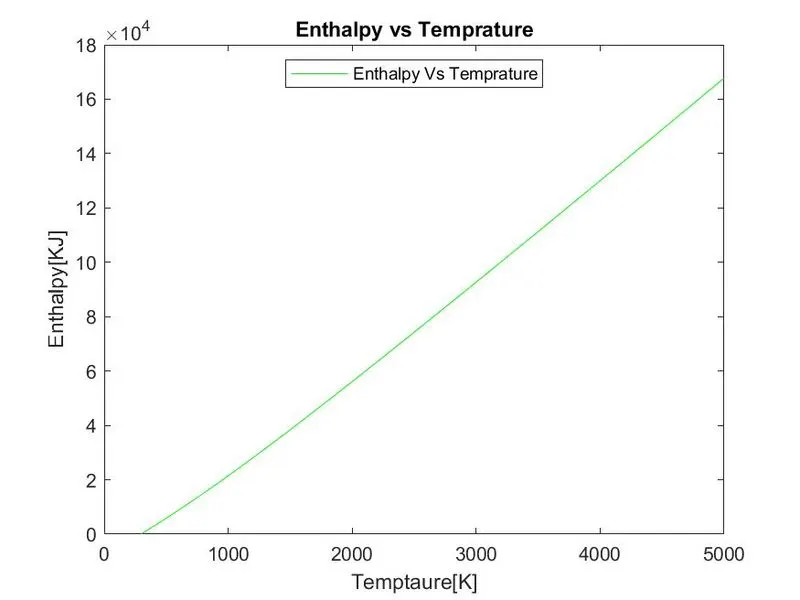
3. entropy vs temp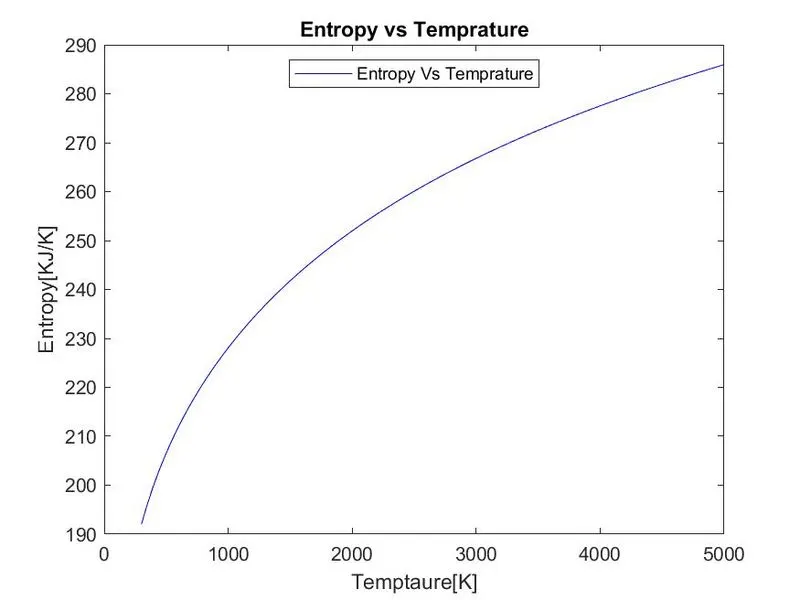
Plots for CO2:-
1. Cp vs temp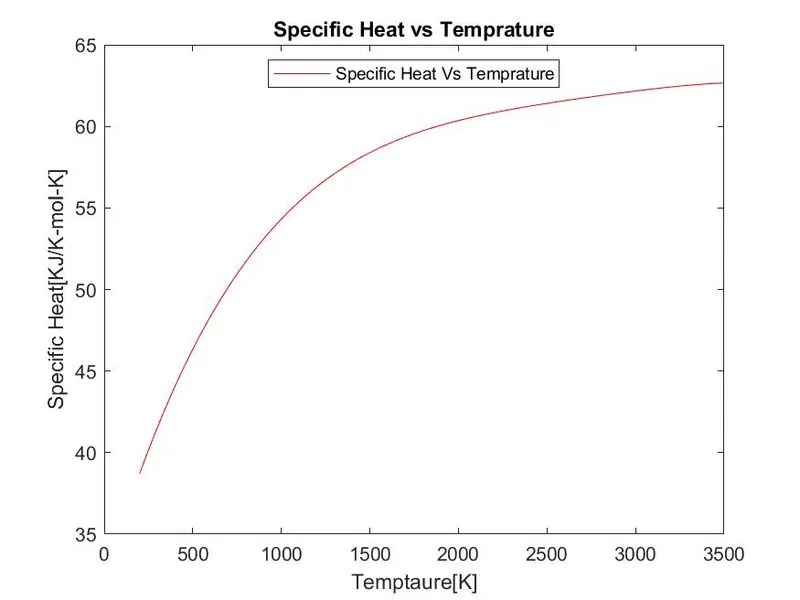
2. enthalpy vs temp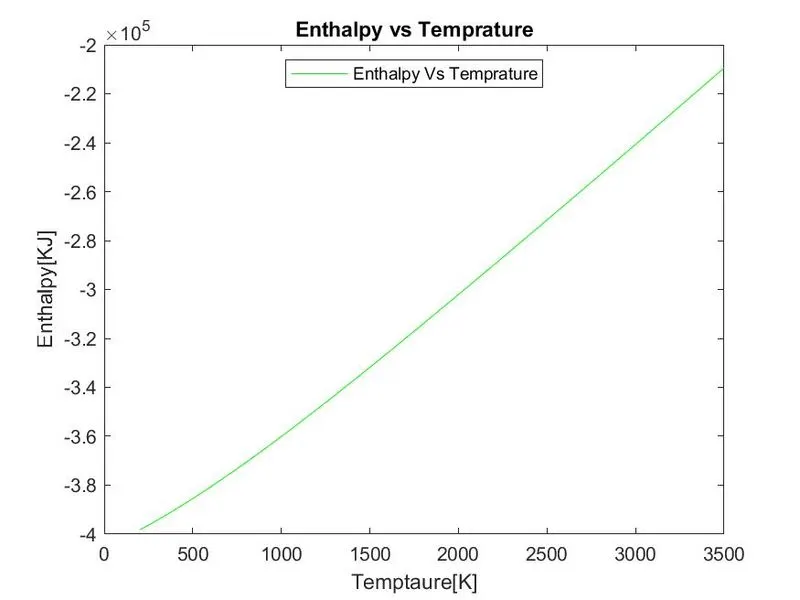
3. entropy vs temp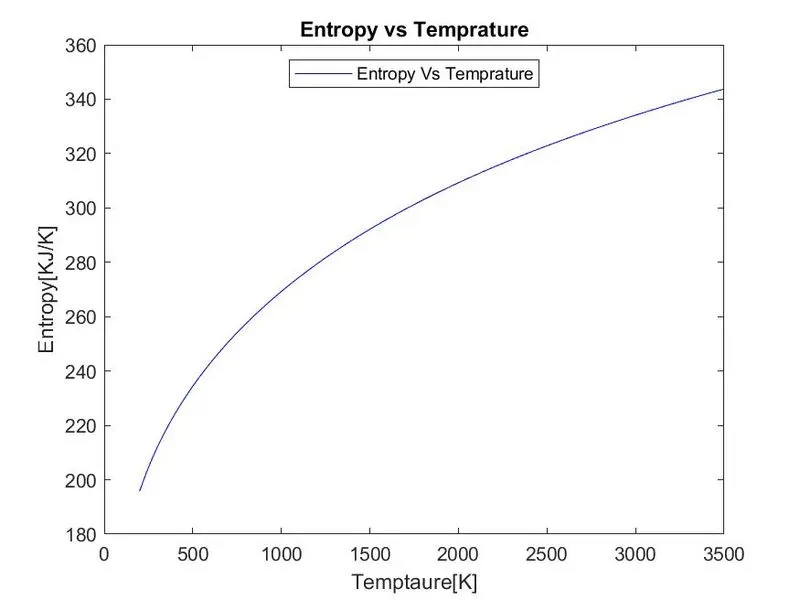
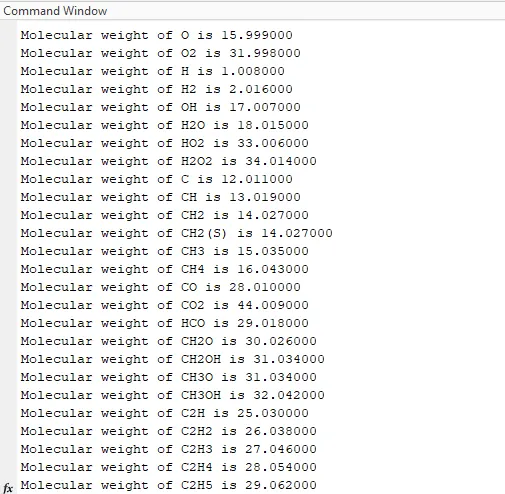
Command Window Result
Explanation:-
1. i start my program with clear all close all and clc
2. then i define R us universalgas constant which is 8.314
3. to load the raw data using fopen command.
data = fopen('THERMO.dat','r');
here data is the variable which store the THERMO.dat file
fopen command is use to open the file.
general syntax = fopen('file_name.file_extension','mode') mode= r (for reading), mode= w(for writting)
4. to skip the 1st five line i use for loop for 1:5.
for i = 1:5
get=fgetl(data); fgetl command is use to read or load the line in program in form of string.
end
general syntax for fgetl('variable_name')
5. by analysing the raw file we found that there are 53 specises and each species follow a fixed pattern(which means contain 4 set of line)
line 1 O L 1/90O 1 G 200.000 3500.000 1000.000 1
line 2 2.56942078E+00-8.59741137E-05 4.19484589E-08-1.00177799E-11 1.22833691E-15 2
line 3 2.92175791E+04 4.78433864E+00 3.16826710E+00-3.27931884E-03 6.64306396E-06 3
line 4 -6.12806624E-09 2.11265971E-12 2.91222592E+04 2.05193346E+00 4
6. to read 1st line of 1st species
i used fgetl(data) it will load the line 1
f1 = fgetl(data); f1 is the variable which store the data of line 1
7. now i split the string, in order to get that i use a simple logic of using empty space as delimiter.
s = strsplit(f1,' ')
general syntax = strsplit(variable_name,'delimiter')
here s variable which contain 10 cells
8. in order to extract the species name, i used a variable name (species_name) which generally represent a cell of s
species_name = s{1} ! we need to use curely bracket beacuse it is string.
9. in order to extract the local temprature which is again a cell of string s, and we are converting that string into number to excute mathematical operation for this we using 'str2num'
low_temp = str2num(s{end-3});
mid_temp = str2num(s{end-1});
high_temp = str2num(s{end-2});
11. we need to run fgetl one more time to enter in the next line
2.56942078E+00-8.59741137E-05 4.19484589E-08-1.00177799E-11 1.22833691E-15 2
10. in order to find the coefficients of species we need to apply a logic.
2.56942078E+00-8.59741137E-05 4.19484589E-08-1.00177799E-11 1.22833691E-15 2
close observation of above stringlocating the place of 'E' is important
so we can use 'findstr' command to find the position of 'E'
find = findstr(f2,'E') ! find contain the positio of E in string f1
general syntax = findstr(string_variable,'Delimiter')
11. to get the coefficient we need to use the value of find
c1 = str2num(f2(1:find(1)+3));
c2 = str2num(f2(find(1)+4:find(2)+3));
c3 = str2num(f2(find(2)+4:find(3)+3));
c4 = str2num(f2(find(3)+4:find(4)+3));
c5 = str2num(f2(find(4)+4:find(5)+3));
12. we need to run fgetl one more time to enter in the next line and apply the same logic to find coefficeient
13. temp array
temp = linspace(low_temp,high_temp,100)
14. to calculate specific heat we are using a condition which is based on temp value.
if temp <= mid_temp
c_p = R*(c8+c9.*(temp)+(c10.*(temp.^2))+(c11.*(temp.^3))+(c12.*(temp.^4)));
else
c_p = R*(c1+(c2.*temp)+(c3.*(temp.^2))+(c4.*(temp.^3))+(c5.*(temp.^4)));
end
to call this into main program we are creating function
function [c_p] = specific_heat(c1,c2,c3,c4,c5,c8,c9,c10,c11,c12,mid_temp,temp,R)
to call the function
c_p = specific_heat(c1,c2,c3,c4,c5,c8,c9,c10,c11,c12,mid_temp,temp,R);
15. to calculate enthalpy we are using a condition which is based on temp value.
if (temp <= mid_temp)
H = R.*temp.*(c8+(c9.*(temp./2))+(c10.*(temp.^2./3))+(c11.*(temp.^3./4))+(c12.*(temp.^4./5))+(c13./temp));
else
H = R.*temp.*(c1+(c2.*(temp./2))+(c3.*(temp.^2./3 ))+(c4.*(temp.^3./4))+(c5.*(temp.^4./5))+(c6./temp));
end
to call this into main program we are creating function
function [H] = enthalpy(c1,c2,c3,c4,c5,c6,c8,c9,c10,c11,c12,c13,mid_temp,temp,R)
to call the function
H = enthalpy(c1,c2,c3,c4,c5,c6,c8,c9,c10,c11,c12,c13,mid_temp,temp,R);
16. to calculate entropy we are using a condition which is based on temp value.
if (temp <= mid_temp)
S = R*(c8.*log(temp)+c9.*(temp)+(c10.*(temp.^2./2))+(c11.*(temp.^3./3))+(c12.*(temp.^4./4))+c14);
else
S = R*(c1.*log(temp)+(c2.*temp)+(c3.*(temp.^2./2))+(c4.*(temp.^3./3))+(c5.*(temp.^4./4))+c7);
end
to call this into main program we are creating function
function [S] = entropy(c1,c2,c3,c4,c5,c7,c8,c9,c10,c11,c12,c14,mid_temp,temp,R)
to call the function
S = entropy(c1,c2,c3,c4,c5,c7,c8,c9,c10,c11,c12,c14,mid_temp,temp,R);
17. to calculate molecular weight.
We need to use 2 for loops and 2 if condition
along with this we need to use string comparsion.
atomic_mass=[1.008,12.011,14.007,15.999,39.948]; ! array containing atmoic masses
elements=['H','C','N','O','A']; %A = AR = Argon ! array containing elemets
mol_wt=0; ! inital condition for mol weight
for i=1:length(species_name)
for j=1:length(elements)
if strcmpi(species_name(i),elements(j))
mol_wt = mol_wt+atomic_mass(j);
z=j;
end
end
f = str2num(species_name(i));
if (f >= 1)
mol_wt = mol_wt + (atomic_mass(z)*(f-1));
end
end
molecular_weight = sprintf('Molecular weight of %s is %f',species_name,mol_wt);
disp(molecular_weight)
end
1st for loop run the for loop command based on the length of species name.
for example species name is O2 means length is 2
for loop will run for 2 times
2nd for loop runs based on the length of element which is 5 it will run 5 times
if loop check the condition if it found ok then mol_wt command will run
str2num is used to convert the string to num.
species having more than one same element then itrun this command
if (f >= 1)
mol_wt = mol_wt + (atomic_mass(z)*(f-1));
end
to call this molecular weight function in program i created a function
function [mol_wt] = molecular_weight(species_name)
calling is done [M]=molecular_weight(species_name);
For Dumping the graphs.
directory should be created before the plotting so that plot can be dumed inside the directory
in order to create directory we are using mkdir('Location',variables_name)
mkdir('D:\Software Extract\Matlab\Install\bin\challenges',species_name);
cd(species_name)
to close the directory we use cd ..
For Plotting
figure(1)
plot(temp,c_p,'color','r')
xlabel('Temptaure[K]')
ylabel('Specific Heat[KJ/K-mol-K]')
legend('Specific Heat Vs Temprature','location','North')
title('Specific Heat vs Temprature')
saveas(figure(1),'cp vs temp.jpg')
figure(2)
plot(temp,H,'color','g')
xlabel('Temptaure[K]')
ylabel('Enthalpy[KJ]')
legend('Enthalpy Vs Temprature','location','North')
title('Enthalpy vs Temprature')
saveas(figure(2),'h vs temp.jpg')
figure(3)
plot(temp,S,'color','b')
xlabel('Temptaure[K]')
ylabel('Entropy[KJ/K]')
legend('Entropy Vs Temprature','location','North')
title('Entropy vs Temprature')
saveas(figure(3),'s vs temp.jpg')
Note:- the commands in main program runs 53 times.
Error:- the only error my getting is because m not converting the strings into numbers