Project 1 - Parsing NASA thermodynamic data
AIM:-
To write a code in MATLAB to parse nasa thermodynamic data file and then calculate thermodynamic
properties of various gas species.
OBJECTIVE:-
*Write a function that extracts the 14 coefficients and calculates the enthalpy,entropy and specific heats
for all the species in the data file.
*Calculating molecular weight of each species.
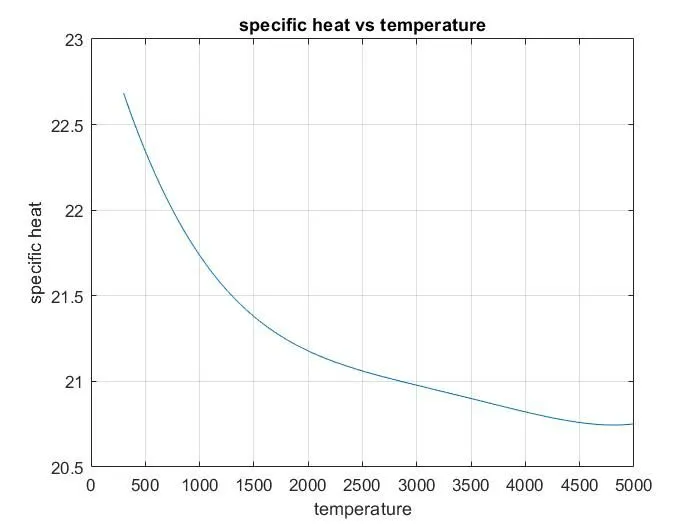
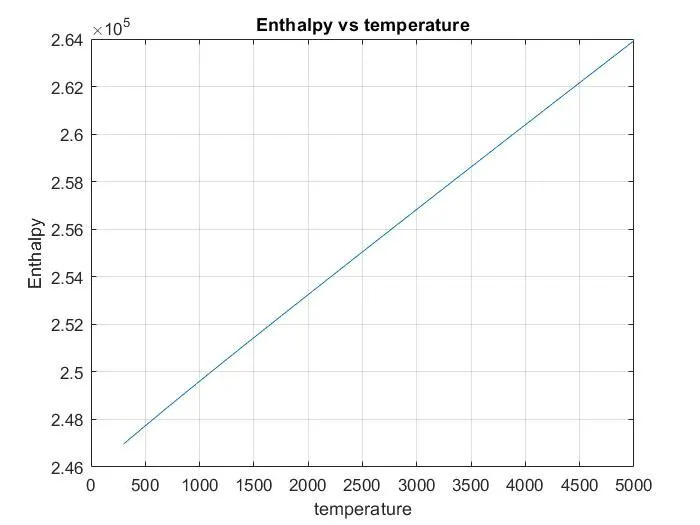
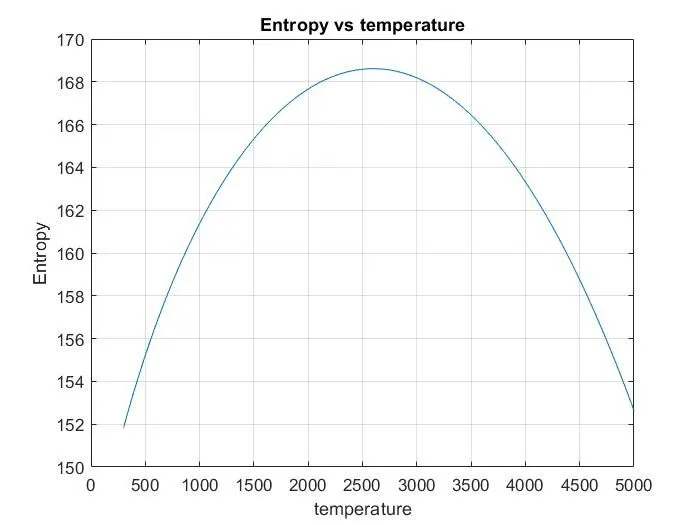
*Plotting the specific heat,enthalpy and entropy for the local temperature range.
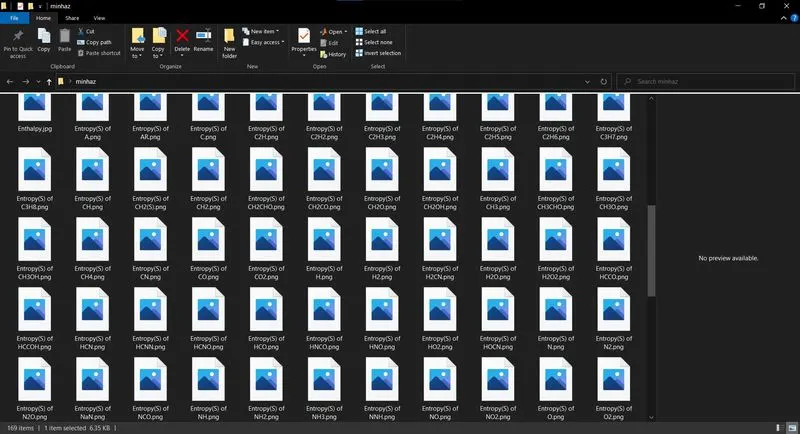
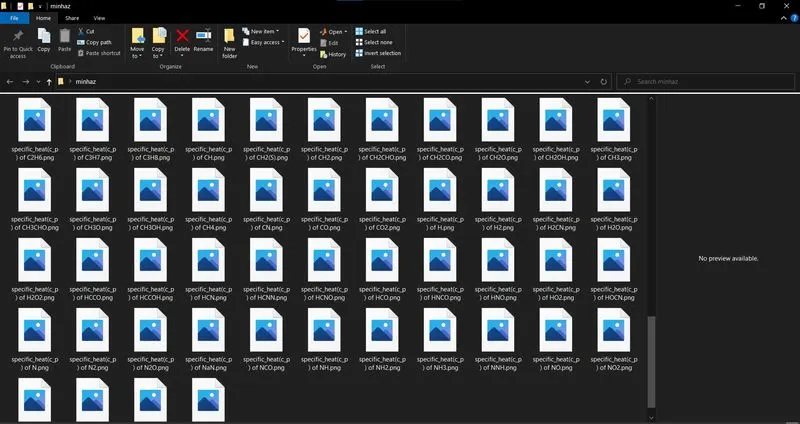
*Saving the plots as images with appropriate names and dumping them in separate folders for each
species.
File Parsing:-
File parsing is a string or symbol either in natural language computer language or data structure
confirm to the rules of the former grammer.
MATHEMATICAL EQUATION:-
`C_P/R=a1+a2T+a3T^2+a4T^3+a5T^4`
`H/RT=a1+a2 T/2+a3 T^2/3+a4 T^3/4+a5 T^4/5+ (a6)/ T`
`S/R=a1 logT + a2T+a3T^2/2+a4 T^3/3+a5T^4/4+a7`
where
T=local temperature;
a1-a7 = High temperature coefficient;
a8-a14 = Low temperature coefficient;
R = gas constant(8.314)
MAIN CODE:-
clear
close all
clc

f1=fopen('THERMO.dat','r');

fgetl(f1);
t_line=fgetl(f1);
s=strsplit(t_line,' ');


%Global temperaturers..(not using in the code)
global_low_temp=str2double(s{2});
global_medium_temp=str2double(s{3});
global_high_temp=str2double(s{4});

%Skipping the next 3 lines
for i=1:3
    skippedlines=fgetl(f1);
end

for j=1:53
t_line2=fgetl(f1);
z=strsplit(t_line2,' ')
species_name=(z{1});
A=strfind(t_line2,'G');
temp_values=t_line2(A+4:length(t_line2));
B=strsplit(temp_values,' ');


t1=str2double(B{1});
t2=str2double(B{2});
t3=str2double(B{3});


t_line3=fgetl(f1);
a=strfind(t_line3,'E');

t_line3(1:12+3);
a1=t_line3(1:a(1)+3);
a1=str2double(a1);

a2=t_line3(a(1)+4:a(2)+3);
a2=str2double(a2);


a3=t_line3(a(2)+4:a(3)+3);
a3=str2double(a3);

a4=t_line3(a(3)+4:a(4)+3);
a4=str2double(a4);


a5=t_line3(a(4)+4:a(5)+3);
a5=str2double(a5);

%line2  t_line4=fgetl(f1)
t_line4=fgetl(f1);
a=strfind(t_line4,'E');

a6=t_line4(1:a(1)+3);
a6=str2double(a6);

a7=t_line4(a(1)+4:a(2)+3);
a7=str2double(a7);


a8=t_line4(a(2)+4:a(3)+3);
a8=str2double(a8);


a9=t_line4(a(3)+4:a(4)+3);
a9=str2double(a9);


a10=t_line4(a(4)+4:a(5)+3);
a10=str2double(a10);


%line3  t_line5=fgetl(f1)
t_line5=fgetl(f1);
a=strfind(t_line5,'E');


a11=t_line5(1:a(1)+3);
a11=str2double(a11);

a12=t_line5(a(1)+4:a(2)+3);
a12=str2double(a12);


a13=t_line5(a(2)+4:a(3)+3);
a13=str2double(a13);


a14=t_line5(a(3)+4:a(4)+3);
a14=str2double(a14);

%universal gas constant
R=8.314;

T=linspace(t1,t2,100);

%cp_calculation is a function.
  [c_p]=specific_heat(a1,a2,a3,a4,a5,a8,a9,a10,a11,a12,t1,t2,t3,T,R);
%enthalpy_calc is a function
    [H]=enthalpy(a1,a2,a3,a4,a5,a6,a7,a8,a9,a10,a11,a12,a13,a14,t1,t2,t3,T,R);
%entropy_calc is a function
    [S]= entropy(a1,a2,a3,a4,a5,a6,a7,a8,a9,a10,a11,a12,a13,a14,t1,t2,t3,T,R);


   figure(1)
   plot(c_p,T);
   title('specific heat vs temperature')
   xlabel('specific heat')
   ylabel('temperature')
   grid on
   m1='specific_heat(c_p) of %s';
   m2=species_name;
   m3=sprintf(m1,m2);

   figure(2)
   plot(H,T);
   title('Enthalpy vs temperature')
   xlabel('Enthalpy')
   ylabel('temperature')
   grid on
   m4='Enthalpy(H) of %s';
   m5=species_name;
   m6=sprintf(m4,m5);

   figure(3)
   plot(S,T);
   title('Entropy vs temperature')
   xlabel('Entropy')
   ylabel('temperature')
   grid on
   m7='Entropy(S) of %s';
   m8=species_name;
   m9=sprintf(m7,m8);


 %changing directory
program =(['M:\file parsing\species\',species_name]);

saveas(figure(1),sprintf('%s.png',m3));
saveas(figure(1),sprintf('%s.png',m6));
saveas(figure(1),sprintf('%s.png',m9));

cd('C:\Users\shaik\Desktop\minhaz')

%calculating the molecular weight
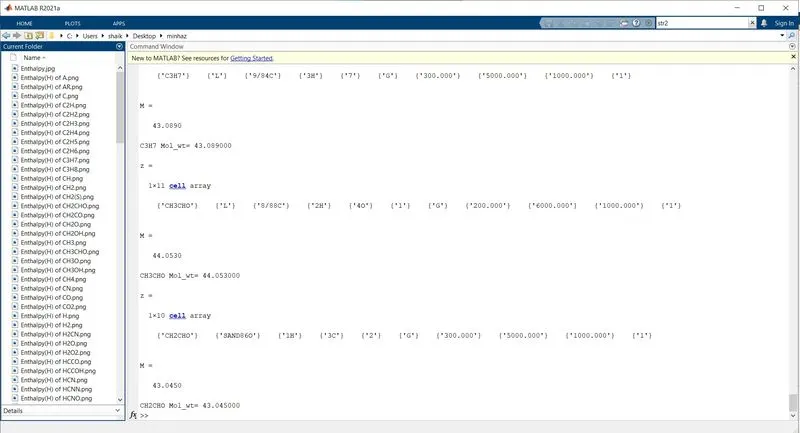
[M]= molecular_weight(species_name)
k=sprintf('%s Mol_wt= %f',species_name,M);
disp(k)

end
fclose(f1);EXPLANATION:-
Starts with clear all, close all and clc.
open file first with the help of "fopen" command,
read the file by step by step (or) line by line, Use "fgetl" command,
strsplit command used to split the input in the form of arrays(' '),
str2double command used to the input can include spaces,commas and semicolons to indicate seperate elements, this function does not convert cell arrays or non scalar string arrays.
neglecting or skipping the lines here we used "for" command,
after that we use "for" command to select the species_name by using the 'strsplit' and 'str2double' commands,
to find out the co-eff. we use findstr('E'), means find the position of 'E' in b/w the co_eff.
with this help we calculate the co_eff. from 1 to 14.
Temperature were taken by each species given by the 'THERMO.dat' file,
after that calc. the c_p,H,S by the help of function codes individually,
finally calc. the molecular wt. for each species,
function code of specific_heat, enthalpy, entropy:-
SPECIFIC HEAT

function [c_p]=specific_heat(a1,a2,a3,a4,a5,a8,a9,a10,a11,a12,t1,t2,t3,T,R)
a1 =2.5694;
a2 =-8.5974e-05;
a3 =4.1948e-08;
a4 =-1.0018e-11;
a5 =1.2283e-15;
a6 =2.9218e+04;
a7 =4.7843;
a8 =3.1683;
a9 =-0.0033;
a10 =6.6431e-06;
a11 =-6.1281e-09;
a12 =2.1127e-12;
a13 =2.9122e+04;
a14 = 2.0519;

R=8.314;
t1=200;
t2=3500;
t3=1000;
T=linspace(t1,t3,100);
    if (T>t2)
        c_p=R*(a1+(a2.*T)+(a3.*(T.^2))+(a4.*(T.^3))+(a5.*(T.^4)));

    else
       c_p=R*(a8+(a9.*T)+(a10.*(T.^2))+(a11.*(T.^3))+(a12.*(T.^4)));

    end
ENTHALAPY
function [H]=enthalpy(a1,a2,a3,a4,a5,a6,a7,a8,a9,a10,a11,a12,a13,a14,t1,t2,t3,T,R)
a1 =2.5694;
a2 =-8.5974e-05;
a3 =4.1948e-08;
a4 =-1.0018e-11;
a5 =1.2283e-15;
a6 =2.9218e+04;
a7 =4.7843;
a8 =3.1683;
a9 =-0.0033;
a10 =6.6431e-06;
a11 =-6.1281e-09;
a12 =2.1127e-12;
a13 =2.9122e+04;
a14 = 2.0519;
R=8.314;
t1=200;
t2=3500;
t3=1000;
T=linspace(t1,t3,100);
if (T>t2)
H=R*(a1*T+(a2*(T.^2)/2)+(a3*(T.^3)/3)+(a4*(T.^4)/4)+(a5*(T.^5)/5)+a6);
else
H=R*(a8*T+(a9*(T.^2)/2)+(a10*(T.^3)/3)+(a11*(T.^4)/4)+(a12*(T.^5)/5)+a13);
end
end.
ENTROPY

function [S]= entropy(a1,a2,a3,a4,a5,a6,a7,a8,a9,a10,a11,a12,a13,a14,t1,t2,t3,T,R)

a1 =2.5694;
a2 =-8.5974e-05;
a3 =4.1948e-08;
a4 =-1.0018e-11;
a5 =1.2283e-15;
a6 =2.9218e+04;
a7 =4.7843;
a8 =3.1683;
a9 =-0.0033;
a10 =6.6431e-06;
a11 =-6.1281e-09;
a12 =2.1127e-12;
a13 =2.9122e+04;
a14 = 2.0519;

R=8.314;
t1=200;
t2=3500;
t3=1000;
T=linspace(t1,t3,100);
    if (T>t2)
    S=R*(a1*log(T)+(a2*T)+(a3*(T.^2)/2)+(a4*(T.^3))+(a5*(T.^4)/4)+a7);
else
    S=R*(a8*log(T)+(a9*T)+(a10*(T.^2)/2)+(a11*(T.^3))+(a12*(T.^4)/4)+a14);
end
end
Molecular weight
function [M]= molecular_weight(species_name)
atomic_mass=[15.999,1.008,12.011,14.007,39.948];
elements=['O','H','C','N','Ar'];
mol_wt=0;
for i=1:length(species_name)
for j=1:length(elements)
if strcmp(species_name(i),elements(j))
mol_wt= mol_wt+atomic_mass(j);
z=j;
end
end
var=str2double(species_name(i));
if (var>1)
mol_wt=mol_wt+(atomic_mass(z)*(var-1));
end
M=mol_wt;
endcommand window:-
Molecular weight
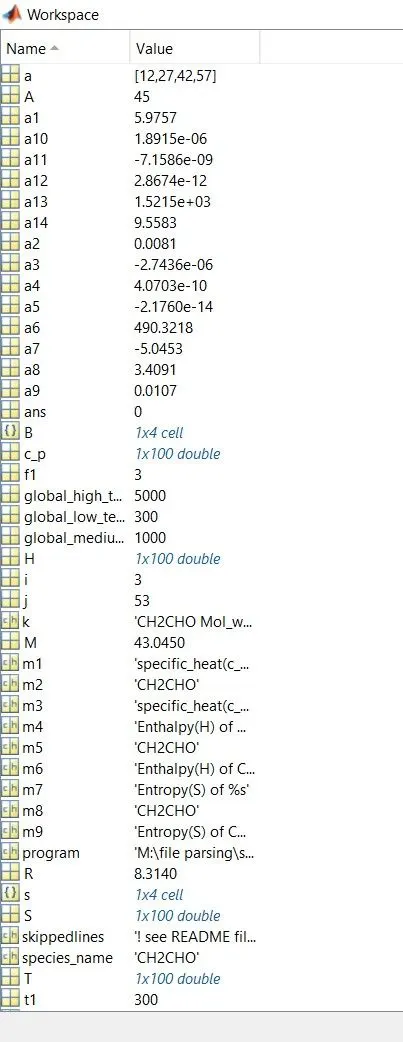
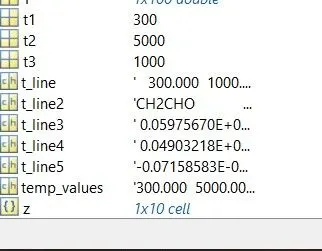
Workspace:-
PLOTS:-
for (C_P, H, S) vs T
Screen shots for species plots:-

ERRORS:-
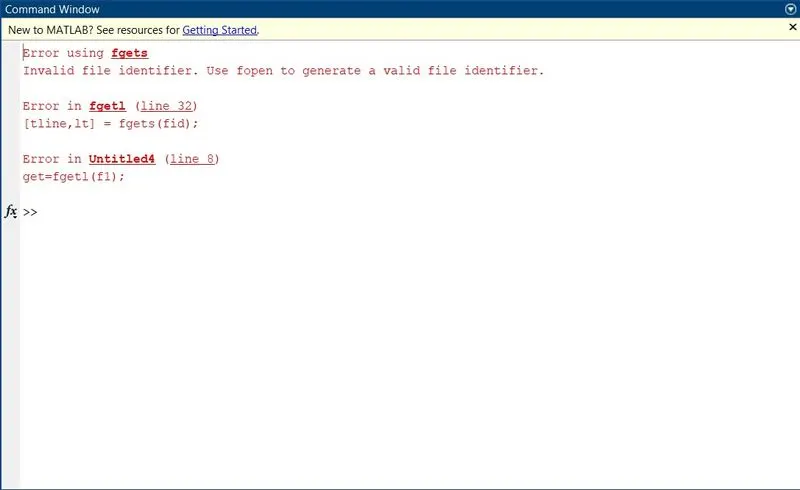
fgetl command error,
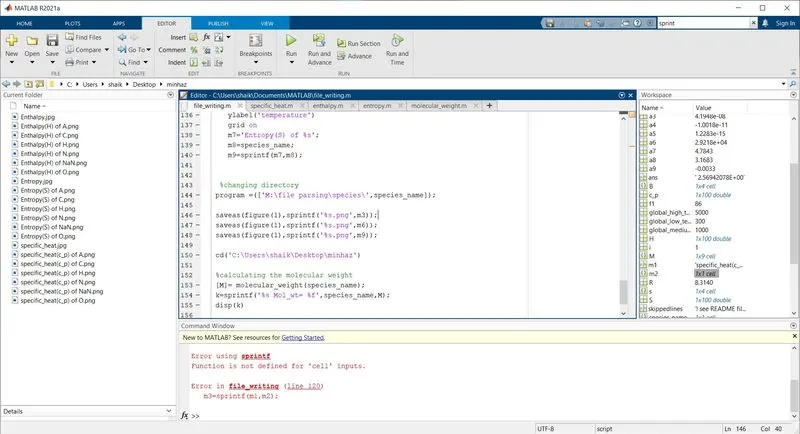
species_name are not correctly coded, and they are in the form of cell
Recheck the code and make it runs properly.